


Structural characterization
The results of elemental microanalysis (C, H, and N) confirm the formation of a 1:2 (VO:CG) complex. The experimentally obtained values are consistent with the calculated values based on the proposed molecular formula (Scheme 1). The synthesized compounds are stable under ambient conditions. The non-electrolytic nature of the chelate was confirmed by measuring the molar conductance of a 10−3 M solution in DMF32,33,34.
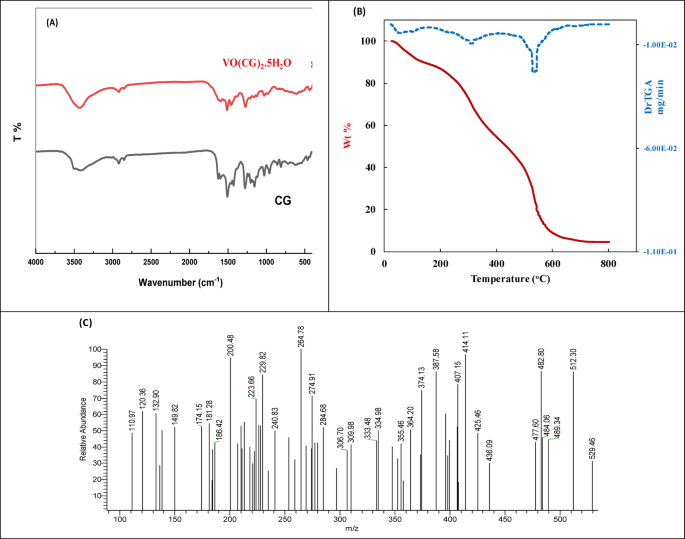
FT-IR Spectral Analysis: The FT-IR spectra, shown in Fig. 1A, provide evidence for the formation of the CG ligand and its vanadyl complex, as well as the proposed structure and coordination mode (Scheme 1). The diagnostic absorption band corresponding to ν(C = O) at approximately 1630 cm⁻1, observed in curcumin, disappears in the CG ligand, indicating effective condensation of glucosamine with curcumin and formation of an imine bond. Moreover, the appearance of a new band at 1511 cm⁻1, attributed to the ν(C = N) stretching vibration, further confirms the formation of the CG ligand. In vanadyl chelate (Fig. 1A), the band observed at 1506 cm⁻1 is assigned to the ν(C = N) stretching vibration, confirming the formation of the complex35. This slight shift to lower wavenumber compared with typical azomethine linkages may result from donation of the azomethine nitrogen lone-pair electron density to the metal ion, indicating involvement of the π-electron system in coordination36,37. In the infrared spectrum of the complex, the –OH stretching band observed at approximately 3456 cm⁻1 shows no significant shift, confirming that the phenolic hydroxyl groups are not involved in coordination with the vanadyl ion38. Overlapping of this band with vibrations from hydrated water molecules was also observed39,40. The band observed at approximately 1032 cm⁻1 may be attributed to δ(C–O) bending vibrations of the phenolic ring41. The bands observed at approximately 2920 cm⁻1 and 805 cm⁻1 are assigned to ν(C–H) stretching and δ(C–H) bending vibrations, respectively42. An absorption band observed at 972 cm⁻1 in the vanadyl complex is attributed to the ν(V = O) stretching vibration. This observation is consistent with previous reports that assign the ν(V = O) vibration to the region around 972 cm⁻1 in similar complexes4,27. Weak bands observed at approximately 431 cm⁻1 and 596 cm⁻1 in the spectrum of the metal complex are attributed to ν(V–N) and ν(V–O) vibrational modes, respectively, providing clear evidence for coordination of nitrogen and oxygen atoms to the metal ion4,27. The proposed structure of the complex, illustrated in Scheme 1, represents a hydrated vanadyl Schiff base complex, [VO(CG)2]‧5H2O. In this structure, the vanadyl ion is coordinated by two CG ligands, each acting as a bidentate chelator through nitrogen and oxygen donor atoms. The presence of water molecules in the hydrated form further stabilizes the coordination complex.
Fig. 1
(A) FTIR of CG and [VO(CG)2]‧5H2O complex, (B) TG curve of the [VO(CG)2]‧5H2O, (C) Mass spectrum of the CG ligand.
Thermogravimetric analysis was used to investigate the thermal stability and decomposition profile of the [VO(CG)2]‧5H2O complex, as shown in Fig. 1B. The TGA curve reveals three main successive mass loss steps. The initial mass loss occurs at approximately 107 °C and corresponds to the release of five hydrated water molecules, with a mass loss percentage of 6.97% (Exp.) and 7.30% (Theo.). Following dehydration, the compound undergoes two abrupt decomposition phases, which are ascribed to the ligand breakdown with mass loss (Exp. = 88.52% & Theo. = 88.56%). Upon heating up to 800 °C, metallic vanadium was obtained as the final residual, and the calculated and observed residual mass percentages (Exp. = 4.51% & Theo. = 4.13%) agreed well.
Mass Spectral Analysis: The mass spectrum of the synthesized CG ligand (Fig. 1C) exhibits a peak at m/z 529.46, corresponding to the molecular ion [M]⁺. These results are in good agreement with the proposed molecular formula of the ligand, as illustrated in Scheme 1.
DFT study
Figure 2 illustrates the optimized structures of the CG ligand and its vanadyl chelate, while Table S1 presents the anticipated bond lengths and angles. Upon coordination with the VO(II) ion, the bond lengths of the CG ligand, particularly those at the donor sites, undergo significant changes. Certain bonds undergo elongation and contraction to achieve the desired coordination structure, as detailed in Table S1. Following coordination, new bonds are formed between the CG ligand (specifically, the enolic oxygen and the nitrogen of the imine group) and the VO(II) ion. Alterations in the chelation surrounding angles specifically for (O19-C15-C16), and (N14-C12-C13), occur as a consequence of the bonding during the complex formation.
Fig. 2
Geometric structure of the CG ligand and the [VO(CG)2] complex.
The DFT study reveals that the VO(II) chelate exhibits a more negative energy value than the CG ligand, indicating a favorable chelation process. The vanadyl electron density increases from + 2 to 1.147 upon chelation, attributed to charge transfer from the CG ligand to vanadium. The molecular electrostatic potential (MEP) analysis identifies specific structural active sites. Atoms with positive electrostatic potential tend to attach to the regions of negative electrostatic potential, which act as active sites for vanadium ion coordination. The MEP analysis of the vanadyl complex reveals negative electrostatic potential areas at the coordination centers (N14 and O19) and positive potential regions across the framework, as shown in Fig. 2, which enhances its biological activity43.
Figure 3 illustrates the exploration of frontier molecular orbitals (FMO). The electron density is concentrated on the heteroatoms, particularly at the donor sites involved in the coordination. Using density functional theory (DFT), several features of the synthesized vanadyl complex, such as dipole moment, hardness (η), softness (S), energy gap, chemical potential (μ), and electronegativity (χ), were calculated and are presented in Table 2. These parameters were computed utilizing the following formulas:
Fig. 3
FMO of the CG ligand and the [VO(CG)2] complex.
Table 2 Ground state properties of the CG ligand and [VO(CG)2] chelate, calculated using B3LYP/6-311G and B3LYP/LANL2DZ, respectively.
$${\varvec{\upeta}}=\frac{(\text{I}-\text{A})}{2}, \mathbf{S} =\frac{1}{2\upeta }, {\varvec{\upmu}} =\frac{-\left(\text{I} +\text{A}\right)}{2}, {\varvec{\upchi}} =\frac{(\text{I} + \text{A})}{2}$$
The HOMO–LUMO energy gap reveals that the VO(II) chelate is a softer molecule than its parent CG ligand. As shown in Fig. 3, a smaller HOMO–LUMO gap corresponds to a softer molecule, with the frontier molecular orbitals being represented by the HOMO and LUMO. Hardness is the reverse of softness, which is the capacity to accept electrons44. The energy needed to detach an electron is defined by the ionization potential, which corresponds to the energy of the highest occupied molecular orbital (HOMO), while the energy of the lowest unoccupied molecular orbital (LUMO) relates to electron affinity, releasing energy when an additional electron is incorporated into the system. The considerable energy difference between the HOMO–LUMO values of the CG ligand and its chelate illustrates the stability of the molecules. Nonetheless, the VO(II) complex demonstrates heightened susceptibility to electron transfer from electron-rich species. The polarity of the CG ligand increases upon interaction with the VO(II) ion, as evidenced by the larger dipole moment. After chelation, the electron clouds of the FMO orbitals extended to include the metal’s coordination center.
Measurement of cytotoxicity on MCF-7 cells using a GLUT inhibitor mediated cytotoxicity assay
The cytotoxic activity of the synthesized curcumin–glucosamine conjugate (CG) and its vanadyl complex, [VO(CG)₂]·5H₂O, was evaluated against MCF-7 human breast cancer cells using the MTT assay after 24 h of exposure. Both compounds induced a concentration-dependent reduction in cell viability relative to untreated controls (Fig. 4A), and the mean values with their standard deviations are presented in Table S2. The free CG ligand demonstrated significantly higher antiproliferative activity, exhibiting an IC₅₀ value of 7.51 ± 0.12 μg/mL (14.2 μM), whereas the corresponding vanadyl complex showed weak cytotoxicity with an IC₅₀ value of 199.82 ± 3.52 μg/mL (164.3 ± 2.9 μM).
Fig. 4
Cytotoxic effects and morphological analysis of MCF-7 breast cancer cells. (A) The MTT assay demonstrated a significant reduction in the viability of the breast cancer cell line (MCF-7) after 24 h of treatment with different concentrations of the free CG ligand, [VO(CG)₂] complex, quercetin, and CG+ quercetin with corresponding IC₅₀ values. (B–E) Representative inverted microscopy images (60× magnification) illustrating morphological changes in MCF-7 cells after treatment with (B) CG, (C) [VO(CG)₂] complex, (D) Quercetin, and (E) CG + quercetin.
Morphological examination of treated cells under an inverted microscope revealed cellular changes consistent with apoptosis, including reduced cell density, cellular shrinkage, membrane blebbing, and apoptotic body formation (Figs. 4B and C), consistent with the cytotoxic effects observed in the viability assay.
To investigate the potential involvement of glucose transporters (GLUTs) in the cellular uptake of the glycoconjugate, a GLUT inhibition assay was performed using quercetin, a reported inhibitor of GLUT1, GLUT3, and GLUT4. Consistent with previous reports, quercetin alone exhibited marked antiproliferative activity against MCF-7 cells, with an IC₅₀ value of 7.52 ± 0.75 μg/mL (24.9 ± 2.5 μM), reflecting its intrinsic pro-apoptotic and growth-inhibitory properties in breast cancer cells45. The concentration of quercetin used for co-treatment (90 µg/mL) was selected based on previously reported concentrations used in cellular studies investigating its GLUT inhibitory activity and biological effects4,26,46.
Notably, co-treatment of MCF-7 cells with quercetin at a fixed concentration of 90 µg/mL and varying concentrations of the CG ligand resulted in a significant increase in the IC₅₀ value of CG to 104.11 ± 1.49 μg/mL (125.0 μM), representing a substantial reduction in antiproliferative potency. This reduction in activity is consistent with the possibility that GLUT inhibition may contribute to reduced cellular uptake of the glycoconjugate. The observed antagonistic interaction supports the potential involvement of glucose transporters in modulating CG cellular uptake. These findings suggest that GLUT-mediated uptake may partially contribute to the anticancer activity of CG.
Morphological assessment of cells treated with CG in the presence of quercetin further demonstrated apoptotic features, including decreased cell density, cellular shrinkage, membrane blebbing, echinoid spike formation, and apoptotic bodies (Fig. 4D). Collectively, these findings support a possible contribution of glucose transporters to the cellular uptake of the curcumin–glucosamine conjugate and are consistent with the proposed involvement of GLUT-mediated uptake pathways.
Apoptotic gene induction
The mRNA expression levels of apoptotic genes such as Bax, alongside cell cycle regulators such as cyclin-dependent kinases CDK6, CDKN1A, and STK11, were measured. All samples were compared to untreated MCF-7 (control) samples. As shown in Fig. 5A, there were significant differences between the different exposure times. When compared to the control, all BAX groups showed a statistically significant upregulation (p ≤ 0.05) across all exposure times. CDK6 gene expression after 24 and 72 h showed a significant upregulation (p ≤ 0.05) compared to the control. In addition, CDKN1A gene expression showed a significant upregulation (p ≤ 0.001) across all exposure times. As shown in Fig. 5B, STK11 showed a significant upregulation (p ≤ 0.001) when compared to control samples.
Fig. 5
(A) Gene expression levels of BAX, CDK6, and CDKN1A in MCF-7 cell lines after 24, 48, and 72 h of CG exposure. Data are shown as fold changes relative to GAPDH and are presented as mean ± SD. Different lowercase letters (a, b, c) indicate statistically significant differences at p ≤ 0.05. As “a” any treatment time point (e.g., 24 h) indicates that no significantly different from the control, if the 24 h exposure is significantly different from the control, it gets a “b”. If the 48 h exposure is significantly different from both the control and the 24h exposure, it gets a “c”. If the 48h exposure is different from the control but the same as the 24 h exposure, it shares the “b”. (B) Gene expression levels of STK11 in MCF-7 cell lines after 24, 48, and 72 h of exposure. Data are shown as fold changes relative to GAPDH and are presented as mean ± SD. Different lowercase letters (a, b, c) indicate statistically significant differences at p ≤ 0.05.
BAX is a pro-apoptotic gene that promotes apoptosis in cancer cells. Glycoconjugation allowed the free CG ligand to be selectively taken up by MCF-7 cells47. The uptake induced DNA damage through the binding of free CG ligand to the DNA. Such genotoxic stress activated cellular apoptotic pathways, including the mitochondrial pathway, by upregulating the expression of the BAX gene. As shown in the results, 24 h of exposure was optimum for elevating the BAX gene expression to activate the apoptotic pathways, which facilitates the activation of the caspase cascade48. Additionally, the DNA damage induced by binding of the CG ligand triggered a significant upregulation of the CDKN1A gene. Because CDKN1A encodes the p21 protein—a well-established cyclin-dependent kinase inhibitor—its transcriptional activation suggests a potential molecular mechanism for altering cell cycle progression. However, we acknowledge that mRNA expression levels alone do not definitively confirm functional cell cycle arrest. Further functional investigations, such as flow cytometry analysis, are required to confirm cell cycle arrest and identify any specific phase blocks49. In contrast, the upregulated CDK6 may indicate resistance to metabolic and oxidative stress caused by the uptake of the free CG by MCF-7 through GLUT receptors. After 48 h of exposure, the expression of CDK6 was unchanged compared to the control group, while after 72 h of exposure, CDK6 showed upregulation, which might indicate that prolonged exposure to the free CG could lead to cellular resistance to treatment50. Moreover, such cellular stress could activate the AMPK pathway. Alterations in AMPK levels further promote the expression of STK11 due to its critical role in regulating cellular energy by negatively regulating the mTOR pathway, which reduces protein synthesis and cell proliferation51,52.
While our study evaluated the gene expression profile of the fully synthesized CG glycoconjugate, the individual precursor moieties are well-documented in the literature to independently modulate key cell cycle and apoptotic regulators. Curcumin has been established as a potent modulator of both pro- and anti-apoptotic proteins8,9; it targets the AMPK/STK11 signaling axis, upregulates the pro-apoptotic BAX protein, and directly induces cell cycle arrest via the profound upregulation of CDKN1A (p21) in MCF-7 cells9,49. Similarly, glucosamine exhibits inherent antineoplastic properties by interfering with tumor metabolism; it induces endoplasmic reticulum stress-mediated apoptosis and triggers cell cycle arrest accompanied by elevated CDKN1A expression23.
Cell cycle analysis using flow cytometry
To better understand the mechanism underlying the antiproliferative activity of the CG ligand, cell-cycle progression in MCF-7 cells was analyzed by flow cytometry following Propidium Iodide (PI) staining. Representative DNA content histograms are presented in Fig. 6 using a linear fluorescence intensity scale, whereas the corresponding logarithmic histograms are provided in Fig. S2 for comparison and improved visualization of the sub-G1 apoptotic population. As shown in Fig. 6, untreated control cells exhibited a typical cell-cycle distribution, with 75.75% of cells in the G0/G1 phase, 22.22% in the S phase, and 2.04% in the G2/M phase. Following 24 h of treatment with the CG ligand, the cell-cycle profile was markedly altered, with the S-phase population increasing to 49.40% and the G0/G1 population decreasing to 46.86%, while only a small proportion of cells remained in the G2/M phase (3.73%). These findings indicate that the CG ligand induces S-phase cell-cycle arrest, thereby impairing normal cell-cycle progression. The observed S-phase arrest is consistent with our DNA-binding and gene expression findings, which together support the antiproliferative activity of the CG ligand. In particular, qPCR analysis revealed significant upregulation of the cyclin-dependent kinase inhibitor CDKN1A (p21) following treatment. Collectively, these findings suggest that disruption of cell-cycle progression may contribute to the induction of apoptosis, consistent with the increased expression of the pro-apoptotic BAX gene and activation of the AMPK–STK11 signaling pathway.
Fig. 6
Flow cytometric cell-cycle analysis of MCF-7 breast cancer cells following treatment with the curcumin–glucosamine (CG) ligand. Representative Propidium Iodide (PI) DNA content histograms displayed on a linear fluorescence intensity scale are shown for (a) untreated control cells and (b) cells treated with the CG ligand at its IC₅₀ (7.51 ± 0.12 µg/mL) for 24 h. (c) Distribution of cells in the G0/G1, S, and G2/M phases. Treatment with the CG ligand increased the S-phase population from 22.22 to 49.40%, indicating S-phase cell-cycle arrest.
Thermal denaturation
Thermal denaturation studies were employed to evaluate the effects of curcumin and its vanadyl complex on CT-DNA stability and to infer the nature and strength of their binding interactions53. Changes in DNA melting temperature (Tm) reflect the binding strength of small molecules to DNA54, where Tm corresponds to the temperature at which half of the DNA duplex is denatured55. The melting curves of CT-DNA in the absence and presence of the ligand and complex are shown in Fig. 7. Free CT-DNA exhibited cooperative melting between 75–85 °C, with a Tm of approximately 75 °C, consistent with previous reports56. In the presence of the ligand and the vanadyl complex, a moderate increase in Tm (ΔTm ≈ 5 °C) was observed, indicating stabilization of the DNA duplex.
Fig. 7
Melting curves of CT-DNA in Tris–HCl Buffer in the absence and presence of the CG ligand and [VO(CG)2] complex, [DNA] = 50 μM, [compound] = 50 μM, showing an increase in Tm due to Binding.
Although this assay did not include an internal positive control, the thermal denaturation characteristics of traditional intercalators under similar buffer conditions are well-documented. For example, classical intercalators like ethidium bromide often produce notable melting temperature shifts (ΔTm) of 10 °C to 15 °C or more, owing to their strong stabilization of the DNA double helix57. Conversely, the observed moderate increase (ΔTm ≈ 5 °C) for the vanadyl complex and ligand is considerably lower than these typical intercalative effects. This moderate stabilization is consistent with reports of non-intercalative binding modes, such as groove or electrostatic interactions, which are likely responsible for their primary mode of binding58.
The increased thermal stability may also arise from interactions of cationic species with the DNA phosphate backbone59. Overall, the thermal denaturation results support a non-intercalative binding mode, most likely groove or electrostatic binding, for the vanadyl complex and ligand with CT-DNA60.
BSA binding studies
Evaluating drug-protein interactions is vital for understanding the pharmacokinetics of new chemotherapeutics. Bovine serum albumin (BSA), similar to human serum albumin (HSA), the main blood carrier for metal drugs, helps assess how well compounds bind. This reveals their transport efficiency, circulation half-life, and bioavailability prior to cellular uptake via GLUT transporters in MCF-7 cells.
The interaction of BSA with the ligand and its vanadyl complex was investigated by UV–Vis absorption spectroscopy. Increasing concentrations of the ligand (10–100 µM) led to a concentration-dependent increase in BSA absorbance at ~ 280 nm, indicating complex formation and changes in the microenvironment of aromatic residues (Fig. 8A). The apparent binding constant (Kapp) was calculated as 1.61 × 10⁴ M⁻1 and 2.71 × 10⁴ M⁻1 for the BSA–ligand system and the BSA–vanadyl complex, respectively (Fig. 8B). These magnitudes suggest a moderate binding affinity and are consistent with values reported for various small organic and metal-based ligands interacting with BSA via non-covalent forces. UV–Vis spectral titration approaches, similar to those used here, have been established in the literature to estimate binding constants by monitoring changes in absorption intensity as ligand concentration increases61.
Fig. 8
(A) UV–visible absorption spectra of the ligand and (B) its vanadyl complex with increasing concentrations (10–100 µM) at a constant 1% of BSA in phosphate-buffered saline (PBS). Inset: Linear plots of 1/(Aobs − A₀) vs. 1/[complex] (104 M) for the binding of BSA to the ligand and vanadyl complex.
DNA binding test
Electronic absorption spectroscopy is a powerful tool for investigating the binding of metal complexes to DNA, where changes in absorption intensity indicate DNA interaction54. UV–Vis titration experiments were carried out at fixed concentrations of the vanadyl complex (200 µg/mL) and ligand (0.2 µg/mL), while the CT-DNA concentration was gradually increased from 0 to 100 µM. Upon DNA addition, both the ligand and the vanadyl complex exhibited hyperchromic effects accompanied by a slight red shift in the absorption bands (260–270 nm), suggesting interaction with DNA and partial disruption of the duplex structure (Fig. 9A)62. Such spectral behavior is characteristic of intercalative or groove binding modes53. The pronounced hyperchromism is attributed to π–π* interactions and possible hydrogen bonding between DNA bases and heteroatom-containing groups of the compounds63. The intrinsic DNA-binding constants (Kb) were calculated from absorption titration data, yielding values of 1.86 × 10³ M⁻1 for the ligand and 2.31 × 10³ M⁻1 for the vanadyl complex, indicating significant DNA affinity, with the vanadyl complex showing stronger binding ability (Fig. 9B)64.
Fig. 9
UV–visible absorption spectra of the CG ligand and the VO(II) complex and the ligand at a concentration of 200 μg/mL and 0.2 μg/mL, respectively, following titration with increasing CT-DNA concentrations (0.00–100.00 μM) in Tris–HCl buffer solution. Inset: Linear plots of [DNA]/(Ɛa–Ɛf) × 109 M2cm vs. [DNA] for CT-DNA titration to the ligand (A) and the [VO(CG)2] complex (B).
DNA binding test (gel electrophoresis) and CT-DNA Viscosity
The interaction of the tested vanadyl complex with CT-DNA was studied using agarose gel electrophoresis and viscosity measurements, as shown in Figs. S2 and 10. Gel electrophoresis showed reduced DNA mobility and band intensity with increasing complex concentration, indicating DNA binding and possible conformational changes that limit ethidium bromide intercalation. Viscosity studies revealed only a slight increase in DNA viscosity, suggesting minor structural stiffening without significant helix elongation. Together, these results indicate that the vanadyl complex binds to CT-DNA mainly through groove binding or electrostatic interactions rather than classical intercalation.
Fig. 10
Effect of increasing concentrations of the complex on CT-DNA viscosity. [Complex]/[DNA] = 0.20–1.00, [CT-DNA] = 100 μM.
Protein denaturation inhibition test
Non-steroidal anti-inflammatory drugs exert their effects mainly through the inhibition of protein denaturation, lysosomal enzyme activity, or membrane stabilization. Inflammation is commonly associated with protein denaturation or lysosomal enzyme release by leukocytes, as observed in arthritis65. The prepared CG compound exhibited 50% ± 0.02% inhibition of protein denaturation at 10 µg/mL, indicating its potential as a promising anti-inflammatory agent; however, further studies are required to confirm this activity.
Molecular docking
Docking on EGFR, PTP1B, and BSA receptors
The molecular docking study evaluated the binding interactions of the CG ligand and its vanadyl(II) complex with the EGFR active site (PDB ID: 1M17) to understand their cytotoxic behavior. The ligand showed strong interactions through hydrophobic, hydrogen bonding, and electrostatic interactions with key residues, including Ala698, Arg817, Asp737, Lys836, Glu734, and Gly833 as seen in Fig. 11 and Table S3. These interactions indicate a more stable and stronger binding affinity for the ligand compared to the vanadyl(II) complex.
Fig. 11
2D and 3D interactions of (A) the CG ligand and (B) [VO(CG)2] complex with the EGFR receptor.
GLUT receptors, particularly GLUT1, play a crucial role in glucose uptake and are frequently overexpressed in cancer cells to satisfy their elevated metabolic demands. Consequently, GLUT1 has emerged as an attractive molecular target for anticancer drug design. In this context, the affinity of our glycoconjugate compounds toward GLUT receptors, especially GLUT1, was investigated to evaluate their potential targeting capability. The interaction with GLUT1 may facilitate selective uptake of these compounds by cancer cells, thereby enhancing their cytotoxic efficacy through interference with glucose transport and cancer cell metabolism, as seen in Fig. S3 and Table S4.
ADMET prediction
ADMET predictions using SwissADME showed that both compounds are non-mutagenic, non-hepatotoxic, and non-skin sensitizers, indicating good biocompatibility, as seen in Table S5. The ligand exhibited higher GI absorption, no hERG inhibition, and a higher LD₅₀ value, suggesting better pharmacokinetic behavior and lower acute toxicity than the vanadyl complex. In contrast, the vanadyl complex showed improved chronic tolerance based on its LOAEL value. Overall, the ligand demonstrated a more favorable ADMET profile, while the vanadyl complex may be more suitable for chronic administration under controlled cardiotoxicity conditions.
