


Cell culture
Cell lines were obtained from ATCC. As previously described9,10,11,13,14, A549, A375, MDA-MB-231 and HEK 293T cells were cultured in Dulbecco’s modified Eagle’s medium (DMEM; Gibco). RA and PC3 cells were maintained in Roswell Park Memorial Institute (RPMI) 1640 Medium (Gibco). All media were supplemented with 10% fetal bovine serum (Serana) and 100 U ml−1 penicillin−streptomycin (Gibco). Cell lines were cultured in a humidified incubator at 37 °C with 5% CO2 and were routinely tested negative for Mycoplasma contamination by PCR.
Tryptophan-free DMEM/F12 medium was obtained from US Biologicals, and histidine-, phenylalanine- and arginine-free DMEM were custom made (Cell Culture Technology). In contrast to amino acid sufficient media, depleted media were supplemented with 10% heat-inactivated, dialysed fetal bovine serum (Gibco). MG-132 (Selleckchem) was used at a final concentration of 10 µM for 4 h. IFNγ (PeproTech), 1-methyl-L-tryptophan (Sigma) cycloheximide (CHX) (MedChem Express) and harringtonine (harr; Sigma-Aldrich) were used as indicated.
T cell culture
TCRTMBIM6W>F.1 and TCRMART-1 transduced T cells were maintained as described in ref. 13 in RPMI 1640 medium supplemented with 10% human serum (One Lambda), 100 U ml−1 penicillin–streptomycin and with 50 U ml−1 IL-2 (Proleukin, Novartis). OT-1 T cells were isolated as described in ref. 11 using a Dynabeads Untouched Mouse CD8 Cells kit (Invitrogen) according to the manufacturer’s protocol and maintained in RPMI 1640 medium containing 10% fetal bovine serum, 50 µM 2-mercaptoethanol (Sigma), 100 U ml−1 penicillin−streptomycin, 100 µg ml−1 IL-2 (ImmunoTools), 5 µg ml−1 IL-7 (ImmunoTools) and 10 µg ml−1 IL-15 (ImmunoTools). When co-cultured with cancer cells, T cell were maintained overnight in RPMI 1640 with 10% fetal bovine serum, supplemented with or without IFNγ.
Generation of plasmids
The drW and drF-vector, were generated using primers listed in Supplementary Tables 1 and 3. To generate the drA-vector, the GeneArt site-directed mutagenesis system (Invitrogen) was used according to the manufacturer’s protocol using the primers listed in Supplementary Table 2. The sgRNAs were cloned in pLentiV2-puro using the Zhang laboratory protocol62,63 with primers listed in Supplementary Table 4 (ref. 20). pCDH-Hygro H-2Kb was used from ref. 9. pCDH BFP was cloned from pCDH-CAG-NCreIntN-EF1a-mTagBFP2 (gift from S. Je (Addgene, #160507; RRID:Addgene_160507)) using the primers listed in Supplementary Table 5. Gene fragments were obtained from IDT for ADAR1, ADAR1 H910Y-E912A, FTSJ1, FTSJ1 A26P and FTSJ1 K28A. All produced vectors were Sanger-sequenced (Macrogen).
sgRNA library transformation
The human pLentiCRISPR-v2 pooled KO library (Brunello) was a gift from D. Root and J. Doench (Addgene; plasmid #73178)20. Endura electrocompetent cells (Lucigen) were transformed with Brunello library plasmids as described in ref. 64. Plasmid DNA was prepared from bacterial cultures using PureLink HiPure Plasmid Maxiprep kit (QIAGEN).
Lentiviral production and transduction
HEK 293T cells were used as described in ref. 11. Vectors of interest, pMDL RRE, pVSV-G and pRSV-REV plasmids were transfected using polyethyleneimine (Polysciences). Cells were transduced by adding, previously frozen, lentiviral supernatant supplemented with Polybrene (Sigma). Cells were selected using 5 µg ml−1 blasticidin (Invivogen), 2 μg ml−1 puromycin (Bio-connect) or 50–1,000 µg ml−1 hygromycin B (Gibco).
Reverse transcription
Total RNA was extracted from A549-drW.1 cells using TRIzol reagent (Invitrogen), according to manufacturer’s instructions. Samples were treated with Turbo DNase (Thermo Fisher Scientific) and RNA was purified using the Zymo RNA Clean and Concentrator-5 kit (Zymo Research). RNA was converted to complementary DNA with the High-Capacity cDNA Reverse Transcription kit (Applied Biosystems), according to the manufacturer’s instructions, using random hexamers for priming. Samples were then sent for Sanger sequencing (Macrogen) with primers in Supplementary Table 6.
Genome-wide CRISPR/Cas9 screen
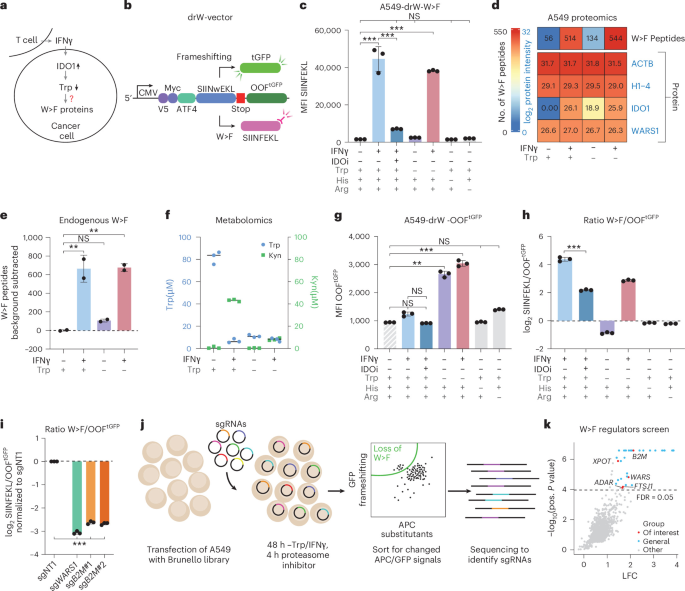
Two replicates of A549-drW.1 cells transduced with the pLentiCRISPR-v2 Brunello library were seeded, maintaining a 300× coverage at MOI 0.3. Cells were selected with puromycin and cultured for 8–9 days before treatment. MG-132 was added for 4 h. Cells were stained with H-2Kb-bound to SIINFEKL antibody (BioLegend, clone 25-D1.16, 1:200 antibody) for 30 min at 4 °C (ref. 9). After two washes, cells were resuspended in BSA–PBS with 4,6-diamidino-2-phenylindole (DAPI) (Invitrogen). The top 1% GFP+APC− cells of the −Trp/IFNγ group were sorted. DNA was extracted using a Puregene Cell kit (QIAGEN) according to the manufacturer’s protocol. Sequencing libraries were prepared using the primers listed in Supplementary Tables 7 and 8. PCR replicates were pooled and cleaned using the ISOLATE II PCR with Gel cleanup kit (Bioline) followed by CleanNGS beads (CleanNA) before analyses on a 2100 Bioanalyzer using a 7500 chip (Agilent). Then they were quantified with a KAPA qPCR Library Quantification kit (Roche, KK4824) and sequenced with 75-bp single reads on a NextSeq550 using a High Output kit v.2.5 (75 Cycles) (Illumina) with the addition of 20% PhiX Sequencing Control V3 (Illumina, FC-110-3001) in the sequence pool.
CRISPR/Cas9 screen analysis
Read counts per sgRNA were obtained from raw read count files using the caRpools library in R65. To assess relative changes between starting and final cell population, MAGeCK software was employed using bulk sgRNAs for normalization21. Only the genes identified by at least three sgRNAs were plotted. log2 fold change and the raw P value (using permutation) of this gene in negative selection were plotted in the volcano plot.
Western blotting
Cells were lysed in 1× Laemmli buffer and BCA-quantified. Proteins were separated by SDS–PAGE gels and transferred to 22 μm pore size nitrocellulose membranes (Santa Cruz). Staining was performed using ADAR1 (Santa Cruz, 1:200 dilution), Tubulin (Santa Cruz, 1:10,000 dilution), IDO1 (Cell Signaling Technology, 1:1,000 dilution), ABCE1 (Abcam, 1:1,000 dilution), RACK1 (Cell Signaling, 1:1,000 dilution), ZNF598 (Invitrogen, 1:1,000), WARS1 (Invitrogen, 1:1,000 dilution), antibodies. IRDye 680RD donkey anti-mouse (LI-COR, 1:10,000 dilution), IRDye 800CW goat anti-rat (LI-COR, 1:10,000 dilution) and IRDye 680RD donkey anti-rabbit (Li-COR, 1:10,000 dilution) were used as secondary antibodies. Visualization was performed by using an Odyssey infra-red scanning device (LI-COR).
Proteomics sample preparation
Cell pellets were lysed in 1× S-Trap Lysis buffer (5% SDS and 50 mM TEAB pH 8.5), boiled and sonicated. Then, 30 µg of protein was digested using S-Trap micro-columns (ProtiFi) according to the manufacturer’s protocol. In brief, samples were reduced and alkylated using TCEP (5 mM, 15 min, 55 °C) and CAA (20 mM, 10 min). The samples were acidified and a methanol TEAB buffer was added, before loading on the S-Trap column. Trapped proteins were washed four times with the methanol TEAB buffer and then digested for 2 h at 47 °C using trypsin (Sigma-Aldrich, 3 μg per sample).
For 2D LC–MS/MS, cell pellets were processed the same, after which 200 µg aliquots were digested with 20 µg trypsin using S-Trap Mini spin columns. The 100-µg digest was subjected to basic reversed-phase (HpH-RP) high-performance liquid chromatography for offline peptide fractionation as described previously10, with the flow rate set to 0.3 ml min−1 at the start and end of the method. Peptides were eluted at a constant flow of 100 μl min−1 in a 35-min gradient containing a nonlinear increase from 5.5–28% solvent B. Collected fractions were concatenated to a total of 12 fractions per sample.
Proteomics mass spectrometry
For single-shot proteomes, data-independent acquisition (DIA) analyses were performed on the Orbitrap Astral mass spectrometer (Thermo Scientific) connected to a Vanquish Neo nano-LC system (Thermo Scientific) in a 30 samples-per day (30SPD) LC–MS method. The Vanquish Neo was operated in the trap-and-elute mode and peptides (~1 µg of digest) were loaded onto a Pepmap 100 C18 5 µm trap column (300 µm × 5 mm, Thermo Scientific), before separation on the analytical column (AUR3-25075C18-TS, 1.7 µm/75 µm × 25 cm, IonOpticks AU) mounted into an Easyspray ion source (Thermo Scientific). The column was heated at 50 °C with flow rate 0.5 µl min−1 at the start of the method. Solvent A was 0.1% formic acid/water and solvent B was 0.1% formic acid/80% acetonitrile. Peptides were eluted at 0.4 µl min−1 in a 35.7 min effective gradient, containing a non-linear increase from 8% to 45% solvent B, followed by a 0.4-min ramp to 99% solvent B and 3.4 min wash at 0.75 µl min−1 flow rate at the end. The column was equilibrated using the ‘fast equilibration’ script in combined control mode at a 1,450-bar limit. The Orbitrap Astral was run in DIA mode, with full MS scans being collected in the Orbitrap analyzer at 240,000 resolution at m/z 200 over a 380–980 m/z range. The default charge state was 2+, the normalized AGC target was set to 500% (equivalent to 5 × 10⁶ charges) and the maximum injection time was 5 ms. For DIA MS2, a normalized HCD collision energy of 25% was applied to a 380–980 m/z precursor range using non-overlapping isolation windows of 2 Th, with window placement optimization. Scans were acquired in the Astral analyzer over a 100–1,000 m/z range, with the normalized AGC target set to 500% (equivalent to 5 × 10⁴ charges) and a maximum injection time of 3 ms. DIA analyses of HpH-RP fractions (~1 µg peptides per fraction) were performed using the same instrumental setup and settings, but with a shorter (60SPD|70SPD) LC gradient.
Generation of proteomics mutant database
The human proteome was obtained from UNIPROT66. Each substituted database was generated as described11. In brief, all occurrences of either tryptophan, phenylalanine or histidine were replaced by other amino acids in a separate database (FASTA file). As per the database, tryptophan is substituted with phenylalanine, phenylalanine with tyrosine, or histidine with glutamine.
Proteomics database search and filtering
Raw MS data were converted to the mzML format using ThermoRawFileParser (v.1.4.2) with centroiding enabled for MS2 spectra to ensure compatibility with downstream analysis. The converted mzML files were analysed using DIA-NN (v.1.8.1) for DIA peptide and protein identification and quantification. Search parameters were configured to enable trypsin digestion and allowing up to one missed cleavage. Searches were performed using precursor m/z values of 300–1,800 (charge states +1 to +4), fragment m/z values of 200–1,800 and peptide lengths of 7–50 amino acids. Methionine excision was enabled. Variable modifications included protein N-terminal acetylation and methionine oxidation, with a maximum of five variable modifications per peptide. Protein inference was performed using the relaxed setting, and identifications were filtered at a q-value threshold of 0.01 (1% FDR). Quantification was enabled.
Extend of mistranslation
Only the W > F peptides identified in two out of two replicates (with Ln intensity > 9) and their respective WT matched peptides were selected for the analysis. The average intensity of the peptides that were found in both replicates was divided by the average intensity of the WT counterparts and plotted in log2. For the percentage of W > F substitutants, the median of the W > F/WT ratio was used.
Immunoprecipitation of HLA-peptides
Immunopeptidomics was conducted as described in ref. 13. In brief, cell pellets or tumour samples were lysed11,13,67 and the W6/32 antibody bound to protein-A sepharose 4B beads was used for immunoaffinity purification.
Immunopeptidomics mass spectrometry
HLA-eluted peptides were analysed on an Orbitrap Exploris 480 Mass spectrometer connected to an Evosep One LC system (Evosep Biotechnology). Before LC separation with the Evosep One, peptides were reconstituted in 0.1% formic acid and loaded on Evotip Pure (Evosep) tips. Peptides were then eluted/separated using the ‘Extended Method’ (88-min gradient) on an EV1137 (Evosep) column with nanospray, Easyspray ion source (Thermo Scientific) and EV1086 (Evosep) emitter. On the Exploris 480, data-dependent acquisition was performed at resolution 60,000 with MS1 mass range 350–1,700 m/z, normalized AGC target was set to 100% and maximum injection time of 50 ms. Dynamic exclusion was set to 10 s. and MS2 spectra were acquired at 15,000 resolution. The top ten precursors per cycle were HCD fragmented with charge states 2–4, and the top five precursors per cycle were HCD-fragmentated if singly charged. The MS2 isolation window was 1.1 m/z, normalized collision energy was 30, normalized AGC target was 50% and the maximum injection time was 100 ms.
Vulcano plot for differentially expressed peptides from immunopeptidomics
The Protti package of R was used68 with the standard parameters. MaxLFQ Intensity for each peptide was used for the quantification. The standard parameters of completeness MAR = 0.7 and completeness MNAR = 0.1 were used for assigning missing values. Data imputation was performed using the Ludovic method.
Generation of mutant database
The database used for peptide search was created similar to ref. 13. In brief, an amino acid window (±10 AAs) around all tryptophans (W) of proteins in the UniProt database UP000005640 was acquired. The W of interest in these peptides were converted to phenylalanine (F), and in the case of multiple Ws in the amino acid window, all the Ws were converted to F. These peptides were added to the UniProt database to generate the final database for peptide search.
Database search and filtering
The native non-specific-HLA workflow (with preset parameters; peptide mass tolerance: ±20 ppm, calibrate mass: True, digestion: non-specified, peptide length: 7–35, mass range: 200–5,000 Da, missed cleavage: 2, fragment max charge: 2, fixed modifications: [57.02146 cysteine alkylation], variable modifications: [15.9949 methionine oxidation, 42.0106 N-terminal acetylation, -17.026500 N-terminal glutamine (Q) or cysteine (C) cyclization, 0.984016 N-terminal phenylalanine amidation]) in Fragpipe39 v.20.0 was used to identify peptides from the acquired mass spectra. Peptides identified by Fragpipe were mapped back to the proteome to confirm truly substituted peptides from canonical peptides. Peptides between 8 and 12 amino acids were retained for downstream quality checks such as peptide length distribution.
Animal studies
The in vivo experiments were approved by the Netherlands Cancer Institute Animal Experimental Committee. Experiments were performed under the approval AVD30100202519090 and DEC NKI (OZP ID 12051). Mice were bred and maintained in accordance with institutional, national and European guidelines for Animal Care and Use. The WP 39.1.11952. A549MART1FTSJ1-KO clone and corresponding rescue, were mixed with Cultrex (R&D systems, lot 1698229) in a ratio of 1:1 and injected into the right mammary gland #4 at 1 × 10⁶ cells in 40 µl per NOD-SCID IL2R-null (The Jackson Laboratory) (NSG) mice, aged 6–8 weeks. The maximum permitted disease end points were not exceeded in any experiment. Animals were housed in a certified animal facility, providing 12-h light–dark cycles, regulated at 21 °C and 55% relative humidity. Mice were kept in individually ventilated cages, and food and water were provided ad libitum. Tumour size was monitored as described in ref. 13, by caliper measurement. When tumours on average reached a volume of 150–200 mm3, mice were randomly divided over groups receiving PBS or 10 × 106 DMF5 T cell injection via the tail vain, in a volume of 100 µl PBS. Starting from the day of T cell injection, mice daily received 100,000 units of IL-2 in 100 µl PBS per mouse for 3 consecutive days. Tumour material was collected 96 h after injection, snap frozen and stored at −80 °C. Processing of tumour material is conducted as described here in Methods for proteomics sample preparation.
Measurement of tGFP and H-2Kb-bound SIINFEKL
Cells were detached and incubated with APC anti-mouse H-2Kb-bound to SIINFEKL antibody (BioLegend, clone 25-D1.16; 1:200 in PBS/0.1% BSA), plus when needed Live/Dead Fixable near-IR dead cell stain kit (1:1,000 dilution, Invitrogen) for 30 min on ice. Cells were rinsed two times with PBS–BSA 0.1% and resuspended in 0.1% BSA–PBS, with DAPI (Invitrogen) when required. Analyses was performed on the Attune NxT (Thermo Fisher Scientific) using Attune NxT software v.4.2 and the data were analysed using FlowJo v.10 software (FlowJo).
OPP analysis
OPP analysis was conducted as in ref. 10. In brief, after treatment, cells were treated with CHX (0.1 mg ml−1) for 5 min where necessary, and then supplemented with 10 μM OPP (Life Technologies) for 60 min at 37 °C. Cells were detached and fixed overnight in 70% ethanol at 4 °C, permeabilized with 0.1% Triton X-100 (Sigma), and blocked with 3% BSA (Sigma) in PBS. Subsequently, the click-it reaction was performed using click-it reagents and picolyl azide AF488 (all from Thermo Fisher Scientific). The cells were analysed on the Attune NxT using software described above.
OT-1 T cell SIINFEKL recognition assays
OT-1 T cell SIINFEKL recognition assays were conducted as described in ref. 11 except that the co-cultured samples were then incubated for 4 h at 37 °C. Next, the cells were pelleted, blocked with PBS–BSA 0.1% and stained with Live/Dead Fixable near-IR dead cell stain kit (Invitrogen) and anti-mouse CD8-VioBlue antibodies (Miltenyi, 1:100 dilution). Afterwards, the cells were fixed and permeabilized (eBioscience Foxp3 Transcription Factor Staining Buffer Set (Invitrogen)). Cells were then stained with PE-conjugated anti-mouse TNF (Miltenyi, 1:100 dilution) and APC-conjugated anti-mouse IFNγ (Miltenyi 1:100 dilution). Cells were washed and analysed on a BD LSR Fortessa (BD Biosciences). Data were analysed using FlowJo v.10 software (FlowJo).
T cell activation
T cells were thawed and cultivated at a concentration of 1 × 10⁶ cells per ml in RPMI 1640 medium supplemented with 10% human serum (One Lambda). T cell activation was performed as in ref. 13. In brief, for the cells loaded with the TMBIM6W>F peptide (GenScript Biotech), the peptide was loaded 24 h before the ending of the treatment at a concentration of 1 μM. Then, 100,000 cancer cells were co-cultured in RPMI medium for 16 h in a 96-well U-shaped plate with 50,000 TCRTMBIM6W>F.1 T cells. Cells were incubated with TCRmβ-PE (Miltenyi, 1:100 dilution), CD8-VioBlue (Miltenyi, 1:200 dilution), CD137-APC (Miltenyi, 1:100 dilution) and with 1:1,000 Live/Dead Fixable near-IR dead cell stain kit (Invitrogen) in PBS–BSA 0.1% on ice in the dark for 30 min. Cells were washed twice with PBS–BSA 0.1%. Samples were analysed on a BD LSR Fortessa (BD Biosciences). Data were analysed using FlowJo v.10 software (FlowJo).
DNA extraction and TIDE analysis
DNA extraction and TIDE analysis were performed as in ref. 13. In brief, cells were lysed at 55 °C in a 500-μl solution of 100 mM Tris, pH 8.5 mM EDTA, 0.2% SDS and 200 mM NaCl containing 2 µl of proteinase K (20 mg ml−1 stock solution from Sigma) overnight. After centrifugation, DNA was pelleted adding isopropanol. Then, PCR was performed using Phusion Polymerase (Thermo Fisher) following the manufacturer’s instruction. Primers used for amplifying the target genes are listed in Supplementary Table 9. Cells expressing a control sgRNA (sgNT1) were always used as reference. The PCR product was purified from agarose gel (QIAGEN) and sent for Sanger sequencing (Macrogen). The analysis was conducted via tide.nki.nl ref. 28.
RNA-sequencing
Cells were collected in RLT buffer and snap frozen in liquid nitrogen. Total RNA was isolated using the RNeasy Mini kit (QIAGEN), including an on-column DNase digestion (QIAGEN), according to the manufacturer’s instructions. The quality and quantity of the total RNA were assessed by the 2100 Bioanalyzer using ‘Agilent RNA 6000 Nano’ (G2938-90034, Agilent Technologies). Total RNA samples having an RNA integrity number > 8 were subjected to library generation using the TruSeq stranded mRNA library preparation kit, according to the manufacturer’s instructions (document #1,000000040498 v.00, Illumina) with incorporation of xGen UDI-UMI adaptors (Integrated DNA Technologies). The stranded mRNA libraries were analysed on a 2100 Bioanalyzer instrument following the manufacturer’s protocol ‘Agilent DNA 7500 kit’ (Agilent Technologies), diluted to 10 nM, and pooled equimolar into multiplex sequencing pools for paired-end sequencing on the NovaSeq 6000 Illumina sequencing instrument. Paired-end sequencing was performed using 54 cycles for read 1, 19 cycles for read i7, 10 cycles for read i5, and 54 cycles for read 2, using the NovaSeq6000 Reagent kit v.1.5 (100 cycles) (Illumina). The fastq files of mRNA-seq data were aligned to the reference genome (GRCh37/hg19) using the STAR alignment tool69. Transcript abundances were quantified with Salmon70, and count data were variance-stabilized using the variance stabilizing transformation implemented in DESeq2.
A-to-I editing enrichment calculation
The tool JACUSA2 (ref. 30) was used to detect site-specific editing events in RNA-seq data (CPTAC). The fastq files of mRNA-seq data were aligned to the reference genome (GRCh37/hg19) using the STAR69 alignment tool and then sorted and indexed using SAMtools. The call-2 feature of JACUSA2 was used to compares two different conditions. Each condition was first compared with the reference, and then with each other. To increase confidence in the output, several filtering steps were implemented, where each site must have a minimum of 15 reads covering that base in both the samples and the JACUSA2 score must be at least 2. Additionally, only the sites where there was an enrichment of ≥10% RNA editing in one condition versus the other were considered. The output was the sites at which an enrichment in RNA editing had been observed in one condition when compared with another.
tRNA-seq
Total RNA was isolated using TRIzol reagent (Invitrogen), according to manufacturer’s instructions. Nano-tRNA-seq sample preparation, tRNA quality control, library preparation and Nanopore sequencing were conducted by IMMAGINA Biotechnology in Italy. Bioinformatics analysis was performed according to ref. 37. Alignment of sequences causes the experimental tRNA numbering to be in a + 1 position compared with the canonical numbering.
rhWARS1 production
The rhWARS1 was produced as described in ref. 11. In brief, cells were grown at 37 °C until OD600 of 0.7. Next, protein expression was induced by addition of 0.4 mM IPTG and the cells were grown overnight at 18 °C. After lysis, the recombinant rhWARS1 protein was purified using nickel beads, after which the protein was reconstituted in 25 mM Tris, pH 8.0, 200 mM NaCl and 1 mM TCEP.
WARS1 aminoacylation
Total RNA was isolated using TRIzol reagent (Invitrogen), according to manufacturer’s instructions. Next the small RNA fraction was isolated using the RNA clean & concentrator kit (Zymo), according to their protocol. The resulting RNA fraction was deacylated by adding one volume of 1 M Tris-HCl at pH 9 and incubated for 3 h at room temperature. RNA was precipitated by adding one volume of 20% potassium acetate at pH 4.5 and 2.5 volumes of cold ethanol. RNA was pelleted and dissolved in H2O. tRNA was aminoacylated by incubating 10 OD ml−1 RNA with 2 μM WARS1, 3 mM ATP and 10 μM [3H]Trp (American Radiochemcals) or [14C]Phe (Revvity) in buffer: 50 mM HEPES, pH 7.5, 30 mM NH4Cl, 70 mM KCl, 20 mM MgCl2 and 2 mM dithiothreitol for 30 min at 37 °C. AA-tRNA was precipitated with trifluoroacetic acid on ice for 45 min, followed by filtration through nitrocellulose filters (Sartorius). A control with amino acids but no RNA was included. Filters were dissolved in 1 ml Soluene-350 (Revvity) by shaking for 10 min. For radioactivity counting, 10 ml Ultima Gold XR (Revvity) was added and disintegrations per minute were measured in a Liquid Scintillation counter. tRNA charging was calculated as pmol of amino acids using the specific activity of 3H and 14C. Values obtained with the control without tRNA were subtracted.
WARS1 binding affinity
The binding affinity of WARS1 protein was determined using Microscale Thermophoresis (MST). rhWARS1 was first labelled with Dy547P1 dye (Dyomics). A fixed concentration of labelled WARS1 (20 nM) was mixed with a series of increasing concentrations (twofold dilution steps) of either amino acids or RNA (in the presence of 10 mM amino acid) in buffer containing 100 mM Tris pH 8, 10 mM MgCL2, 40 mM KCl, 1 mM TCEP, 3 mM ATP and 0.05% Tween20 in MiliQ. Deacetylated small RNA fraction samples were prepared as described for the WARS1 aminoacylation experiment.
Measurements were performed on a Monolith NT.115 instrument (NanoTemper Technologies). Data were exported to GraphPad Prism (GraphPad Software) and fitted using a one-site binding model. From amino acid titrations, the dissociation constant (KD) was calculated, whereas from mRNA titrations the BC50 (the RNA concentration at which 50% of rhWARS1 is bound) was calculated. Differences in KD or BC50 values were assessed for statistical significance during fitting using Akaike’s Information Criterion. For representation, data were normalized using the fitted background and maximum binding (Bmax) values.
Metabolomics
Cell pellets were reconstituted in 50 μl of internal standard mix (10 μM l-Trp-d5 and 1 μM l-Kyn-d4 in water) by sonication for 10 min. Next, the samples were mixed with 30 μl of trifluoroacetic acid. After centrifugation, the samples were diluted tenfold in water and 20 μl was subjected to LC–MS/MS consisting of an UltiMate 3000 Autosampler and HPLC pump (Thermo Scientific) and API4000 MS/MS (Sciex). Calibration was carried out using a set of aqueous standards. Separation was performed on a Symmetry C18 column (2.1 × 150 mm, particle size 3.5 µM, Waters). Mobile phase A (0.1% formic acid in water) and B (methanol) were used in a 5 min gradient from 20 to 95% B, maintained for 3 min followed by re-equilibration at 20% B. Multiple reaction monitoring for acquisition were l-Trp (205.1/187.9 and 205.1/146.3), l-Kyn (209.3/192.1 and 209.3/146.1), l-Trp-d5 (210.3/192.0 and 210.0/192.0) and l-Kyn-d4 (213.2/196.1 and 213.2/150.2).
FTSJ1 enrichment calculation
The gene expression datasets were obtained from the CPTAC. For each tumour type, the expression levels of FTSJ1 were extracted and categorized into two groups: tumour-adjacent tissues and tumour tissues, based on patient indices. The normalized intensity values were derived from the tandem mass tag proteomics dataset.
Statistics and reproducibility
The data in all figures represent independent cultures, as described. Flow cytometry gating strategies are depicted in Supplementary Figs. 8 and 9. Statistical analysis was performed as indicated in the figure legends. Exact P values are listed in Source Data. Data with sample size <5 were assumed normally distributed, but this was not formally tested. Data with larger sample sizes were tested for normality using the D’Agostino and Peason’s test. Sample size for in vivo experiments was chosen based on observed effect sizes and s.e. from in vitro experiments. Randomization was performed per donor and on tumour size. Tumours were measured by a blinded operator. No data were excluded from the analysis.
Reporting summary
Further information on research design is available in the Nature Portfolio Reporting Summary linked to this article.
