


Molecular subtyping of pancreatic ductal adenocarcinoma (PDAC) into basal-like and classical states is a critical prognostic determinant, yet clinical implementation remains limited by the cost and turnaround time of transcriptomic sequencing.1,2,3 Although routine histopathology captures rich morphological features, deep learning models often lack a principled connection to gene-level molecular structure.4,5 We propose a graph-constrained histology model that maps morphology-derived latent features onto a fixed, data-driven gene co-expression network for pancreatic cancer molecular subtype prediction. The gene-structured outputs are interpreted as latent features constrained by gene co-expression structure, rather than as direct estimates of patient-level gene expression or empirically recovered gene-network alignment.
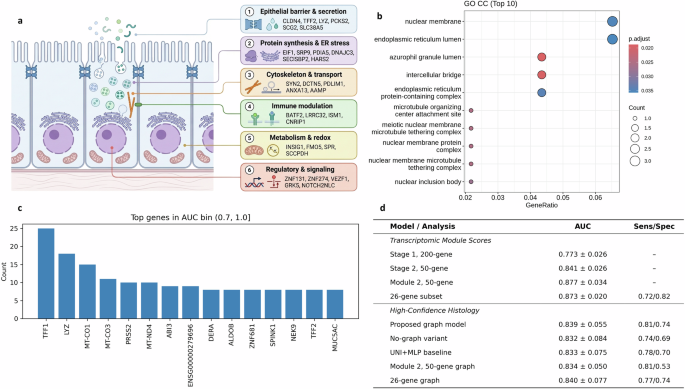
Our model uses a multi-stage gene sampling workflow designed to identify biologically informative genes from transcriptomic data for gene discovery. Using bulk RNA-seq data from 797 patients across TCGA-PAAD and PANCAN cohorts, we established molecular ground truths via single-sample gene enrichment analysis (ssGSEA). A hierarchical Monte Carlo screening process evaluated candidate genes to derive 50-gene modules with high predictive potential. In five-fold cross-validation, the Stage 2 screening of 200-gene modules achieved a mean test AUC of 0.773 ± 0.026. The final selected module contained predominantly protein-coding genes, with a smaller number of non-coding transcripts including snoRNAs and long non-coding RNAs shown in Fig. 1a. Gene Ontology analysis and functional enrichment analysis are shown in Fig. 1b for the derived 50 gene module for the first run. The subsequent Stage 3 optimization of the 50-gene module achieved a mean test AUC of 0.841 ± 0.026, indicating improved predictive performance after focused gene selection. The top genes for all Montecarlo runs for the highest performing gene modules are shown in Fig. 1c. We repeated the Monte Carlo screening using PurIST genes, Moffitt subtype genes, and pancreatic cancer-associated genes as the candidate pool. The optimized Stage 2 50-gene modules were selected in all five folds and improved mean test AUROC from 0.802 ± 0.032 in Stage 2 to 0.877 ± 0.034 after Stage 3 optimization, supporting the screening procedure as a consistent method for identifying compact subtype-predictive gene modules.
Fig. 1
Gene-network-constrained histology for pancreatic cancer molecular subtyping. a Functional categorization of the 50-gene secretory epithelial barrier program (Created in BioRender. Leyva, A. (2026) https://BioRender.com/o98ijb8)b Gene Ontology (GO) Cellular Component enrichment analysis. c Gene recurrence frequency among high-performing modules (AUC > 0.7). d Consolidated performance comparison separating transcriptomic module scores from high-confidence histology models. Transcriptomic rows report gene-module subtype performance, whereas histology rows report graph-constrained or baseline image-model performance. Data are represented as mean ± SD
To bridge the gap between morphology and molecular representation, we integrated a graph Laplacian regularizer into a deep learning-based image classifier. The Laplacian was computed from the rank-transformed Spearman correlation matrix between selected genes, followed by construction of the weighted adjacency matrix, degree matrix, and graph Laplacian. Post hoc comparison between the morphology-derived gene-latent covariance structure and the reference gene co-expression graph was performed using edge-weight versus latent-similarity Spearman correlation, Mantel-style gene-label permutation testing, graph smoothness analysis, and top-edge enrichment analysis. These analyses did not demonstrate direct reconstruction or rankwise recovery of the reference gene-network topology. This Laplacian captures covariation within the gene co-expression network and enforces smoothness across predicted gene latent representation vectors. In high-confidence test samples (n = 176; 96 basal-like and 80 classical), the proposed graph-constrained model achieved a sample-level AUROC of 0.817, accuracy of 0.778, sensitivity of 0.813, specificity of 0.738, and balanced accuracy of 0.775. Across folds, the model achieved a mean test AUROC of 0.839 ± 0.055, with mean sensitivity of 0.809 ± 0.134 and specificity of 0.739 ± 0.139. A compact 26-gene ablation achieved high-confidence test AUROC of 0.840 ± 0.077, sensitivity of 0.767 ± 0.122, and specificity of 0.741 ± 0.166, preserving performance comparable to the original graph-constrained model. The expanded 50-gene Moffitt-derived graph module achieved high-confidence histology test AUROC of 0.834 ± 0.050, sensitivity of 0.805 ± 0.151, and specificity of 0.530 ± 0.348 across folds, indicating that expansion of the transcriptomically selected module did not improve downstream histology transfer. We then evaluated a compact 26-gene subset of this 50-gene module. In transcriptomic space, the 26-gene subset achieved test AUROC of 0.873 ± 0.020, sensitivity of 0.719 ± 0.043, specificity of 0.823 ± 0.057, balanced accuracy of 0.771 ± 0.038, and accuracy of 0.766 ± 0.039. When used as the graph constraint in the histology model, the same 26-gene subset achieved high-confidence test AUROC of 0.840 ± 0.077, sensitivity of 0.767 ± 0.122, and specificity of 0.741 ± 0.166. In paired high-confidence sample-level analysis (n = 176; 96 basal-like and 80 classical), the original graph-constrained model achieved AUROC of 0.817, accuracy of 0.778, sensitivity of 0.813, specificity of 0.738, and balanced accuracy of 0.775. The expanded 50-gene module achieved lower performance, with AUROC of 0.784, accuracy of 0.682, sensitivity of 0.813, specificity of 0.525, and balanced accuracy of 0.669. In contrast, the compact 26-gene ablation achieved AUROC of 0.823, accuracy of 0.756, sensitivity of 0.771, specificity of 0.738, and balanced accuracy of 0.754. The performances for all modules and experiments is shown in Fig. 1d.
DeLong testing showed a significant overall difference in AUROC across the three models (omnibus p = 0.040). The compact 26-gene ablation significantly outperformed the expanded second 50-gene module in AUROC (∆ = 0.040, Holm-adjusted p = 0.035), whereas the 26-gene ablation did not differ significantly from the original graph-constrained model (p = 0.528). Cochran’s Q testing showed significant differences in thresholded accuracy (p = 0.0027) and specificity (p < 0.001), but not sensitivity (p = 0.449), indicating that the expanded module primarily degraded performance by reducing specificity.
These ablations suggest that histology transfer is not improved simply by expanding a transcriptomically strong gene module. Instead, compact Moffitt-derived substructures may better preserve the molecular signal that is recoverable from morphology.
Ablation studies were conducted to assess the contribution of the graph Laplacian constraint. A standard UNI + MLP baseline achieved a mean test AUROC of 0.833 ± 0.075 (Sens: 0.777 ± 0.148; Spec: 0.702 ± 0.180). The experiment without graph loss yielded a mean test AUROC of 0.832 ± 0.084 (Sens: 0.736 ± 0.100; Spec: 0.692 ± 0.146). In paired sample-level analysis, AUROC did not differ significantly across the graph-constrained model, no-graph ablation, and UNI + MLP baseline by DeLong testing (omnibus p = 0.987; all pairwise Holm-adjusted p = 1.000). However, thresholded classification performance differed across models by Cochran’s Q testing for accuracy (p = 0.007) and sensitivity (p = 0.035), but not specificity (p = 0.197). Compared with the no-graph ablation, the graph-constrained model significantly improved accuracy by 0.063 (95% CI: 0.017–0.108, pHolm = 0.016) and balanced accuracy by 0.061 (95% CI: 0.019–0.107, pHolm = 0.012) by paired bootstrap analysis. McNemar testing similarly showed higher accuracy for the graph-constrained model relative to the no-graph ablation (pHolm = 0.038). These results support a threshold-dependent performance benefit associated with graph regularization in the high-confidence cohort, rather than a significant improvement in AUROC-based ranking performance.
Performance degradation was observed in the low-confidence cohort, where the graph-constrained model achieved a mean test AUROC of 0.621 ± 0.080 across folds and a sample-level AUROC of 0.583 in paired analysis (n = 361; 115 basal-like and 246 classical). AUROC did not differ significantly across models in this cohort by DeLong testing (omnibus p = 0.575). Thresholded predictions differed significantly across models by Cochran’s Q testing for accuracy, sensitivity, and specificity (all p < 0.001). Compared with the no-graph ablation, the graph-constrained model showed higher sensitivity (∆ = 0.261, 95% CI: 0.183–0.348, pHolm < 0.001), but lower specificity (∆ = −0.240, 95% CI: −0.297 to −0.187, pHolm < 0.001) and lower accuracy (∆ = −0.080, 95% CI: −0.127 to −0.036, pHolm = 0.002), with no significant balanced accuracy difference. In low-confidence cases, the expanded 50-gene module achieved AUROC 0.629 ± 0.066, sensitivity 0.374 ± 0.380, and specificity 0.726 ± 0.416, while the compact 26-gene ablation achieved AUROC 0.643 ± 0.039, sensitivity 0.193 ± 0.183, and specificity 0.920 ± 0.089, indicating that compact gene constraints modestly improved AUROC and specificity but remained threshold-dependent with reduced sensitivity. In low-confidence cases, the original graph, expanded 50-gene module, and compact 26-gene module achieved sample level AUROCs of 0.583, 0.591, and 0.611, respectively, with no significant AUROC difference by DeLong testing (omnibus p = 0.628; all pairwise Holm-adjusted p = 1.000), while Cochran’s Q testing showed significant thresholded differences in accuracy (p = 0.002), sensitivity (p < 0.001), and specificity (p < 0.001), driven by the compact 26-gene module’s higher specificity (0.919) but lower sensitivity (0.183). Distribution analysis of ssGSEA scores indicates that these samples cluster near the −1/ + 1 decision threshold, consistent with transcriptomic ambiguity or mixed tumor phenotypes. Qualitative review revealed that low-confidence slides often exhibit heterogeneous tumor phenotypes and mixed mucosal barriers despite maintained epithelial differentiation, suggesting that morphology reflects dominant molecular programs most clearly when transcriptomic signals are strong. The primary methodological novelty lies in the hierarchical Monte Carlo gene-module screening procedure, which derives compact predictive co-expression modules from transcriptomic data and uses them to define a gene-indexed graph constraint for histology-based PDAC subtype prediction. The results show that gene structure can improve threshold-dependent accuracy and balanced accuracy when transcriptomic subtype signal is strong, while low-confidence transcriptomic signal shifts the graph-based model toward higher sensitivity at the cost of lower specificity and accuracy. This provides a means to identify alternative gene modules that carry subtype-relevant information beyond the original subtype-defining genes, and to test whether those modules encode histologically detectable molecular signal.
The derived 46-gene set includes markers involved in epithelial barrier function (TFF2), protein synthesis (ETF1), and immune modulation (BATF2), providing a multifaceted view of PDAC biology. Although the initial candidate module consisted of 50 genes, greedy modularity community detection identified a dominant co-expression community containing 46 genes. Genes outside this community were excluded prior to graph construction to ensure that the Laplacian regularizer operated on a single coherent gene interaction network rather than disconnected or weakly connected components. The graph-constrained gene module exhibited minimal overlap with the original Moffitt subtype signatures, sharing only one gene (TFF2) of the 50 genes used for ground-truth definition, indicating that the selected module represents an independent, yet predictive, co-expression signature rather than a direct recapitulation of the original subtype markers.
The second 50-gene module showed substantially greater overlap with the Classical signature than with the Basal signature, sharing 11 of 25 Classical genes (44.0%; 22.0% of the selected module) but only 1 of 25 Basal genes (4.0%; 2.0% of the selected module). Across the combined Classical and Basal reference signatures, 12 of 50 selected genes overlapped with subtype-associated markers (24.0% of the selected module). Gene ontology enrichment confirmed that high-performing modules frequently involve mRNA catabolism and translational elongation.
In summary, this study shows that routine histology can recover clinically relevant transcriptomic subtype structure when guided by biologically grounded gene constraints, and that gene-module choice distinguishes molecular signals that are transcriptionally strong from those that are also morphologically detectable. By identifying gene structures that transfer from RNA space to H&E morphology, this approach provides a practical route toward lower-cost molecular stratification of PDAC in settings where transcriptomic profiling is not routinely available.
