


CAR T cells can persist for up to a decade in patients treated for B-NHLs
We analyzed CAR T cell persistence in longitudinal clinical samples from 38 patients with B-NHL treated with CART19 in the single-center trial NCT02030834 (refs. 1,5,15). Baseline patient characteristics have been reported previously. Briefly, 24 patients had large B cell lymphomas (LBCLs); 14 had follicular lymphoma (FL). Patients received 1.0–5.0 × 10⁸ CAR T cells after lymphodepleting chemotherapy. Lymphodepletion included cyclophosphamide-based (Cy-based) regimens in 21 patients, bendamustine in 16 patients and carboplatin-gemcitabine in one patient. In R/R LBCL, the best overall response (BOR) rate was 58% (14 of 24 patients), with 11 of 24 patients (46%) achieving a complete response (CR); in R/R FL, the BOR was 79% (11 of 14) and the CR was 71% (10 of 14). Any-grade cytokine release syndrome (CRS) and immune effector cell-associated neurotoxicity syndrome (ICANS) occurred in 58% and 11% of patients, respectively1,5. Long-term follow-up (10.1 years, range, 7.9–11.5) showed no relapses beyond 5.4 years. Further, the 10-year lymphoma-free survival was 32% (95% confidence interval (CI), 14–51) for LBCL and 47% (95% CI, 20–71) for follicular lymphoma15.
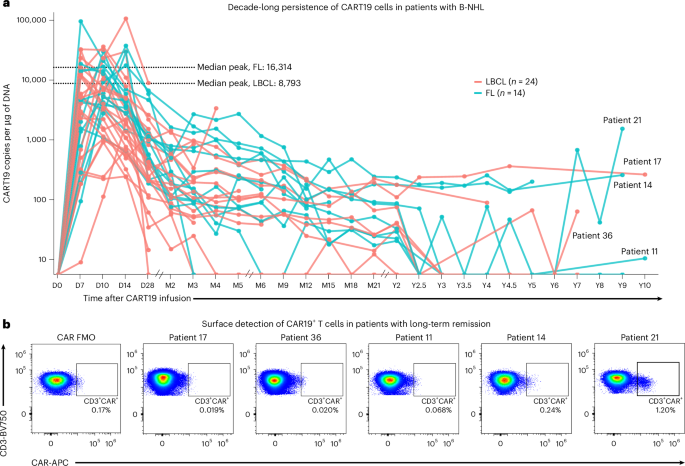
Peak CART19 expansion occurred on day 7 in 18 patients (47.3%), on day 10 in 13 (34.2%) and on day 14 in seven (18.5%). The timing of peak expansion was similar between LBCL and FL, with most patients peaking at day 7 (50% versus 43%), followed by day 10 (33% versus 36%) and day 14 (17% versus 21%) (P = 0.91). The median peak transgene level was 11,096 CAR T copies per µg of DNA (interquartile range (IQR) 3,358–22,899). In LBCL (n = 24), the median peak was 8,793 copies per µg of DNA (IQR = 2,247–18,502), compared with 16,314 in FL (n = 14, IQR = 4,880–27,691; P = 0.26) (Fig. 1a). Transgene copies declined over time, with median levels of 141 copies per µg of DNA (n = 31, IQR = 88–501) at month 3, 126 (n = 23, IQR = 48–365) at month 6, 82 (n = 19, IQR = 45–168) at year 1 and 41 (n = 16, IQR = 28–93) at year 2.
Fig. 1: Decade-long CART19 cell persistence in patients with NHL.
a, CART19 transgene copies over time, as measured using quantitative PCR (qPCR). The pale red lines indicate patients treated for LBCL; the light blue lines indicate patients treated for FL. The detection limit for samples collected between 2.5 and 7 years after infusion was 50 copies per µg of DNA, while the long-term persistence detection limit was five copies per µg of DNA. The dashed lines indicate the median peak value based on the disease. b, Flow cytometry detection of CAR T cells in patients with positive qPCR for the CAR transgene. Gating was performed using a fluorescence minus one control for the CAR antibody. Patient 21 was the only case showing a clearly distinguishable CAR+ population. LBCL, large B cell lymphomas; FL, follicular lymphoma; APC, allophycocyanin; BV, Brilliant Violet; D, day; M, month; Y, year.
We next evaluated very long-term persistence. Beyond year five, 12 patients remained in remission and were defined long-term responders15. Samples suitable for CART19 persistence testing were available in eight of these patients. In five of eight patients (62.5%) (three FL and two LBCL), CAR T cells were still detectable using qPCR, with a median of 262 copies per µg of DNA (range, 10–1,567 copies per µg of DNA; Fig. 1a and Extended Data Table 1). We first asked whether molecular persistence corresponded to phenotypically detectable CAR T cells using multiparameter cytometry at the same or closest time point. CAR T cells were clearly detectable using flow cytometry only in patient 21 (1,567 copies per µg of DNA at the matched time point), where they comprised 1.2% of total CD3+ lymphocytes (Fig. 1b). All three patients with more than 200 transgene copies per µg of DNA had complete and sustained B cell aplasia, whereas the two patients with lower-level persistence showed B cell reconstitution (Extended Data Table 1). We then evaluated whether the type of lymphodepletion (Cy versus Benda-based) influenced CAR T cell expansion or long-term persistence and found no association (Supplementary Tables 1 and 2 and Extended Data Fig. 1a). Similarly, post-infusion serum cytokine levels did not differ according to lymphodepletion regimen (Extended Data Fig. 1b,c and Supplementary Table 3). Baseline B cell counts and phenotypic characteristics of the CAR T cell products were not associated with long-term outcomes, probably reflecting the limited sample size (Supplementary Figs. 1–3 and Supplementary Table 4).
Together, these data show that CD19-directed CAR T cells can remain functionally active for up to a decade in B-NHL, maintaining durable B cell aplasia in a subset of long-term responders.
Long-term persistence in patient 21 is associated with sustained B cell aplasia and recurrent infections
To define the phenotype of persisting CAR T cells, we focused on peripheral blood CAR T cells from patient 21 at year 9.3. Patient 21 is a 68-year-old woman with R/R FL who relapsed after six lines of therapy. At enrollment, she had stage IV disease with bone marrow (<5% infiltration) and cutaneous involvement, without bulky disease. She received intravenous cyclophosphamide (300 mg m−2 daily for 4 days) as bridging therapy because of ongoing disease progression, followed by lymphodepleting chemotherapy with cyclophosphamide (300 mg m−2 daily for 4 days). At infusion, lactate dehydrogenase (LDH) was within normal limits. After CART19 infusion, the patient had no CRS or ICANS but experienced persisting long-term neutropenia likely related to concurrent clonal hematopoiesis (TET2 and DNMT3A mutations; Supplementary Fig. 4). She achieved a CR at month 1 and remains in remission after 10.1 years.
CAR transgene levels peaked on day 14 (18,062 copies per µg of DNA) and declined through year 2, thereafter persisting at low levels (72–77 copies per µg of DNA) before falling below the limit of detection at year 4.5 (Fig. 2a). Notably, long-term persistence was characterized by two late expansion flares: one at year 7 (689 copies per µg of DNA) and another at year 9.3 (1,567 copies per µg of DNA), when CAR T cells represented 1.2% of total CD3+ T cells using flow cytometry. No infectious events or vaccinations could be clearly linked with the first flare, but at the time of the second expansion, the patient had a nasal swab positive for rhinovirus/enterovirus. CAR T cells remained functionally active after infusion, as evidenced by sustained B cell aplasia and profound hypogammaglobulinemia requiring monthly intravenous immunoglobulin (IVIG) replacement. Despite IVIG, the patient experienced recurrent infections, including persistent bronchiolitis beginning in year 9 and ongoing at last follow-up (year 10.1; Fig. 2a).
Fig. 2: Patient 21 CAR+ T cells have a dominant DN effector phenotype.
a, Schematic of the analysis performed on PBMCs from patient 21. The peak time point was identified on day 14. Long-term CAR T persistence was characterized by two distinct expansion flares, the latest occurring at year 9.3. b, Contour plots showing the percentage of CD4+, CD8+ and DN (CD4−CD8−) T cells within the CAR− and CAR+ compartments. c, t-distributed stochastic neighbor embedding (t-SNE)-based unbiased T cell clustering derived from surface protein expression detected using multiparameter flow cytometry. CAR expression was not included as a parameter for clustering. Mapping of CAR T cells onto the identified T cell clusters shows that CAR T cells are located predominantly within a single dominant cluster. d, Heatmap of normalized expression (normalized mean fluorescence intensity) of selected T cell markers across clusters. The dominant CAR+ cluster is highlighted by the black box. e, Dot plots color-coded by t-SNE-defined clusters for CAR− T cells (left) and CAR+ T cells (right), annotated according to memory phenotype: naive (CD45RA+CCR7+), central memory (TCM; CD45RA−CCR7+), effector memory (TEM; CD45RA−CCR7−), and T effector memory re-expressing CD45RA (TEMRA) (CD45RA+CCR7−). While CAR− T cells are distributed across all four quadrants, CAR+ T cells are predominantly TEM, with the dominant CAR T cluster comprising nearly the entirety of the TEM compartment. f, Radar plot representing the percentage of cells expressing the visualized markers, comparing the dominant CAR T cluster with the bulk of the CAR− T cells. g, Percentage of CD4+(green), CD8+(blue), double positive (DP) (CD4+CD8+, orange) and DN (CD4−CD8−, purple) CAR− and CAR+ T cells of patient 21 from month 3 to month 21. BUV, Brilliant Ultraviolet; SCM, stem cell memory T cell.
Source data
Long-term CAR T cells have a double CD4 and CD8 negative activated effector-memory-like phenotype
Phenotypic analysis of patient 21 revealed that long-term-persisting CAR+ T cells were enriched for DN (CD4−CD8−) T cells (71.6% versus 38.5%) compared with CAR− T cells; CD8+ T cells were reduced (3.2% versus 23.4%), whereas CD4+ (23.8% versus 36.1%) and DP (CD4+CD8+) T cells (0.01% versus 0.41%) were similar (Fig. 2b). Unbiased clustering (excluding CAR as a feature) identified 15 T cell clusters. Notably, 86% of CAR+ T cells were compactly localized to a single dominant cluster (Fig. 2c). This cluster exhibited a DN (CD4−CD8−) and effector-memory-like phenotype (CD45RA−CCR7−CD95+). Only 0.28% of CAR− T cells shared this phenotypic profile, highlighting the unique features of long-term-persisting CAR T cells. Compared with the CAR− T cell compartment, this dominant CAR+ cluster demonstrated higher proliferation (Ki-67), activation (HLA-DR) and co-stimulatory receptor expression (CD27, CD28), together with increased immune checkpoint expression (PD-1, TIM-3, CTLA-4). Conversely, granzyme B (GZMB) expression was lower than in CAR− T cells, indicating a distinct cytotoxic program in long-term persisting CAR T cells (Fig. 2c–f and Extended Data Fig. 2a,b). We next asked whether the DN CAR T cells observed at year 9.3 in patient 21 were already present at the peak of expansion (day +14; CAR transgene copies, 18,062 per µg of DNA). At the peak time point, most CAR+ cells were CD8+ CAR T cells (71.5% of total CART19; Extended Data Fig. 2c), which is consistent with expected CAR T kinetics24. The proportion of CAR+ DN T cells at peak was not associated with clinical response (Supplementary Fig. 5).
We then explored the dynamics of DN CAR T cells over time in patient 21 by analyzing flow cytometry longitudinally from month 3 through month 24. The frequency of CAR+ T cells declined from 0.76% of total T cells on month 3 to 0.04% on month 21, falling below the limit of reliable flow cytometry detection by month 24 (Extended Data Fig. 2d). Within the CAR+ compartment, the DN fraction increased from 13.4% on month 3 to 33.9% on month 21, whereas CD8+ CAR T cells decreased reciprocally, suggesting progressive DN enrichment over time. In contrast, DN T cells within the CAR− compartment remained stable at 1–5%, indicating selective expansion of DN CAR T cells during long-term follow-up (Fig. 2g and Extended Data Fig. 2e).
Together, these data highlight the long-term emergence and persistence of DN proliferating functionally active CAR T cells that sustain ongoing remission in patient 21.
Long-term persisting CAR T cell transcriptional analysis reveals enhanced activation and aerobic metabolism
To define the characteristics and functionality of long-lived CAR T cells, we performed single-cell RNA sequencing (scRNA-seq) with paired T cell receptor (TCR) repertoire analysis on peripheral blood mononuclear cells (PBMCs) sorted to enrich for CAR+ T cells from patient 21, collected 9.3 years after infusion. This approach yielded 7,267 monocytes, 18,344 CAR− T cells, 836 natural killer (NK) cells and 1,543 CAR+ T cells (Extended Data Fig. 3a,b and Supplementary Figs. 6 and 7). Consistent with the flow cytometry results, most CAR+ T cells were DN (Fig. 3a). More than half of the CAR+ population exhibited an activated, interferon-driven transcriptional program (CD27, CD69, IRF1, IFI6, TIGIT, LAG3) and active proliferation (MKI67, PCNA), suggesting ongoing long-term activation (Fig. 3a and Supplementary Figs. 8 and 9). We also observed robust expression of cytotoxicity genes (GZMK, PRF1, NKG7), further confirming the maintenance of a functional cytotoxic program within the CAR+ compartment (Supplementary Figs. 8 and 9). Finally, to determine whether the enrichment of DN cells reflected a predominance of γδ CAR T, we analyzed TCR gene expression and found that most CAR T cells exhibited a conventional αβ TCR profile, whereas only a small subset (8%) expressed TRD (TRDV, TRDC) and TRG (TRGC1, TRGC2 and TRGV9) genes (Fig. 3a).
Fig. 3: Long-term CAR T cell transcriptional profile.
a, Uniform manifold approximation and projection (UMAP) of year 9.3 CAR T cells color-coded according to cell-cycle phase. Cell-cycle phase was calculated in the CAR T cell-only object. Feature plots show CAR, CD4, CD8 and TCR genes. b, Reactome pathway enrichment analysis comparing CAR− versus CAR+ T cells in G1 phase. Cell-cycle phase was assigned in the combined lymphocyte population. The top 25 pathways are shown. c, Differential gene expression analysis of CAR− versus CAR+ T cells in the G1 phase. Cell-cycle phase was assigned in the combined lymphocyte population. Blue dots mean higher in CAR−, while red dots mean higher in CAR+. Differential expression analysis was performed using a two-sided Wilcoxon rank-sum test with Bonferroni correction for multiple testing. d, Peak time point and year 9.3 integrated CAR T UMAP color-coded according to sample of origin (red, peak time point; light blue, year 9.3). e,f, Unbiased clusters of the integrated year 9.3 and peak CAR T (e) and relative proportion distribution within each sample; bar plots are color-coded according to the UMAP color cluster. Cytotoxic CD8+ CAR T cells are predominant at the peak time point (f). g, Differential gene expression analysis of CAR T cells in G1 phase year 9.3 versus peak. Blue dots mean higher in peak, while red dots mean higher in year 9.3. Differential expression analysis was performed using a two-sided Wilcoxon rank-sum test with Bonferroni correction for multiple testing. h, Comparison of the ‘late’ CAR T signature score, based on the normalized z-score expression between the CAR T at the peak and the year 9.3 time point (P = 6.70 × 10−291). i, Comparison of the ‘late’ CAR T signature score, based on the normalized z-score expression between the CAR+ T at year 9.3 and CAR− T cells at the same time points (P < 1 × 10−291). The P value for the score was calculated using a two-sided Wilcoxon rank-sum test adjusted for multiple comparisons. Significance was set at P < 0.05.
Source data
To determine whether the activation and proliferation transcriptional programs were specific to CAR+ T cells, we compared cell-cycle status between CAR+ and CAR− T cells in the lymphocyte population (Extended Data Fig. 3b and Supplementary Fig. 10a); whereas 66% of CAR+ cells were in G2/M or S phase, only 35% of CAR− T cells were proliferating, highlighting sustained CAR−-specific proliferation (Supplementary Fig. 10b). We next examined CAR+ versus CAR− T cells within the G1 phase. Unbiased pathway enrichment analysis identified that CAR+ T cells were enriched for aerobic metabolism and immune cell activation transcriptional programs (Fig. 3b). Differential gene expression analysis identified that CAR+ T cells showed higher expression of mitochondrial metabolism (MRPL16, MRPL28) and activation/exhaustion gene (HLA-DR, CD38, PDCD1, LAG3, HAVCR2) and produced the regulatory cytokine IL-10 (Fig. 3c, Supplementary Table 5 and Supplementary Fig. 11). Finally, regulon analysis revealed enrichment of transcriptional programs associated with T cell exhaustion (PRDM1), activation (STAT1, TAF7and IRF1) and memory persistence (JUN and FOS) within the CAR+ T cell compartment. In contrast, CAR− T cells were enriched for the ZEB2 regulon, a transcriptional program associated with effector CD8+ T cell responses to infections, which is consistent with the patient’s clinical history (Extended Data Fig. 4 and Supplementary Table 6)25.
We next investigated whether the transcriptional features of the long-term-persisting DN CAR+ T cells were already detectable at the peak of expansion. To test this, we integrated 3,179 CAR+ T cells collected at the expansion peak with those identified at the long-term follow-up (Fig. 3d–g and Supplementary Figs. 12 and 13). Notably, year 9.3 CAR+ T cells localized to a UMAP region highly enriched for proliferating and DN CAR+ T cells, whereas peak CAR+ T cells predominantly mapped to a CD8+ cytotoxic cluster characterized by high expression of GZMB and GZMH (Fig. 3d–g and Supplementary Figs. 12 and 13), indicating a drastically different transcriptional profile. Unbiased pathway enrichment analysis identified interferon signaling as the top enriched pathway in long-term CAR+ T cells (Supplementary Figs. 14). Consistently, differential expression analysis revealed a marked upregulation of interferon-related genes (IFI6, IFI44, IFITM1 and ISG15), together with additional genes previously reported in long-term persisting CAR T cells in B-ALL17 (GPR183, HMOX1, FXYD2 and CAV1) (Fig. 3g and Supplementary Table 7). To further validate these findings, we generated a composite ‘late CAR T signature’ score based on genes defined by Anderson et al.18 and observed significantly higher scores in long-term CAR+ T cells compared with those at the expansion peak (P < 2 × 10⁻¹⁶; Fig. 3h)17. Moreover, the high ‘late CAR T signature’ observed at year 9.3 was restricted to the CAR+ T cell compartment, indicating that this transcriptional program is specific to CAR+ T cells rather than a global T cell phenomenon (Fig. 3i).
These findings indicate that in patient 21, long-lived CAR T cells remain metabolically and functionally engaged, progressively transitioning from a cytotoxic CD8+ phenotype toward a DN state that adopts a late transcriptional program characterized by an activated effector-memory-like state.
Validation of the phenotypic and transcriptional profile in long-term-persisting CAR T cells in patients with NHL, B-ALL and CLL
To assess the generalizability of the findings from patient 21 in NHL, we analyzed eight additional patients with NHL treated with commercial tisagenlecleucel for whom we had available samples at 1–3 years after infusion. CAR+ T cells were detectable in one patient using flow cytometry (patient c077, 0.45% of total T cells; Fig. 4a, Supplementary Fig. 15 and Supplementary Table 8). In patient c077, persisting CAR+ T cells were enriched for DN T cells compared to their CAR− counterparts (27% versus 8%) and predominantly displayed an effector memory phenotype (51% versus 26%) (Fig. 4b,c). Consistent with what was observed in patient 21, these cells exhibited a proliferative, activated–exhausted phenotype marked by increased HLA-DR, TIM-3 and Ki-67 expression (Fig. 4d), suggesting a similar evolutionary trajectory.
Fig. 4: Long-term persisting CAR T cells share phenotypic and transcriptional features across diseases and CAR T products.
a, Representative gating strategy for CAR+ T cells in patient c077 at year 1 (Y1) after tisagenlecleucel infusion. Gating was defined using a CAR fluorescence minus one control. b, Distribution of CD4+, CD8+, DP and DN populations among CAR+ T cells compared with CAR− T cells in patient c077. c, Memory phenotype distribution of CAR+ T cells compared with CAR− T cells in patient c077. Memory subsets were defined as follows: naive (CD45RA+/CCR7+), TCM (CD45RA−/CCR7+), TEM(CD45RA−/CCR7−) and TEMRA (CD45RA+/CCR7−). d, Radar plot showing the percentage of cells expressing activation, exhaustion and proliferation markers in CAR+ T cells compared with CAR− T cells. e, Late signature score across early, mid and late CAR+ T cell populations from the dataset by Anderson et al.18 (total CAR T cells from the CARPALL dataset: 55,940 cells), compared with year 9.3 (Y9) CAR T cells from patient 21. Analysis was restricted to G1 phase cells. The box plots show the per-cell distribution of the late score as defined by the late-persisting CAR T signature. The dotted line represents the median of the late CAR T from the CARPALL study. The box plots show the first quartile (the lower end of the box), the third quartile (upper end of the box) and the median values (center line) per dataset. The ‘whiskers’ extend from the ends of the box to a maximum and minimum of 1.5 times the interquartile range beyond the box. Outliers are shown as dots. f, Heatmap showing logistic regression-based cell-to-cell similarity between early, mid and late CAR T cells from the Anderson et al. dataset and both Y9 and peak CAR+ T cells from patient 21. Predicted similarity scores are shown on the logit scale; higher values indicate greater transcriptional similarity to the corresponding reference state. Analysis was restricted to G1 phase cells. g, Late signature score in Y9 CAR+ T cells from the dataset of Melenhorst et al.17 compared with Y9 CAR+ T cells from patient 21. Analysis was restricted to G1 phase cells. The box plots show the per-cell distribution of the late score as defined by the late-persisting CAR T signature. The dotted line represents the median of the CD4+ persisting CAR+ T cells (total: 819 cells). The box plots show the first quartile (the lower end of the box), the third quartile (upper end of the box) and the median values (center line) per dataset. The ‘whiskers’ extend from the ends of the box to a maximum and minimum of 1.5 times the interquartile range beyond the box. Outliers are shown as dots. h, Heatmap showing logistic regression-based cell-to-cell similarity between Y9 CAR+ T cells from the dataset of Melenhorst et al.17 and both Y9 and peak CAR+ T cells from patient 21. Predicted similarity scores are shown on the logit scale; higher values indicate greater transcriptional similarity to the corresponding reference state. Analysis was restricted to G1 phase cells.
Source data
To further validate a shared transcriptomic drift in very-long-persisting CAR T, we evaluated whether the transcriptional program of patient 21 CAR+ T cells at year 9.3 overlapped with the profiles described in persisting CAR+ T cells in other hematological malignancies, such as B-ALL and CLL. Persisting CAR T cells from patient 21 exhibited a ‘late signature score’ comparable to long-term CAR+ T cells reported in pediatric B-ALL by Anderson et al.18. Unbiased logistic regression further showed that peak CAR T cells from patient 21 aligned with early and intermediate CAR T cell states, whereas year 9.3 persisting cells shared transcriptional similarity with long-lived CAR T cells observed in acute leukemia (Fig. 4e,f). Similarly, decade-long persisting CAR T cells in CLL (patient 1, year 9.3), as reported by Melenhorst et al.17, despite a predominance of CD4+ cells, exhibited both a comparable ‘late CAR T signature’ score and a similar global transcriptional profile (Fig. 4g,h).
Collectively, these findings suggest that long-lived CAR T cells converge on a shared trajectory of functional maturation and persistence across disease settings and CAR T cell products.
Persisting CAR T cells are oligoclonal and are already present at peak expansion
Finally, we analyzed TCR repertoire dynamics to assess whether these phenotypic shifts reflected clonal selection. At peak expansion, we identified 1,593 unique clonotypes within the CAR+ compartment and 2,598 within CAR− T cells, whereas at year 9.3 after infusion, 68 clonotypes were detected in CAR+ T and 4,239 in the CAR− T cell compartment. Normalized Shannon entropy within CAR− T cells remained stable from peak to year 9.3 (Shannon index 0.81 versus 0.83), while in CAR+ T cells entropy declined markedly (0.95 versus 0.38), which is consistent with oligoclonal CAR T cell persistence (Fig. 5a). In line with this observation, a single clonotype (CSAGTWGTEAFF) accounted for nearly 70% of CAR+ T cells at year 9.3, whereas it represented less than 0.1% at the peak time point, where it localized to both DN and CD8+ clusters (Fig. 5b and Supplementary Fig. 16). The dominant clonotype did not match any known antigen specificities annotated in the VDJ database26. Additionally, projection of this clonotype onto the year 9.3 CAR T UMAP revealed localization within proliferating and activated/early exhausted features, supporting a role in sustained immune surveillance (Fig. 5c and Supplementary Figs. 8 and 9). Consistent with this proliferative and activated state, the dominant clonotype at year 9.3 displayed upregulation of proliferation-associated genes (MKI67, PCNA) and activation or effector-related genes (CD38, CD70, CXCR3) relative to other coexisting clones27,28 (Fig. 5c and Supplementary Table 9).
Fig. 5: Long-term CAR T cells are oligoclonal.
a, Stacked bar plot representing the TCR β repertoire in CAR− and CAR+ T cells at both peak and year 9.3, showing a marked reduction in normalized Shannon entropy exclusively within the CAR T compartment. As these analyses were performed in a single patient with one repertoire measurement per time point, data are descriptive and no formal statistical comparison was performed. b, Alluvial plot tracing the ten most abundant TCRβ clonotypes at year 9.3 back to their representation at peak. Oligoclonal selection was consistent with reduced normalized Shannon entropy. c, Projection of the dominant β-chain clonotype on the UMAP of year 9.3 CAR T from patient 21, highlighting its enrichment within cluster-expressing markers of proliferation and activation (left). Right: differential gene expression analysis comparing the dominant clonotype to the other clones within the CAR T population at year 9.3; genes with an absolute log2(fold change) greater of 0.25 are plotted. d, CAR integration-site analysis at year 9.3 confirms oligoclonality of the CAR+ T cell population.
Source data
Finally, to exclude the possibility that long-term CAR T persistence resulted from vector integration within oncogenes or from gene-driving T cell proliferation, we performed integration-site analysis on the year 9.3 sample and identified 111 unique insertion sites. Notably, oligoclonality was confirmed at the integration-site level (Gini index = 0.81), with 45% of insertions mapping to the PACS1, 19% to COX11 and 7% to CAMSAP1; however, none of the dominant integration sites involved genes previously associated with enhanced CAR T persistence (Fig. 5d)29.
Altogether, these results highlight that CART19 can maintain durable CAR T persistence through selective persistence of functionally competent clones rather than insertional mutagenesis. In summary, we identified a long-lived DN αβ TEM-like CAR T subset, metabolically oxidative phosphorylation-fit, GZMKhigh (therefore, nonterminal), checkpoint-high but still proliferative and cytotoxic, capable of intermittent antigen-triggered expansions that sustain remission, a ‘guarded throttle’ program that maintains efficacy while limiting inflammatory toxicity, but at the cost of persistent B cell aplasia and late infectious risk.
