


TACTida clinical trial
This study is part of a larger clinical trial involving HCC patients undergoing TACE treatment with an infusion of idarubicin (TACTida). The TACTida study is an open-label, single center, non-randomized two-step active-treatment clinical trial. The study protocol has been previously documented by Nyman et al.25. The trial is registered in the European Union Clinical Trials Register under EUCTR2021-001257-31-SE (registration date: 02 July 2021) and approved by the Swedish Ethical Review Authority (Dnr. 2021 − 01928) and the Medical Products Agency, Uppsala, Sweden. The study was conducted in accordance with the Declaration of Helsinki. Patients were recruited and biopsies collected at the Uppsala University Hospital, Sweden, between February 2022 and November 2024, in accordance with the inclusion and the exclusion criteria stated in the study protocol25. Study completion was achieved in June 2025. Following written and oral information regarding the study, an informed consent form was signed by all participants. No patients or members of the public were involved in the design or conduct of the study. TACE was conducted by experienced interventional radiologists at the Uppsala University Hospital following local standard practice.
Human tissues and biopsy procedure
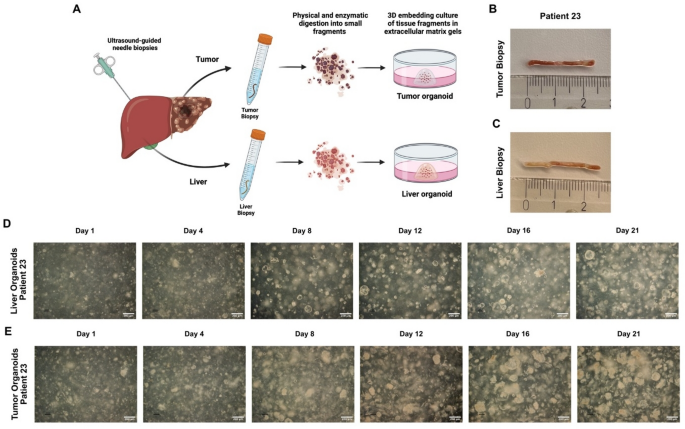
The present research was conducted in collaboration with Uppsala University Hospital, Sweden, which provided the human biopsies. Tumoral tissue and non-tumoral liver parenchymal samples were acquired from biopsies performed on patients diagnosed with HCC enrolled in the TACTida trial. As described by Nyman et al.25, 1.6 mm diameter ultrasound-guided needle liver biopsies were obtained under local anesthesia, following each PET/MRI scan. Imaging was performed on each hepatic lobe to retrieve a total of four liver biopsies. Two biopsies were harvested from a viable tumor, followed by two other biopsies collected from non-tumorous liver parenchyma taken in the vicinity of the tumor (Fig. 1A and B). Approximately, 5 mg of biopsy tissue was placed in advanced DMEM/F-12 (Lot. No. 2522537, GIBCO, Thermo Fisher, Grand Island, NY, USA) with 0.05% fetal bovine serum (FBS) (10082-147, Thermo Fisher Scientific, Stockholm, Sweden) for 3D model organoid generation.
Organoid culture
Biopsies used for organoid generation were obtained before patients received their first TACE treatment. Tumor and non-tumor liver biopsy samples to be used for the establishment of 3D organoids were approximately 1.6 mm x 5 mm in size, equivalent to a volume of 6.24 mm3 (approx. 5 mg) (Fig. 1A-C). They were then cultured with advanced DMEM/F-12 and 0.05% FBS, and directly transferred on ice to the laboratory, before being processed for organoid culture 20 min following retrieval. Mechanical dissociation of the tissue was first carried out, followed by enzymatical digestion with collagenase type IV, to achieve small clusters of cells. Full digestion into individual cells was avoided, as maintaining cell-to-cell interactions intact has been previously shown to promote a more effective derivation26. Tumor tissue was mechanically minced and digested briefly (maximum (max) 2–4 min) with Tissue Dissociation Cocktail (2.5 mg/mL collagenase IV (Lot. No. 2357215-1G, GIBCO, Life Technology Corporation, Grand Island, NY, USA), 0.1 mg/mL DNase I solution (Lot. No. 100121466, StemCell Technology, Canada) and Dulbecco’s Modified Eagle’s Medium: Nutrient Mixture F-12 (DMEM/F-12) with 15mM HEPES buffer at 37 °C (Fig. 1A). Purification was then completed through washing and centrifugation. Variations in tumor biopsy size availability for 3D organoid culture prompted differences in procedural performance, depending as well on the content of viable tumor biopsy tissue. Non-tumor organoid culture also slightly differed, as the digestion process and incubation were longer.
Cell clusters were then seeded into Geltrex (Reduced Growth Factor BMM (Basement Membrane Matrix)) (Lot. No. 963702, GIBCO, Grand Island, NY, USA). After gelation of Geltrex, initiation organoid medium was added to the gel dome and has been changed every 2 days for 21 days (Fig. 1D-E). The composition is HepatiCult Organoid Basal Medium (Human) (Lot. No. 1000050870, StemCell Technologies, Canada), Organoid Supplement Solution (Lot. No. 1000078881, StemCell Technologies, Canada), HepatiCult Organoid Growth Supplement (Human) (Lot. No. 1000072496, StemCell Technologies, Canada) and 4-[(1R)-1-aminoethyl]-N-4-pyridinyl-trans-cyclohexanecarboxamide, dihydrochloride (Y-27632) (Lot. No. 1000075285, StemCell Technologies, Canada).
Organoids were passaged by mechanical dissociation to proliferate for 3–5 passages with advanced DMEM/F-12 and 0.04% solution of 25% Bovine Serum Albumin Fraction V, protease free (BSA) (Lot. No. 6995421-50G, Roche Diagnostics Gmbh, Mannheim, Germany) through a 1 ml pipette for 2 min. For each passage, growth organoid medium was added to the gel dome and has been changed every 2 days for 6 days. The composition is HepatiCult Organoid Basal Medium (Human) and HepatiCult Organoid Growth Supplement (Human) (Lot. No. 100–0385, StemCell Technologies, Canada). Cryovials were prepared at regular intervals by dissociating organoids and resuspending in Recovery Cell Culture Freezing Medium (Lot. No. 2450336, GIBCO, Life Technology Corporation, Grand Island, NY, USA) prior to freezing. We prepared frozen stocks of early (≤ P5) passages from all the samples that yielded tumor organoids.
Fig. 1
Establishment of tumoral and non-tumoral organoid cultures from needle biopsies of HCC Patients. (A) Schematic workflow of organoid generation from needle biopsies. Representative biopsy images of tumor (B) and liver tissues (C) used for organoid generation. Representative bright-field images of non-tumor (D) and paired tumor liver tissue (E) organoids from patient 23 during culture. Tumor organoids form compact spheroids, whereas liver organoids from non-tumor liver tissue grow as cystic structures. Organoids were imaged regularly during the initiation period through Day 21 (end of initiation period). Scale bar: 200 μm.
Drug treatment
Idarubicin hydrochloride (Batch/Lot. No. 9YP5033) was purchased from Pfizer AB, Sollentuna, Sweden, dissolved in Sterile Saline Solution (0.9% Sodium Chloride NaCl) at 500 µM aliquots, and stored at -20 °C. Tumoral and liver organoids were seeded in 48-well plate (Lot. No.178547, Thermo Fisher Scientific, Roskilde, Denmark) at a density of 5 × 10³ fragments in 15 µL RGF BME2 droplets. Growth organoid medium was changed every two days to form organoids. PDOs were allowed to grow for 6 days before IDA treatment. Following drug exposure for 24 h, organoid viability was assessed using the CellTiter-Glo® 3D Cell Viability Assay reagent according to the manufacturer’s guidelines (Lot. No. 0000569665, Promega Corporation, Madison, USA). Organoids were exposed to different doses of IDA ranging from 0 to 100 µM. For the comparative study, Doxorubicin Accord 25mL (2 mg/mL; Vnr: 189790, Accord Healthcare Polska Sp.z o.o., Pabianice, Poland). Organoids were exposed to different doses of DOX ranging from 0 to 500 µM. Luminescence was measured on a Synergy H4 Hybrid Reader (BioTek Instruments). Results were normalized to negative control. Curve fitting was performed with Prism (GraphPad) software using nonlinear regression. Pictures were acquired using a Nikon Eclipse TE2000-U microscope equipped with a Nikon D-ECLIPSE camera and Nikon Plan Apo objectives (Plan Fluor 4x/0.130 Ph DL).
Histological staining
Tumoral and liver organoids were seeded in a 24-well plate (REF. No.83-3922, SARSTEDT, Nümbrecht, Germany) at a density of 1.5 × 10⁴ fragments in 40 µL RGF BME2 droplets. Organoids were collected and pelleted by centrifugation (1200 rpm, 5 min, 4°C) and fixed in 4% paraformaldehyde for 15–30 min. Samples were then washed repeatedly in DPBS (3×, 250 × g, 5 min) to ensure complete removal of fixative prior to storage at 4°C. Following fixation and washing, organoids were pelleted by centrifugation (1200 rpm, 5 min) and encapsulated in liquified HistoGel™ (50–200 µL) by resuspension, allowing the gel to solidify into a compact block prior to paraffin embedding. Encapsulated organoid samples were subsequently transferred into tissue cassettes and subjected to automated paraffin processing to allow paraffin infiltration. Following infiltration, samples were embedded in molten paraffin using an embedding center by orienting the HistoGel™ block in a metal mold, after which the paraffin was allowed to solidify to form a stable block for subsequent sectioning. This procedure was performed according to the protocol elaborated by Bruna Almeida and Luca Urbani from The Roger Williams Institute of Hepatology (London, UK), adapted from Bancroft and Gamble27. Paraffin-embedded blocks were then sectioned at a thickness of 5 μm and dried overnight. Prior to staining, sections were deparaffinized and rehydrated. In accordance with standard protocols28, Hematoxylin and Eosin (H&E) staining was conducted to assess organoid morphology.
For immunofluorescence staining, antigen retrieval was carried out at 95 °C for 1 h using Diva Decloaker solution (DV2004, Biocare, Gothenburg, Sweden). Sections were then blocked for 30 min and incubated overnight at 4 °C with primary antibodies against epithelial cell adhesion molecule (EpCAM) (AB 71916, Abcam, Cambridge, UK), cytokeratin 19 (CK19) (14-9898-82, ThermoFisher, Stockholm, Sweden), β-catenin (14-2567-82, ThermoFisher, Stockholm, Sweden), platelet endothelial cell adhesion molecule-1 (CD31) (14-0319-82, ThermoFisher, Stockholm, Sweden), and alpha-smooth muscle actin (αSMA) (ab5694, Abcam, Cambridge, UK). Following overnight incubation, sections were incubated for 1 h at room temperature with secondary goat anti-rabbit antibody conjugated to Alexa Fluor™ 488 IgG (H + L) (A-11008, ThermoFisher Scientific, Stockholm, Sweden) and secondary goat anti-mouse antibody Alexa Fluor™ 633 IgG (H + L) (A-21050, ThermoFisher Scientific, Stockholm, Sweden). Nuclei were counterstained with DAPI, and sections were mounted using Fluoromount-G (ThermoFisher Scientific, Stockholm, Sweden). Fluorescent images were acquired using a slide scanner (Carl Zeiss, Axio Scan Z1, Jena, Germany) equipped with a 40×/0.95 Korr M27 Zeiss objective, and representative images were used to characterize organoid structure and marker expression.
Quantitative RT-PCR of mRNA
Tumoral and liver organoids were seeded in a 24-well plate (REF. No.83-3922, SARSTEDT, Nümbrecht, Germany) at a density of 1.5 × 10⁴ fragments in 40 µL RGF BME2 droplets. RNA was extracted from three domes of PDOs using a RNeasy Universal Mini Kit (74004, Qiagen, Sollentuna, Sweden), following the manufacturer’s manual. More precisely, three technical triplicates were combined in one sample for RNA extraction and qPCR was run on two technical replicates. RNA concentration and purity were determined with a Nanodrop spectrophotometer. The iScript cDNA-synthesis kit (1708891, Bio-Rad, Solna, Sweden) was used for mRNA reverse transcription according to the manufacturer’s guidelines. Primers purchased from ThermoFisher (Supplementary Table 1) were designed with Primer Blast. Amplifications were conducted with Fast SYBR Green (Ref: 4385612, ThermoFisher Scientific) in accordance with the manufacturer’s protocol. Quantification of mRNA levels was performed using QuantStudio 5 (ThermoFisher Scientific) with target gene expression normalized to GAPDH. Using the 2-ΔΔ CT method, fold changes were calculated from average CT values of two technical duplicates for each sample.
Enzyme-linked immune sorbent assay (ELISA)
Tumoral and liver organoids were seeded in 24-well plate (REF. No.83-3922, SARSTEDT, Nümbrecht, Germany) at a density of 1.5 × 10⁴ fragments in 40 µL RGF BME2 droplets. Conditioned-medium culture from untreated and treated organoids with 2.5 µM IDA for 24 h were used to measure alpha-fetoprotein (AFP) and transforming growth factor-beta 1 (TGF-β1) levels with ELISA kits (EHAFP, ThermoFisher, Stockholm, Sweden) and (88-8350, ThermoFisher, Stockholm, Sweden) respectively according to the manufacturer’s manual. Absorbance was measured at 450 nm with a Synergy H4 Multi-Mode Reader (BioTek Instruments). Results calculations were carried out based on the averages from 3 biological replicates and 2 technical duplicates.
Live-dead assay
Cell viability in organoids was assessed using the Invitrogen™ LIVE/DEAD™ Viability/Cytotoxicity Kit for mammalian cells (catalogue number L3224, lot 2600120) according to the manufacturer’s instructions. Tumoral and liver organoids were seeded in 24-well plate (REF. No.83-3922, SARSTEDT, Nümbrecht, Germany) at a density of 1.5 × 10⁴ fragments in 40 µL RGF BME2 droplets. Organoids were incubated with a staining solution containing calcein-AM (0.5 µL/mL) and ethidium homodimer-1 (2 µL/mL), prepared in DPBS, for 30 min at 37 °C. Following incubation, organoid domes were rinsed again with DPBS. Images were acquired within 1–2 h after staining using a confocal laser scanning microscope (LSM 700, AxioObserver Carl Zeiss, Jena, Germany) equipped with a Fluor 10×/0.50 M27 objective, and live cells (calcein-AM, turquoise fluorescence) and dead cells (ethidium homodimer-1, violet fluorescence) were identified based on their fluorescence signals. Image analysis was performed using a custom macro to identify, quantify, and calculate the percentage area of dead cells relative to the total live cell area in tumor PDOs following treatment with idarubicin. The macro automatically excluded background signals from the analysis.
Clinical assessment of tumor necrosis and response
All imaging assessments, tumor response evaluations, and comparative statistical analyses of ex vivo organoids IC50 values with corresponding patient clinical data from the TACTida trial were conducted by the Uppsala University Hospital. Methods for the clinical correlations are specified in the next section.
In accordance with the study protocol described by Nyman et al.25, imaging assessments were performed before and after TACE. PET/MRI was conducted prior to the first TACE, after the first complete TACE, and after the second TACE in patients with bilobar disease. Contrast-enhanced CT was performed 2–3 weeks after the first TACE to assess lipiodol uptake in the liver. MRI follow-up was conducted after every three completed TACE treatments (every third TACE in unilobar disease and every sixth TACE in bilobar disease). Tumor response was evaluated according to the predefined TACTida protocol using modified Response Evaluation Criteria in Solid Tumors (mRECIST), based on contrast enhancement patterns and changes in viable tumor tissue. MRI parameters included signal intensity, contrast enhancement, and apparent diffusion coefficient (ADC) values. Tumor necrosis was quantified as the percentage change in viable tumor tissue between baseline and post-treatment imaging and was included as an outcome variable describing treatment effect. mRECIST response categories Complete Response (CR), Partial Response (PR), Stable Disease (SD) and Progressive Disease (PD), as well as overall response and disease control, were used to compare tumor response before and after treatment and between patients.
Correlations with organoid IC50 values
IC50 values were obtained from PDOs established from tumor and non-tumor tissues. For each patient, IC50 values measured in tumor-derived organoids (IC50 tumor) were used as the primary ex vivo parameter. IC50 values were analyzed both as continuous variables and after stratification into “high” and “low” groups based on the median value. The IC₅₀-derived parameters were evaluated in relation to tumor response, defined by percentage of tumor necrosis and radiological response assessed according to mRECIST criteria, including overall response and disease control rates.
Single-gene correlations were also performed to assess whether dose expression of a specific gene or protein associates with drug sensitivity. Log(IC50) values from untreated PDOs were correlated either with individual gene expression from qPCR or with protein concentration from ELISA. qPCR data were normalized using the 2^−ΔΔCt method, and ELISA measurements were used as calculated protein concentrations (pg/ml). For each marker, scatter plots were generated with individual data points and a fitted linear trend line for visualization. Correlation coefficients (ρ) and corresponding p-values were reported. All analyses were conducted using GraphPad Prism.
Statistical analysis
Data are presented as mean ± standard error of the mean (SEM). Statistical significance was determined using one-way analysis of variance (ANOVA) or an unpaired, two-tailed Student’s T-test, followed by Tukey’s multiple comparison test. p-values < 0.05 were considered statistically significant. IC50 values were determined by fitting the curve between the inhibitor and the dose response using the nonlinear regression analysis with the “[inhibitor] vs. response (three parameters)” model in GraphPad Prism 9. Spearman’s rank correlation was conducted to evaluate associations between molecular markers and organoid IC50 values. Fisher’s exact test and Spearman correlation were performed to assess associations between clinical parameters and organoid IC50 values. Statistical analyses and graphs were made using GraphPad Prism 9. Experiments were done in at least three biological replicates, which we define as parallel measurements of biologically distinct samples taken from independent experiments. Technical replicates were defined as loading the same sample multiple times on the final assay. Outliers were kept in the analyses, unless they were suspected to occur due to technical errors, in which case the experiment was repeated. No formal sample size calculation was performed, as this study was exploratory and based on available PDO material.
