


Comprehensive cellular and spatial atlas of the developing human meninges
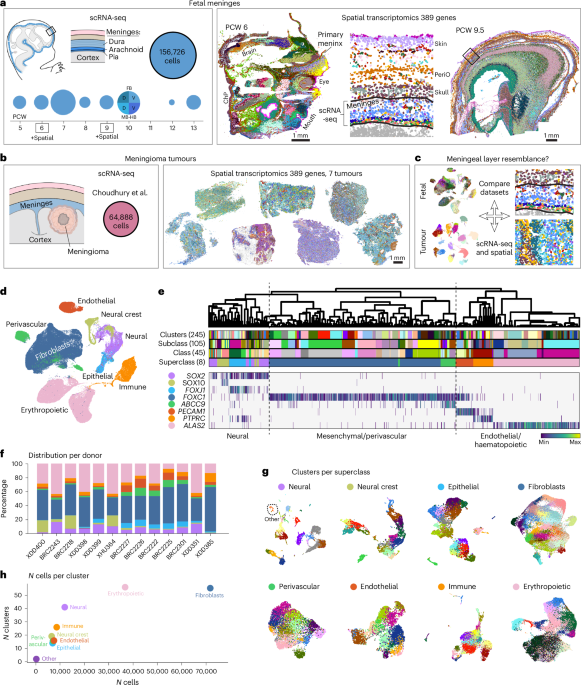
For scRNA-seq, we collected 16 human meninges samples from 13 donors across PCW 5–13. We collected the whole meninges that peeled off the brain (Extended Data Fig. 1a,b). A total of 156,726 high-quality cells were used for further analysis (Fig. 1a), and the mean unique molecular identifiers (UMIs) per sample were 8,842. As expected, anucleated erythropoietic cells showed the lowest gene and UMI counts (Extended Data Fig. 1c); excluding those cells, the mean UMI count was 10,249 (Supplementary Table 1). An analysis of the distribution of maternal and paternal SNP alleles21 (Methods) indicated that all cells were fetal except some erythrocytes (Extended Data Fig. 1d). We found that the data were well integrated across samples even in the absence of batch correction, which we therefore omitted to avoid suppressing true biological variation (Extended Data Fig. 1e,f).
We generated a total of 245 clusters, annotated to four levels of detail: cell type (n = 115), subclass (n = 105), class (n = 45) and superclass (n = 8). We computed metadata such as cell cycle score, fetal age and enriched genes for each cluster (Supplementary Table 2). The largest superclass consisted of FOXC1+ fibroblasts, which made up half the dataset, in addition to PECAM1+ endothelial, ABCC9+ perivascular, PTPRC+ immune and ALAS2+ erythropoietic cells in the meninges, across all donors. We also acquired interacting SOX2+ neural, SOX10+ neural crest and FOXJ1+ epithelial (choroid plexus, ChP) cells (Fig. 1d–h). Due to the diversity of our dataset, we were able to generate highly specific markers for many cell types of the meninges (Extended Data Fig. 1g).
We used spatial transcriptomics to validate and locate cell types identified from using scRNA-seq data. To keep the meninges anatomically intact, we cryosectioned whole heads at PCW 6 and PCW 9.5. Two mediolateral sagittal sections from PCW 6 and one lateral sagittal section from PCW 9.5 were analysed, with a custom probe-set targeting 389 genes (Supplementary Table 3) selected on the basis of the fetal scRNA-seq data. We generated 53 and 50 clusters respectively, after single-nucleus segmentation at the two ages (Extended Data Fig. 1h,i and Supplementary Table 4). At PCW 6, we found diverse populations of craniofacial mesenchyme, neural crest-derived tissues, progenitors and differentiating neural cells of the CNS, ChP and vascular and immune cells. Importantly, we identified the earliest described layer of the meninges; the primary meninx (Extended Data Fig. 1h). At PCW 9.5, clustering highlighted a remarkably complete stack of layers spanning the developing cortical layers from the ventricular zone to Cajal–Retzius cells in the cortical plate, to fibroblasts of the meninges, future skull, periosteum and skin (more in Fig. 4). We also noted scattered populations of various immune cells, Schwann cells (melanocytic lineage) and vascular cells, among others (Extended Data Fig. 1i).
In the following sections, we analysed each superclass of meningeal cells—immune, vascular and fibroblasts—focusing on their heterogeneity and maturation during meningeal development.
Fetal immune heterogeneity and B-lineage cells from PCW 5
The fetal meninges harboured a surprising heterogeneity of immune cells across PCW 5–13, even at the earliest stages. We identified 19 cell types of myeloid and lymphoid origin (Fig. 2a,b and Extended Data Fig. 2a). Except for three cells, all immune cells were of fetal origin (Fig. 2c). Furthermore, spatial transcriptomics validated and located those immune cells in the primary meninx at PCW 6, and leptomeninges and dura at PCW 9.5 (Fig. 2d–g).
Fig. 2: Immune cell diversity in the developing meninges.
a, UMAP coloured by clusters of annotated immune cells. MEMP, megakaryocyte erythroid mast cell progenitor; MEP, megakaryocyte erythroid progenitor. b, UMAP coloured by sample age. c, UMAP coloured by maternal/fetal genotype, by maternal/paternal SNP analysis (Methods). The inset highlights two maternal immune cells (arrows). n/a, genotype not called. d, UMAPs coloured by gene expression on a grey background of all cells, and spatial transcriptomics at PCW 9.5, of mast cell markers. e, UMAPs coloured by gene expression of immune cell markers. f, Spatial transcriptomics of PCW 6 (n = 1) and 9.5 (n = 1) fetal heads, showing RNA molecules on DAPI. Marker genes for microglia, monocytes/macrophages and dendritic cells are shown, coloured as in a. g, The same as f but for ILC/natural killer T (NKT) cells, B cells and the myelocytic lineage. h, Percentage of immune cell types, coloured as in a. i, Dot plot of scRNA-seq gene expression of B-lineage markers across developmental tissues (fetal bone marrow as B cell ref. 24 versus yolk sac23, and meninges (these data)). The size of the dot represents the percentage of cells within a group that express a given gene, and the colour of the dot indicates ln(x + 1) mean gene expression within the group, where x equal counts normalized to 1 × 10⁴ per cell. ELP, early lymphoid cell; HSCs, haematopoietic stem cell; HSPCs, haematopoietic stem and progenitor cells. n = 13 meninges samples for a–e, h and i.
Source data
Macrophages were the most abundant (Fig. 2h), with plentiful IBA1+ cells concentrated around the primary meninx/leptomeninges at PCW 6 and 9.5 (Extended Data Fig. 2b). IBA1 staining of meninges revealed a uniform sparse tiling of macrophages in en face floating sections (Extended Data Fig. 2c), consistent with repelling mechanisms controlling their location. The leptomeninges defined an anatomical barrier where microglia (CX3CR1, P2RY12 and C3) always resided on the brain side, while monocytes/macrophages (CD14 and MRC1) resided in the leptomeninges and the rest of the head, already from PCW 6 (Fig. 2f). Microglia were also concentrated inside the developing eye, while monocytes/ macrophages resided outside, except one macrophage inside a ring of endothelial cells at the very centre (Extended Data Fig. 2d).
There is growing evidence for a B lymphoid cell presence in early human development. Recent investigations defined CD34+IL7R+CD19− early lymphoid progenitors (ELP) in human fetal liver as early as PCW 622, and the yolk sac ‘lymphoid B lineage’ from PCW 4–623. These data raise the intriguing possibility that adaptive lymphoid cells are generated and established in peripheral organs as early as PCW 6. However, this has not been determined yet in the embryonic head and meninges. B-lineage cells made up 0.3% of immune cells in the meninges (Fig. 2h) and were clearly distinct from innate lymphoid subtypes (innate lymphoid cell precursors and CD56-bright natural killer cells) (Extended Data Fig. 2e,f). Our scRNA-seq data confirmed that CD34+IL7R+CD19-low ELP-like B-lineage cells were transcriptionally similar to second trimester fetal bone marrow ELPs24, where B cells are well described to differentiate and diversify (Fig. 2i). We confirmed ELP presence in embryonic meninges as early as PCW 5, and up until about PCW 7, after which point (PCW 8-13) the meningeal B lineage appeared to differentiate and acquire more mature markers for pre pro-, pro-, pre-, and immature B cells (Extended Data Fig. 2g).
These data position the meninges as a contributor to the first- and second-trimester differentiation and diversification of human B cells. Furthermore, we demonstrate B cell presence in the embryonic meninges 1 week earlier in gestation than previously reported for liver tissue.
Fetal meningeal vasculature and ChP
The fetal meninges contained perivascular cells such as pericytes, smooth muscle cells, and perivascular fibroblasts (Fig. 3a), as well as vascular endothelial cells (Fig. 3b,c). The endothelial cells expressed stereotypical genes involved in arteriovenous zonation (Fig. 3d,e), as previously described in mouse and human25,26,27,28, and also contained COL15A1+ESM1+ tip cells (Fig. 3d). RNA velocity (scVelo; Fig. 3b) and analysis of endothelial cluster composition over time (Fig. 3e) showed that PCW 5 was dominated by a primary vascular plexus giving rise to tip cells penetrating the brain. This was followed by the appearance of arterial and venous capillaries around PCW 6–9, giving rise to larger arterioles and venous lymphatic-like cells respectively at PCW 12–13. However, the forebrain lacked venous capillaries from PCW 5 to 13 (Fig. 3e), indicating that this vascular specification occurred earlier in the meninges. Immunostaining of smooth muscle actin (ACTA2 gene) showed that larger arteries existed in the leptomeninges, dura and skin at PCW 9.5 (Fig. 3f,g).
Fig. 3: Vasculogenesis in the meninges and brain.
a, UMAP of perivascular cells (n = 13 samples). b, UMAP of endothelial cells (n = 13 samples), coloured by arteriovenous zonation. Arrows show RNA velocities. c, UMAP of endothelial cells coloured by sample ages. d, Gene expression of arteriovenous zonation markers, as well as lymphatic and tip cells. e, Proportion of endothelial cell types by age, in the meninges (n = 13) and forebrain13 (n = 14). f, Lectin dye (vasculature), DAPI (nuclei) and smooth muscle actin (SMA) immunostaining in a PCW 9.5 floating meninges (n = 3). g, The same as f but in a sagittal section (red arrows point to arteries, n = 1). h, Spatial transcriptomics of all endothelial cells (PECAM1), arteries (GJA5 and pink arrows), venous lymphatic-like cells (PROX1 and mint-green arrows), leptomeninges and brain-specific endothelial cells (FOXQ1 and orange arrows) and arachnoid (SLC22A6) in a PCW 9.5 head. Coloured dots represent RNA molecules. i, Spatial transcriptomics of PECAM1 and FOXQ1 in a PCW 6 head. j, The same as h but with pia (LAMC3), around an artery.
Source data
Most endothelial cells in the meningeal scRNA-seq dataset expressed the transcription factor FOXQ1 (Fig. 3d), which controls the differentiation of the blood–brain barrier endothelial cells in mice29. Spatial transcriptomics showed that all endothelial cells in the head expressed PECAM1, while FOXQ1 was uniquely expressed by endothelial cells below the arachnoid and extending into the brain (Fig. 3h) as early as PCW 6 (Fig. 3i).
The cellular ontogeny of meningeal lymphatic vessels is still unclear30. We found that ACKR1+LYVE1+ venous cells expressed the key lymphatic transcription factor PROX131,32,33 (Fig. 3d). Spatially, PROX1+FOXQ1+ endothelial cells were present below the arachnoid, and PROX1+FOXQ1− endothelial cells in the developing skin at PCW 9.5 (Fig. 3h,j). These observations suggest that (1) meningeal lymphatic cells were mostly derived from the venous endothelium, and (2) subarachnoid lymphangiogenesis may have started in early fetal development, surprisingly so, because meningeal lymphatics develop postnatally in mice34.
CSF is generated by filtration of blood at the ChP, filling the brain ventricles and subarachnoid spaces. We characterized the ChP with its epithelial cells, stroma, vascular and immune cells, and its inside-out anatomy in relation to the brain and meninges (Extended Data Fig. 3a–e). The ChP epithelium develops by differentiation from adjacent neuroepithelium (future multiciliated ependymal cells). Our scRNA-seq data comprised 22 clusters of brain and ChP epithelial cells from PCW 5 to 13 (Extended Data Fig. 3g,h) and identified HTR2C as a unique ChP epithelial marker (Extended Data Fig. 3i). At the junctions between future ChP epithelium and surrounding neuroepithelium, we identified similar dual neuro-epithelial progenitors (RSPO2 and RSPO3+) and ciliogenesis programs (DEUP1 (mouse Ccdc67), SHISA8 and AQP1) as previously described in mice35 (Extended Data Fig. 3j,k). Interestingly, by creating a gene-set score based on adult CSF proteomics36,37 (Supplementary Table 5), we observed that CSF genes were already expressed in fetal ChP epithelial cells (Extended Data Fig. 3l).
We also identified a fibroblast type present only in the ChP, which uniquely expressed TCF21 (Extended Data Fig. 3m,n). Both scRNA-seq and spatial transcriptomics showed that they also expressed the immune-related genes PTPRC (CD45, pan-leukocyte marker), and CD38. However, mouse Tcf21+Cd38+ fibroblasts did not express Ptprc (Extended Data Fig. 3m).
Our findings demonstrate that human ChP development uses mechanisms that are largely conserved from rodents, but with human-specific features that suggest an evolved role for ChP fibroblasts in immune surveillance at the blood–CSF border.
Fibroblast layer development in the fetal meninges and head
Fibroblasts are the principal cells of connective tissues. However, a comprehensive molecular analysis of human fetal head fibroblasts and the transcriptional cell-type composition of newly forming meningeal layers remain to be elucidated.
Fibroblast heterogeneity and organization
Our scRNA-seq analysis across the PCW 5–13 meninges yielded 71,657 fibroblasts. From this, we generated 55 clusters that we annotated as 29 cell types with distinctly enriched genes (Fig. 4a,b, Extended Data Fig. 4a and Supplementary Table 2). Twenty of these cell types belonged to the three meningeal layers; the pia, arachnoid and dura mater, their precursors, and the early primary meninx. We also captured other interesting fibroblasts, such as a fibroblast expressing TAGAP (T cell activating protein), osteogenic fibroblasts (PTHLH), chondrocytes (MATN4), hindbrain (HOXA3) fibroblasts and the previously mentioned PTPRC+ fibroblast unique to the ChP (Fig. 4b,c).
Fig. 4: Fibroblast layer development in human fetal heads.
a, UMAP of fetal meningeal fibroblasts coloured by sample age (n = 13 samples). b, UMAP coloured by annotated cell types. c, UMAP coloured by class. Black lines separate putative pia, arachnoid and dura lineages. d, Sagittal section of a PCW 6 head coloured by spatial clusters (n = 1). Three insets show the primary meninx, and where scRNA-seq was sampled. The colour for the primary meninx matches the scRNA-seq class ‘Primary meninx’ in c. Mac, macrophage; MonoC, monocyte; PR, prominence. e, The same as d but at PCW 9.5 around the telencephalon (n = 1). Insets show the meningeal clusters, and where scRNA-seq was sampled. Colours for meningeal layers match those in c. ECA, epicranial aponeurosis; LM, leptomeninges; SMC, smooth muscle cells. f, Analysis of meningeal layer maturation. Top left: UMAP of all fibroblasts (n = 13), subsets of PCW 6 (n = 2), 10 (n = 2) and 13 (n = 1) (this study) and adult12 (n = 3) fibroblasts. Cells are coloured by their expression of the gene they express most highly among LAMC3 (pia), SLC22A6 (arachnoid) and COL8A1 (dura). Bottom left: stacked bar chart showing the fraction of fetal and adult fibroblasts expressing a list of enriched genes from adult pia, arachnoid, and dura (Methods). Y, years. Right: median expression of the enriched gene lists over developmental timepoints (n = 13). g, Top: immunohistochemistry of ki67 and DAPI in a PCW 9.5 head (n = 1). Inset region ‘iv’ as in e but on an adjacent section. Bottom: scRNA-seq UMAP of fibroblasts coloured by cell cycle score. h, Spatial transcriptomics showing layer-specific markers. Brackets indicate the meninges. i, The same as h but SLC47A1 (inner dura) and MSX2 (outer dura, skull and periosteum). j, The same region as h and i but showing spatial clusters. k, H&E staining (n = 1). Black brackets show the meninges and pink brackets the dura. l, H&E staining of adult human dura (n = 4).
Source data
Next, we charted the distribution of fibroblast cell types in situ, in whole heads at PCW 6 and PCW 9.5 (Fig. 4d,e). At PCW 6, early craniofacial mesenchyme was found in well-defined spatial domains such as the mesenchyme of extraocular (eyes), maxillary/mandibular (jaws), otic (future ears) and cranial nerve-associated tissues (Fig. 4d). We also identified a spatial cluster representing the earliest meninges described in the literature, the primary meninx, from which we had also obtained scRNA-seq data (Fig. 4a–c). The primary meninx was a thin layer surrounding the entire brain together with FOXQ1+ endothelial cells (Fig. 4d, insets i–ii, and Fig. 3i), except around the lower ventral hindbrain where a pool of primary meninx, endothelial, immune and erythropoietic cells were mixed together (Fig. 4d, inset iii). We found that LAMC3 was uniquely expressed by the primary meninx (Extended Data Fig. 4b and Supplementary Table 4). By contrast, the meningeal marker FOXC1 was expressed broadly in craniofacial fibroblasts at PCW 6, and only later became specific to the meninges (Extended Data Fig. 4b).
At PCW 9.5, fetal head fibroblasts surrounding the telencephalon were already stratified into well-defined layers stacked on top of each other (Fig. 4e, inset iv). Clustering of the spatial data allowed us to identify fibroblasts of the skin (periderm and basal epidermis), future skull and periosteum, and the meningeal layers. Other cell types were also present within these fibroblast layers, such as the neural crest-derived Schwann-melanocytic lineage between the periosteum and basal epidermis, lymphatic endothelial cells and pools of erythropoietic cells in the outer periosteum, and classical monocytes mostly in the outer dura. The meninges were divided into eight spatial clusters: five of the outer dura, one inner dura layer, the arachnoid and the pia.
The meningeal layers develop concurrently
Next, we focused on meningeal layer formation over time (Fig. 4f–h). Using the scRNA-seq and spatial transcriptomic data, we identified and validated unique markers distinguishing the pia (LAMC3), arachnoid (SLC22A6) and dura (COL8A1), from PCW 5–13 and in adults (Fig. 4f,h and Extended Data Fig. 4a). LAMC3, which was expressed in the primary meninx at PCW 6, was specifically expressed in the pia in later ages. This indicated that the first meningeal fibroblasts to surround the brain are pia precursors, and/or that the pia develops from the primary meninx. Arachnoid and dura precursors were also present at PCW 5–6, although the emerging spatial organization of meningeal layers was found only around parts of the hindbrain in these sections (Extended Data Fig. 4c). At PCW 9.5, precursors of all three layers covered the entire cortex, and SLC22A2, which was expressed in more mature arachnoid populations, appeared first in the ventral telencephalon (Extended Data Fig. 4d).
We wondered whether the meningeal layers develop as separate lineages, and if therefore intermediate lineage-specific precursor cell types could be identified, as in haematopoiesis. However, examining the expression of the layer-specific markers LAMC3, SLC22A6 and COL8A1 in subsets of cells from PCW 6, 10 and 13, instead revealed gene expression gradients and a continuum of pia, arachnoid and dura cells at each age (Fig. 4f, top left). The same was true when pooling samples at PCW 5–6, 9–10 and 12–13, ruling out batch effects (Extended Data Fig. 4e). While this does not account for the spatiotemporal aspects of layer maturation observed in mice, it indicated that the meninges mature as a continuum of cell states, segregating into distinct layer-specific types only at developmental timepoints beyond PCW 13.
To further support this parallel model of meningeal development, we created a maturation score based on 50 enriched genes from each adult meningeal layer (Methods) (Fig. 4f, bottom left) and examined the temporal emergence of each layer as measured by this score. The analysis revealed that (1) genes expressed by the adult meninges were expressed in the first trimester, (2) their expression increased over PCW 5-13, demonstrating a gradual maturation of the meningeal layers, and (3) the pia, arachnoid and dura mature concurrently (Fig. 4f bottom left and right, and Extended Data Fig. 4f). The latter was also supported by the observation of cycling populations in each layer (Fig. 4g). Taken together, these results contradict a branched lineage model as seen in neurogenesis or haematopoiesis. Instead, they support a model where the meningeal layers are formed concurrently, by a gradual refinement of cell states that only segregate into truly distinct layer identities at later developmental timepoints. This resembles how patterning by morphogenetic gradients and cell–cell interactions influence cell fate and layer stratification38,39.
Identification of an inner and outer dura layer
Next, we investigated the dura in more detail (Fig. 4h–l). Our spatial transcriptomic data identified separate outer and inner layers of the dura (Fig. 4e). While both expressed COL8A1, the known chondrogenic marker COL2A114 and dura marker FXYD58, the inner layer was distinguished by high SLC47A1 expression (previously attributed to the dura border10). The outer dura was distinguished by expression of MSX2, which was also expressed in osteogenic tissues (Fig. 4h–j and Extended Data Fig. 4g). We identified a spatial cluster representing their potential common progenitor, which joined the outside of the primary meninx to surround the brain, and expressed MSX2, HHIP and COL2A1 (Fig. 4d ‘Skull/dura progenitors’, Extended Data Fig. 4c and Supplementary Table 4). This suggests that, from PCW 5 to 6, this lineage, together with the primary meninx, give rise to all the meningeal layers. This observation, together with the similarity between outer dura and skull progenitors, was also supported by Banksy spatial domain analysis (Methods; Extended Data Fig. 4h,i). Surprisingly, haematoxylin and eosin (H&E) staining revealed 8–12 sheets of fibroblasts in the outer dura (and extending to the outermost layer of the head), depositing extracellular matrix (ECM) that becomes compact in the adult dura (Fig. 4k,l).
The inner dura expresses many tight-junction genes necessary to form a barrier
The inner layer of the dura comprised a sheet of single cells, apposed onto the arachnoid. In the fetal head, the epithelial marker CDH1 (E-cadherin) was expressed in three thin fibroblast layers: the meningeal barrier, the outermost periosteal layer (epicranial aponeurosis) and the periderm (Extended Data Fig. 5a). Focusing on the meningeal barrier, in mice, Cdh1 is reportedly expressed only by arachnoid barrier cells40. In our data, CDH1 was expressed by both the SLC47A1+ inner dura and SLC22A6+ arachnoid barrier precursors, forming two very closely aligned layers of cells from PCW 9 onwards (Fig. 5a,b and Extended Data Fig. 5b,c). The inner dura and arachnoid barrier precursors also shared expression of CCN3 (also known as NOV), SLC4A4 and PTGDS (Fig. 5a,b) among others. PTGDS has been reported to target the arachnoid41, but Ptgds-Cre lineage tracing in mice has shown that it is expressed in the whole meninges42. In our data, PTGDS expression progressively increased with age in all three layers, including the pia (Extended Data Fig. 5d,e).
Fig. 5: Analysis of the arachnoid barrier and inner dura.
a, Spatial transcriptomics of CDH1, CCN3 (also known as NOV), SLC4A4 and PTGDS, and H&E staining at PCW 9.5 (n = 1). Ar., arachnoid; iDura, inner dura; oDura, outer dura. b, The same genes as a but coloured on scRNA-seq UMAPs of fibroblasts, on a grey background of all cells (n = 13). Black lines separate putative pia, arachnoid and dura lineages. c, UMAPs with SLC22A6 (arachnoid), CDH1 (barrier cells) and SLC47A1 (inner dura) expression in human fetal PCW 13 (this study, n = 1), human adult12 (n = 3) and mouse embryonic43 (n = 42) fibroblasts. Orange lines indicate the separation between arachnoid and dura, based on SLC22A6 expression. d, Clusters in fetal PCW 13 fibroblasts (this study) and adult fibroblasts12. Cluster colours match the expression of layer-specific genes in a. e, Stylized heatmaps showing the expression of genes encoding core components of tight-, adherens- and tricellular junction complexes, in clusters of fetal and adult inner dura and arachnoid barrier cells. Grey text indicates protein names where the gene names are dissimilar. f, Schematic illustration of our hypothesis that the arachnoid barrier is created between a layer of arachnoid barrier cells and the inner dura. Tight- and adherens junction proteins produced by genes in e, are shown, where the proteins left to right are in the same order as in e top to bottom, for intracellular and transmembrane domains. AD barrier, arachnoid–dura barrier. g, STRING interaction network of a uniquely bioactive gene signature in inner dura (n = 13 samples). Gene centrality outlined by red.
Source data
These observations suggest that the inner dura layer may form a functionally distinct layer attached directly on top of the arachnoid, rather than being a simple continuation of the dura proper. Supporting this idea, the inner dura histologically resembled arachnoid barrier precursors rather than the outer dura (Fig. 5a, H&E). We noted further that arachnoid and dura cells in both human adult12 and mouse fetal meninges43 also expressed CDH1 (Fig. 5c), demonstrating that this inner dura is an evolutionarily conserved feature that persists into the adult (Fig. 5c). Spatial transcriptomics of four human adult dura demonstrated that there existed CDH1+SLC47A1+ cells, and that were negative for SLC22A6 and SLC22A2 (Extended Data Fig. 5f).
To form a seal separating the dural and subarachnoid spaces, arachnoid barrier cells express tight- and adherens junctions. Interestingly, we found that genes encoding most of the components of a functional tight-junction complex (Fig. 5d–f) were also expressed in both the human fetal and adult inner dura (Fig. 5e, olive colour). Key genes included the transmembrane components OCLN (Occludin), a few CLDNs (Claudins) and JAMs, and the intracellular domains MAGIs, TJPs (Zona Occludens proteins), PARD3/PARD6A-B (PAR3/PAR6) and CDC42. Likewise, adherens junction genes were expressed, like CDH1 (E-Cadherin), NECTINs, CTNNA/Bs (α/β-catenin) and AFDN (Afadin) (Fig. 5e–f and Extended Data Fig. 5g,h). Finally, genes encoding four components of tricellular junctions were also expressed in the inner dura, MARVELD2 (Tricellulin), MARVELD3, LSR (Angulin-1) and ILDR2 (Angulin-3), which together are sufficient to form functional tricellular junction units (Fig. 5e).
Based on these observations, we propose the possibility that the complete meningeal barrier is formed by two CDH1+ layers of cells: the inner dura and the arachnoid barrier (‘Discussion’).
We also found high bioactivity in the developing meningeal barrier (Supplementary Table 6). STRING network and pathway analysis showed that the inner dura and arachnoid barrier shared expression of genes involved in IL-6-centred inflammation and fibrosis; PI3K/AKT, WNT and VEGFA/VEGFR2 signalling; axon guidance; EGF–IL-6–WNT5A-centred cancer pathways; and an IL-1β–FN1-centred immune network (Extended Data Fig. 6a). However, inner dura cells uniquely had a strong TNF and INS-central cytokine and growth factor signature (Fig. 5g).
Ontologies of shared inner dura and arachnoid barrier enriched genes included ‘Cell junction’ and ‘Anchoring junction’ (Supplementary Table 6). However, uniquely enriched genes in the inner dura represented ‘Extracellular matrix’ and ‘Secreted’, while the arachnoid barrier was enriched by ‘Transport of small molecules’ and ‘Active transmembrane transporter activity’ via solute carriers (Extended Data Fig. 6b). Therefore, the function of the meningeal barrier may also include those of inner dura cells.
Meningioma tumours are dura-like
Meningioma tumours are thought to arise from the meningothelial cells of the arachnoid (arachnoid cap and barrier cells) based on their histological similarities6. However, molecular evidence supporting the similarity of meningioma tumour cells to normal meningeal cell types is still lacking. To establish this, we re-analysed previously published single-cell and bulk RNA-seq data19, and generated new spatial transcriptomic data from seven meningiomas that we compared with our fetal datasets.
We processed ten sections from seven meningiomas (Supplementary Table 1) with spatial transcriptomics using the same gene panel as the fetal samples (Supplementary Table 3). To allow comparison with fetal meninges, we applied latent Dirichlet allocation (LDA) topic modelling44 to our scRNA-seq data from PCW 5–13 fibroblasts and perivascular cells (Fig. 6a and Extended Data Fig. 7a,b). Like clustering, LDA identifies topics—gene modules—that correspond to cell identities. In addition, it can reveal modules that are shared across cell types, such as cell cycle genes. We generated 35 topics (see details in the Methods) and identified those corresponding to the pia, arachnoid, PTGDS+ precursors, inner dura and dura (inner and outer) (Fig. 6a). We also identified one topic shared between arachnoid and inner dura cells; topic #20, ‘barrier’, with the junctional gene CDH1 appearing as one of the topic-defining genes (Extended Data Fig. 7c and Supplementary Table 7). To validate these inferred topic identities, we transferred the topics to fetal spatial transcriptomic data, validating topic activity to the corresponding anatomical layers of the meninges. As expected, the barrier topic #20 was active in both arachnoid and inner dura layers (Fig. 6b,c).
Fig. 6: LDA topic modelling in fetal meninges and meningioma tumours.
a, UMAP of fetal fibroblasts and perivascular cells (n = 13 samples), coloured by their LDA topic score, with topics annotated. Ar. prec., arachnoid precursor; iDura, inner dura; oDura, outer dura. b, PCW 9.5 spatial clusters (n = 1). Insets highlight clusters of meningeal layers. c, LDA topics transferred to fetal spatial data. Insets are the same as in b. d, LDA topics transferred to spatial data of grade 3 hypermitotic meningiomas M99, M73 and M89. e, Spatial clusters of tumours. Clusters were coloured by their most similar meningeal layer (for example inner dura-like cells were coloured cyan, as in b. f, Boxplots showing scores from LDA topic transfer to spatial data, from n = 7 meningiomas. Mann–Whitney U test with false discovery rate (FDR) multiple correction. *FDR <0.05, **FDR <0.01. FDR values for topics compared with topic 23: [topic 6] FDR = 0.0091, [topic 28] FDR = 0.0298, [topic 20] FDR = 0.0036, [topic 30] FDR = 0036, [topic 17] FDR = 0036. g, Stacked bar chart showing LDA topic scores transferred to bulk RNA-seq data from n = 185 meningiomas19, separated into three methylation profiles (grades I–III). h, Insets of M99 spatial clusters.
Source data
Having thus confirmed LDA topic specificity to meningeal layers, we next transferred the topics to spatial data from one grade I and six grade III tumours (Fig. 6d–f and Extended Data Fig. 7d). Although tumour cells are highly abnormal, we reasoned that the expression of normal gene programs might still reveal their underlying cell identity. As expected, the pia topic was nearly absent. More surprisingly, the arachnoid topic was also absent, and only M108 expressed an arachnoid precursor topic. Instead, the most highly activated topics were the inner dura, dura and barrier. Notably, in normal meninges, the barrier topic was shared between arachnoid and inner dura cells, but the absence of arachnoid topic activity in meningiomas argues strongly that tumour cells were not arachnoid, but dural. The presence of meningeal gene programs also informed our annotation of meningioma clusters (Fig. 6e and Extended Data Fig. 7e). Furthermore, we did not notice any SLC22A6 expression (arachnoid), while CDH1 (barrier) and SLC47A1 (inner dura) markers were clearly expressed. Consistently, where PTGDS was expressed, it was in non-arachnoid cells (Extended Data Fig. 7f,g). Notably, some tumour cells expressed periosteal, chondrogenic and cranial markers (MFAP5, COL2A1 and HHIP) (Extended Data Fig. 7g, dot plot, and Supplementary Table 4) and had a bone-like appearance with H&E staining (Extended Data Fig. 7g). Immunohistochemistry of tumours also confirmed cycling cells, vasculature, macrophages and lectin-positive non-vascular regions (Extended Data Fig. 7g). While cycling tumour cells expressed CDH1, CCN3, and SLC47A1, and were therefore inner dura-like, the only cycling cells in normal adult dura were vascular, and not dural fibroblasts (Extended Data Fig. 7h).
We also extended the LDA analysis to a previously published bulk RNA-seq dataset of 185 grade I–III meningiomas19 (Fig. 6g and Extended Data Fig. 7i). In agreement with our spatial data, these bulk datasets showed very low activity of pia and arachnoid topics. Instead, inner dura and dura topics dominated, followed by the barrier topic in hypermitotic and merlin-intact meningioma subtypes, and an osteogenic topic in immune-enriched meningiomas.
As a control, we generated LDA topics directly from the tumour spatial data, too, and transferred the tumour topics to fetal spatial data to validate layer resemblance (Extended Data Fig. 8a). Consistent with the above, all tumours contained a combination of topics resembling either barrier precursors, the inner dura, dura and/or chondrogenic and osteogenic populations. Only tumour M108 contained, in addition to dural topics, an arachnoid topic (Extended Data Fig. 8b,c and Supplementary Table 8), consistent with our results in Fig. 6f. Overall, these observations strongly suggest that meningiomas predominantly contain dura-like cells. It also raises the intriguing hypotheses that meningiomas (1) originating from arachnoid barrier cells later develop into dura-like cells and/or (2) could originate from dural cells, instead of, or in addition to, the arachnoid.
Furthermore, spatial visualization of cell type clusters, and a Banksy spatial domain analysis (Supplementary Table 9) showed that some tumours were highly spatially structured in a manner that resembled a jumbled version of dural and early cranial development, with vascular and immune cells interspersed (Fig. 6h and Extended Data Fig. 9). In other tumours, however, cells appeared mixed more uniformly (Fig. 6e and Extended Data Figs. 7e and 9).
The dura lineage expresses genes frequently mutated in meningioma
Further extending our analysis to a previously analysed scRNA-seq dataset of six meningiomas (grades I–III)19 (Fig. 7a), we found again that barrier, inner dura and dura topics dominated in separate clusters (Extended Data Fig. 10a–d). Notably, our ‘Dura-like meningioma’ overlapped with the previously annotated ‘ECM remodelling meningioma’, and a subset of pericytes were ‘pia-like’ (Fig. 7b and Extended Data Fig. 10a–d). By applying an improved karyotyper algorithm (Methods) to this scRNA-seq dataset, we found that most cycling cells were derived from tumour MSC6, which carried a distinct karyotype (chromosome 9, 12 and 15 gain) and lacked the typical chromosome 22 loss that was used to define tumour cells in the original publication (Fig. 7c and Extended Data Fig. 10e).
Fig. 7: Genetic analysis supporting a dura origin of meningioma tumours.
a, UMAP of pooled but not harmonized tumour cells and pericytes, coloured by samples (n = 6). Data from Choudhury et al.19. b, UMAP coloured by transferred annotations19, with additional annotations added in this study. Arach., arachnoid; iDura, inner dura; menO, meningioma. c, UMAP coloured by karyotype. d, Stacked bar chart showing the fraction of tumour cell types expressing enriched genes from adult meningeal layers (as in Fig. 4). Lane for immune cells not shown because we focused on tumour cells. e, Left: UMAP of fetal fibroblasts and perivascular cells, coloured by subclass. Right: UMAPs of fetal fibroblasts and perivascular cells and adult fibroblasts12, coloured by a gene-set score of the top 20 mutated genes in meningioma, minus TERT (https://cancer.sanger.ac.uk/cosmic/browse/tissue). f, Mutated gene-set score as in e quantified per fetal subclass. Stars indicate the same cells across e and f. CDP, committed dura precursor; CAP, committed arachnoid precursor; CPP, committed pia precursor. g, Schematic illustration of healthy meninges, and the proposed formation of meningioma tumours from dura cells.
Source data
The LDA topics above were defined on developing meninges, but tumours are found in postnatal brains. As an alternative indicator of cell identity, we used adult layer-specific genes (as in Fig. 4) and examined their expression in tumour cells. We found that, in each subtype of tumour cells, the dura score dominated. Arachnoid scores were very low, and pia scores were present in some cycling populations and pericytes (Fig. 7d).
As an independent line of evidence, we reasoned that both tumour suppressors and driver genes must be normally expressed in the cell of origin, before oncogenic transformation. We collected the 20 most frequently mutated genes in meningiomas, (omitting TERT; Methods; Extended Data Fig. 10h) and analysed their collective expression in normal fetal and adult meninges. Intriguingly, the cells with by far the highest expression of these putative meningioma cancer drivers were those of the dural lineage (Fig. 7e,f). To reduce the influence of common cancer driver genes shared with other cancer types, we repeated the analysis after removing genes commonly mutated also in glioblastoma, intestinal cancer or in pancreatic cancer (Supplementary Table 10). In each case, inner dura/dura and/or committed dura precursors remained the most enriched for expression of cancer drivers (Extended Data Fig. 10g–l). While future mechanistic data are necessary to establish a new model, these results lend further independent support to the possibility that meningioma tumours could arise from cells of the dural lineage (Fig. 7g).
