


Collection of clinical information and specimens
The study protocol was prepared in accordance with the Declaration of Helsinki and approved by the Kyoto University Graduate School and Faculty of Medicine Ethics Committee (Kyoto, Japan; certification numbers: R2163 and R2860). Clinical information was retrospectively obtained from electronic medical records, and archived clinical specimens collected with comprehensive consent at the time of collection were used. Patients were given the opportunity to opt out in accordance with Japanese guidelines.
Survival analysis of patients
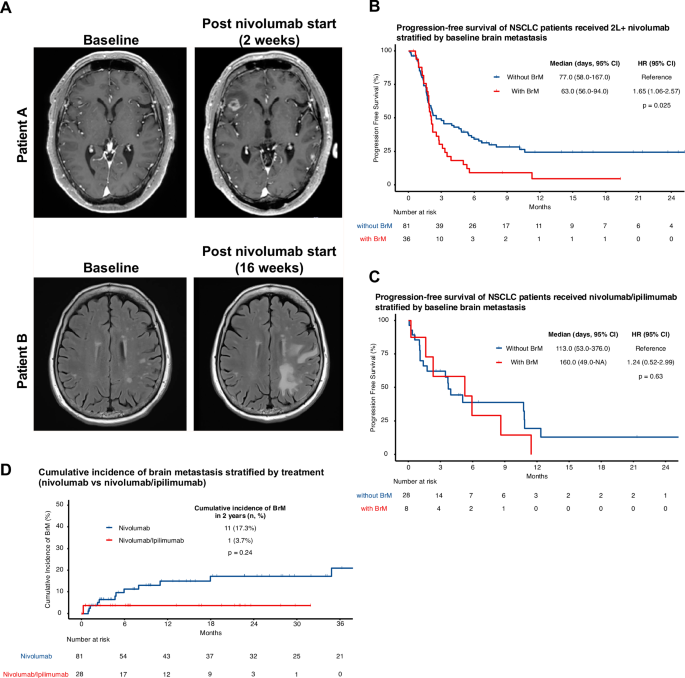
For the analysis of treatment outcomes in patients who received ICIs, we retrospectively enrolled patients with NSCLC who had received nivolumab (as second- or later-line palliative treatment between January 2016 and December 2017, as previously reported37) or nivolumab plus ipilimumab (with or without cytotoxic chemotherapy, regardless of treatment line, between January 2021 and March 2024). Patients with a history of multiple cancers or without radiographically measurable lesions were excluded. The index date was defined as the date of ICI initiation. Tumor response was evaluated according to Response Evaluation Criteria in Solid Tumors version 1.1 (RECIST v1.1) for overall response, and intracranial response was assessed on contrast-enhanced or non-contrast brain MRI according to RECIST v1.1, using up to two intracranial target lesions. To reduce potential confounding of intracranial response assessment by recent local therapy, patients who received brain-directed radiotherapy within 30 days prior to the index date were excluded from the response analyses. These patients were included in time-to-event analyses, including PFS and OS. Treatment-related adverse events were graded according to the Common Terminology Criteria for Adverse Events version 5.0 (CTCAE v5.0). Patients were stratified by the presence or absence of baseline BrMs, as assessed through medical records and radiological findings. Baseline BrM was defined as the presence of radiographically confirmed brain metastases on imaging between the diagnosis of NSCLC and the start of ICI therapy. PFS was defined as the time from ICI initiation to disease progression or death from any cause. Patients without progression or death were censored at their last follow-up visit. Overall survival (OS) was defined as the time from ICI initiation to death from any cause. Patients who survived were censored at the last follow-up visit. The data cutoff was July 31, 2024.
For the analysis of the cumulative incidence of BrMs, we included only patients without baseline BrMs from the above cohort. Cumulative incidence was estimated using the Kaplan–Meier method. The occurrence of BrMs was considered an event regardless of progression at other sites, and patients who died without BrMs were censored at the date of death, as described previously38. The data cut-off was July 31, 2024.
In the analysis of survival outcomes according to immune cell density in BrM, we retrospectively enrolled NSCLC patients with resected BrM between February 1, 2008, and December 31, 202139. As described in the immunohistochemical analysis of the BrM tissue microarray (TMA) section, we quantified the density of immune cells (CD8a+ immune cells as CTLs and FOXP3+ immune cells as Tregs). The densities were dichotomized into high- and low-infiltration groups using the median value as the cutoff point. Associations of the variables with OS were evaluated using Cox proportional hazards regression in both univariable and multivariable models. As the primary approach, CTL density was analyzed as a dichotomized variable (high vs. low, median cutoff). Univariable Cox models included age (≥75 vs. <75), sex, histology (squamous vs. non-squamous), driver alteration status, preoperative steroid use, completeness of BrM resection, and CTL infiltration group, Treg infiltration group. The multivariable Cox model included driver alteration status, preoperative steroid use, completeness of resection, and CTL infiltration group, based on clinical relevance and to limit model complexity given the sample size. As a sensitivity analysis, CTL density was additionally modeled as a continuous variable after log2 transformation (log2[CD8 density + 1]), and the same univariable and multivariable analyses were repeated. Survival analysis was performed using the Kaplan–Meier method. OS was defined as the time from BrM resection to death from any cause. Patients who survived were censored at the last follow-up visit. The data cutoff was July 31, 2024.
Public transcriptome analysis of paired specimens
Publicly available transcriptome datasets of paired primary NSCLC and BrM samples were analyzed. Data from GSE16111622 and the NSCLC subset of GSE24883023 were obtained from the Gene Expression Omnibus database. Raw data were normalized using quantile normalization and log2 transformation. Differential gene expression analysis between primary tumors and BrMs was performed using the limma package40, accounting for the paired sample design.
For principal component analysis (PCA) visualization, batch effects from patients were removed with the removeBatchEffect function, specifying tissue (primary vs. BrM) as the variable of interest to retain. Volcano plots were generated to visualize differentially expressed genes. Gene set variation analysis (GSVA) was performed using the GSVA package41, utilizing immune-related and MSigDB gene sets. Additionally, previously reported gene sets associated with TLS formation in NSCLC tissue were included in the GSVA analysis28,29 (Supplementary Data 2). For GSVA analyses, a fixed random seed was used to ensure reproducibility of the results and figures. Cell type deconvolution was performed using the immunedeconv package42 and the consensusTME algorithm24.
Immunohistochemical analysis of clinical specimens
We used archived formalin-fixed, paraffin-embedded (FFPE) tissue blocks of NSCLC BrM surgically removed between February 1, 2008, and December 31, 2021, along with corresponding paired lung primary specimens collected between February 1, 2003, and December 31, 2021. For most BrM samples, TMAs consisting of two 2 mm cores per sample were created. TMA preparation was performed after expert pathological review confirmed the NSCLC BrM diagnosis. Immunohistochemical staining was conducted on 4 μm sections from either whole FFPE blocks or TMAs.
Immunostaining was performed using the antibodies listed in Supplementary Data 1. Sections were incubated with horseradish peroxidase-conjugated secondary antibodies and visualized with 3,3′-diaminobenzidine substrates. Hematoxylin was used as a counterstain. The stained sections were digitally scanned and analyzed using QuPath version 0.5.0. Immune cells were classified using a pixel classifier (random trees) in QuPath. CD8+ or FOXP3+ immune cells were identified as CTLs and Tregs, respectively. The tumor tissue area was defined using H&E staining and used to calculate immune cell density (cells/mm2).
Evaluation of TLS formation in clinical specimens
TLS presence and density were assessed by consensus between two pathologists using hematoxylin and eosin (H&E)-stained sections. TLSs were defined as well-circumscribed, round-to-oval cellular aggregates composed mainly of lymphocytes and/or plasma cells. TLSs were counted within the tumor and in the surrounding region up to 1 mm from the tumor border. Lymphoid aggregates within normal lung tissue and separated from the tumor by intact parenchyma were excluded. TLS density was calculated as the number of TLSs per square millimeter of tumor area. Quantification of TLS formation based on H&E morphology was performed according to previously established criteria in the literature43,44. To further confirm TLS identity, representative TLS-positive primary tumors and BrMs were additionally evaluated by immunohistochemistry for CD3, CD20, CD21, PNAd, BCL6, and CCL21.
Mice
Six-week-old male B6J (C57BL/6J; Jackson Laboratory Japan, Inc., Yokohama, Japan; JAX stock no. 000664) and B6 Albino (B6N-Tyrc-Brd/BrdCrCrl; Jackson Laboratory Japan, Inc., formerly Charles River Laboratories Japan, Yokohama, Japan) were purchased and used in this study. The B6 Albino strain was identified by the supplier strain name B6N-Tyrc-Brd/BrdCrCrl. No noncommercial animal strains were used in this study. After acclimatization, the mice were used for experiments.
Mice were maintained under specific pathogen-free (SPF) conditions in a barrier facility at Kyoto University. Mice were housed under a 12-h light/dark cycle at controlled ambient temperature and humidity. Experimental and control animals were housed under the same conditions and were not bred separately. Where feasible, mice from different treatment groups were allocated from the same cages. Animals were randomly assigned to treatment groups. Investigators were blinded to group allocation during data collection and analysis, where applicable.
For tumor implantation, mice were anesthetized with a combination of midazolam, butorphanol, and medetomidine, and then recovered with atipamezole. For in vivo luminescence imaging, daily weight checks, or drug infusion, anesthesia was maintained with isoflurane.
For intracranial and lung tumor models, tumor size could not be measured externally. Tumor burden was therefore monitored by bioluminescence imaging at the indicated time points and by daily assessment of body weight, neurological symptoms, and general condition. Mice were euthanized if they lost more than 20% of their baseline body weight, developed neurological symptoms, showed severe distress, impaired mobility, or a moribund appearance. For subcutaneous tumors, tumor size was measured with calipers every 2–3 days, and the maximum tumor size permitted by the institutional animal protocol was 800 mm3. This limit was not exceeded in any experiment. Euthanasia was performed by cervical dislocation under deep anesthesia with medetomidine, midazolam, and butorphanol, or isoflurane, according to the approved animal protocol. All experiments were conducted in accordance with the humane endpoint criteria and maximum tumor burden limits approved by the Animal Research Committee of Kyoto University Graduate School of Medicine, and these limits were not exceeded. All animal experiments were approved by the Animal Research Committee of Kyoto University (ID: MedKyo19594, Medkyo20258, Medkyo21274, Medkyo22254, Medkyo23211, and Medkyo24244). All animal experiments were conducted in accordance with the approved protocols and ARRIVE guidelines.
Cell lines and fluorescence/luminescence tagging
CMT167 cells were purchased from ECACC (European Collection of Authenticated Cell Cultures; catalog no. EC10032302-F0), and LLC1 cells were purchased from ATCC (American Type Culture Collection; catalog no. CRL-1642). Antibodies and key reagents used in this study, including suppliers, catalog numbers, clones, and dilutions where applicable, are listed in Supplementary Data 1. To generate fluorescence/luminescence-tagged cell lines, the Precise Integration into Target Chromosome (PITCh) protocol45 was used to insert the CAG-mCherry-T2A-Akaluc cassette into the mouse safe harbor locus ROSA26. Briefly, the CAG-mCherry-T2A-Akaluc construct flanked by microhomology and a PITCh-universal target sequence was generated. A CRISPR-Cas9 plasmid containing dual sgRNAs targeting both the PITCh-universal sequence and the ROSA26-specific target sequence was also constructed. These plasmids were transfected into CMT167 and LLC1 cells using Lipofectamine® 3000 (Thermo Fisher Scientific) following the manufacturer’s instructions. After one week to allow stable knock-in and expression of the tagged construct, tagged cells were selected by flow cytometry and cloned using the limiting dilution method.
The pcDNA3 Venus-Akaluc plasmid was provided by RIKEN BRC through the National BioResource Project of MEXT (cat. RDB15781)46. The pX330S-2 was a gift from Takashi Yamamoto (Addgene plasmid # 58778)47.
Establishment of mouse BrMs (internal carotid artery injection)
Six-week-old male B6 Albino mice were used for BLI-based monitoring of the internal carotid artery injection BrM model. Six-week-old male B6J mice were used for tissue-based immunological analyses when indicated.
To mimic the natural metastatic pathway of human BrM while enabling accurate quantification of tumor burden and avoiding damage caused by direct intracranial injection, we employed an internal carotid artery (ICA) injection model by minor revision of previously reported methods48,49. In short, mice were anesthetized, the hair on the anterior neck was removed using a depilatory cream. Under clean conditions, an approximately 1-cm incision was made in the anterior neck, the left common carotid artery was exposed, and the left external carotid artery was ligated. A microcatheter was inserted into the left common carotid artery, and 1.0 × 10⁶ tumor cells suspended in 100–150 µL PBS were injected slowly into the left internal carotid artery over approximately 1 min. After injection, the left common carotid artery was ligated, and the wound was closed with VetBond Tissue Adhesive (3 M, St. Paul, MN, USA). Anesthesia was reversed with atipamezole. With an experienced operator, the procedure takes approximately 20 min per mouse. The success rate was approximately 90%, defined as recovery from anesthesia after injection, survival for 24 h, and suitable for subsequent experiments.
Treatment was initiated 7 days after injection (designated as day 0). To monitor tumor growth and lung metastasis, in vivo bioluminescence imaging (BLI) and body weight measurements were performed on days 3, 7, 14, and 21, with daily monitoring of general condition and neurological symptoms. A subset of mice was euthanized on day 7 for sample collection. Remaining mice were euthanized if they showed signs of distress, including >20% weight loss or neurological symptoms, as specified in the Mice section.
A known limitation of ICA delivery is that tumor cells can disseminate into the cerebrospinal fluid (CSF) space, resulting in meningeal involvement in addition to parenchymal lesions; therefore, histological assessment was performed to document the anatomical distribution of tumor growth.
Establishment of mouse BrM (local injection plus subcutaneous injection)
To evaluate the histology of bulk BrM, we simultaneously established a subcutaneous tumor in the same mouse to induce an adequate immune reaction against BrM, following several previous studies17,18,19. In brief, 6-week-old male B6J mice were anesthetized with medetomidine, midazolam, and butorphanol as described above. For BrM induction, 1.0 × 10⁵ mCherry-Akaluc-tagged CMT167 or LLC cells suspended in a 2:1 mixture of serum-free RPMI1640 medium and Matrigel (Corning, Corning, NY, USA) were stereotactically injected into the brain parenchyma, as previously described50. The cell suspension (1.5 µL) was slowly injected over at least 30 s using a Hamilton syringe (Hamilton Company, Reno, NV, USA). Concurrently, 5.0 × 10⁵ tumor cells prepared in the same serum-free medium/Matrigel suspension were injected subcutaneously into the right flank of the same mouse. Treatment was initiated 7 days after tumor cell injection (designated as day 0). Body weight, neurological symptoms, general condition, and subcutaneous tumor growth were monitored daily. Subcutaneous tumor size was measured with calipers every 2–3 days, and mice were euthanized before reaching the maximum tumor size permitted by the approved animal protocol. The mice were euthanized on day 7 of treatment for subsequent histological evaluation of BrMs.
Establishment of mouse primary lung cancer (tail vein injection)
To establish a primary lung cancer model, tumor cells were injected into the tail vein. Six-week-old male B6J or B6 Albino mice were anesthetized with medetomidine, midazolam, and butorphanol as described above. Luminescence-tagged CMT167 or LLC cells (1.0 × 10⁶) suspended in 200 µL PBS were injected into the lateral tail vein using a 27 G needle. Treatment was initiated seven days after injection (day 0). To monitor tumor growth and metastatic burden in the lungs, in vivo BLI and body weight measurements were performed on days 3, 7, 14, and 21, with daily monitoring of general condition and respiratory or neurological symptoms. A subset of mice was euthanized on day 7 for sample collection. The remaining mice were euthanized as described previously.
In vivo luminescence imaging
In vivo BLI was performed using an IVIS Lumina II system (Caliper Life Sciences, Hopkinton, MA, USA) on specific days for tumor monitoring. Mice were anesthetized with isoflurane as described above. To achieve stable and strong luminescent signals, TokeOni (FujiFilm Wako, Osaka, Japan) was suspended in PBS and administered intraperitoneally at 1 mg/kg. Ten minutes after injection, images were captured with an exposure time of 10 s. Regions of interest (ROIs) were manually drawn based on anatomical landmarks in the bright-field image, without visualizing the bioluminescent signal. ROIs were defined as circles with diameters of 1 cm for the head and 3 cm for the chest. Bioluminescence signals within the ROIs were quantified as photons/s using Living Image software (Caliper Life Sciences).
Flow cytometry analysis
Mice were deeply anesthetized with medetomidine, midazolam, and butorphanol as described above and transcardially perfused with ice-cold PBS to remove circulating blood cells. The left cerebrum was harvested after perfusion, minced with a razor blade, and incubated in a dissociation buffer consisting of RPMI 1640 medium (Gibco, Thermo Fisher Scientific, Waltham, MA, USA), collagenase IV (1 mg/mL; Sigma-Aldrich, St. Louis, MO, USA), and DNase I (0.05 mg/mL; Sigma-Aldrich). Single-cell suspensions were obtained by enzymatic and mechanical dissociation using the GentleMACS dissociator (Miltenyi Biotec, Bergisch Gladbach, Germany). The enzymatic reaction was halted by adding EDTA solution. The cell suspension was filtered through a 70 µm cell strainer (Greiner Bio-One, Kremsmünster, Austria) and centrifuged. Debris was removed by density gradient centrifugation with 36% Percoll (GE Healthcare, Chicago, IL, USA). Red blood cells were lysed with RBC lysis buffer (Roche, Basel, Switzerland). Cells were stained for viability with FVS780 (BD Biosciences, Franklin Lakes, NJ, USA), followed by surface marker staining. After fixation and permeabilization with Foxp3/transcription factor fixation/permeabilization concentrate and diluent (eBioscience, San Diego, CA, USA), intracellular staining was performed. Antibodies are listed in Supplementary Data 1. Compensation was performed using CompBeads software (BioLegend). Flow cytometry was conducted on an LSRFortessa (BD Biosciences), and data were analyzed using OMIQ software (OMIQ, Inc., Santa Clara, CA, USA).
Immunofluorescence analysis
Mice were deeply anesthetized with medetomidine, midazolam, and butorphanol as described above, and then transcardially perfused with PBS followed by fixation with 4% paraformaldehyde (PFA) in PBS. The left cerebrum was dissected and post-fixed in 1% PFA/PBS overnight at 4 °C. Tissues were cryoprotected overnight in 30% sucrose in PBS at 4 °C, embedded in optimal cutting temperature compound (Sakura Finetek, Torrance, CA, USA), and rapidly frozen in liquid nitrogen-cooled isopentane. Frozen sections (7 µm) were cut using a Leica CM3050S cryostat (Leica Biosystems, Wetzlar, Germany). Sections were washed with PBS and blocked with PBS containing 0.3% Triton X-100 (Sigma-Aldrich), 1% bovine serum albumin (BSA; Sigma-Aldrich), and 1% mouse Fc Block (BioLegend, San Diego, CA, USA). Immunostaining was performed using fluorophore-conjugated antibodies (Supplementary Data 1) diluted in blocking buffer. Nuclei were counterstained with Hoechst 33342 (Dojindo, Kumamoto, Japan). Sections were mounted with ProLong™ Gold Antifade Mountant (Invitrogen, Thermo Fisher Scientific, Waltham, MA, USA) and imaged with a BZ-X710 all-in-one fluorescence microscope (Keyence, Osaka, Japan).
To measure CTL density, CD8a-positive cells were manually counted in captured images. The area of mCherry-labeled tumor tissue was measured using Fiji software (ImageJ, NIH, Bethesda, MD, USA). CTL density was calculated as the number of CD8a-positive cells per square millimeter of the mCherry-positive tumor area.
The t-CyCIF method was used for multiplexing51,52. Briefly, sections underwent iterative cycles of staining, imaging, and signal bleaching. In each cycle, sections were incubated with primary antibodies directly conjugated to Alexa Fluor 488 or Alexa Fluor 647 (Supplementary Data 1). Nuclei were counterstained with Hoechst 33342. Sections were mounted with Fluoromount-G (Southern Biotech) for imaging with a BZ-X710 microscope (Keyence). After imaging, coverslips were gently removed by immersing slides in PBS. Fluorophores were inactivated by incubating sections in hydrogen peroxide (H2O2)– and sodium hydroxide (NaOH)-based bleaching buffers under light for 30 min. This cycle of staining, imaging, and bleaching was repeated for all antibodies in the panel. Finally, images from all cycles were registered and aligned using the publicly available PystackReg library (version 0.2.8) in Python, using the Hoechst 33342 nuclear signal as a fiducial marker for accurate overlay of multiplexed images.
Single-cell RNA sequencing (scRNA-seq) library preparation and sequencing
Single-cell suspensions were prepared from the left cerebrum of mice as described in the flow cytometry section. To obtain sufficient cells for single-cell RNA sequencing (scRNA-seq), suspensions from 3 to 4 mice were pooled for each treatment condition. Cells were fixed with 4% formaldehyde according to the manufacturer’s protocol (10× Genomics, Pleasanton, CA, USA). Libraries were generated using the 10× Genomics Chromium Single Cell Gene Expression Flex Kit (10× Genomics) following the manufacturer’s instructions. Library preparation and sequencing were performed at the Research Institute for Microbial Diseases, Osaka University (Suita, Osaka, Japan). Sequencing was conducted on an Illumina NovaSeq using 150 bp paired-end reads.
Single-cell RNA sequencing (scRNA-seq) data analysis
Raw sequencing data were processed with the Cell Ranger pipeline (10× Genomics) to align reads to the mouse reference genome (mm10) and generate a gene-barcode matrix. Data analysis was performed using the Seurat R package (version 5.1.0).
Low-quality cells and doublets were removed before normalization and scaling, and highly variable genes were identified. Dimensionality reduction was performed using principal component analysis (PCA), followed by clustering and visualization with uniform manifold approximation and projection. Major cell types, including T cells, myeloid cells, and tumor cells, were identified and annotated based on canonical marker gene expression. T cells were subsequently re-clustered for higher-resolution analysis. DEGs were identified between clusters and treatment groups within the CTL cluster. To further characterize T cell states, we calculated signature scores for terminally exhausted T cells (Tte), progenitor exhausted T cells (Tpe), and T follicular helper (Tfh) cells using previously published gene sets53 and known marker genes of Tfh cell development30,31. Gene Ontology (GO) enrichment analysis was performed on DEGs to identify enriched pathways. For GO enrichment analyses, a fixed random seed was used to ensure reproducibility of the results and figures. Additionally, T cell states were classified using ProjecTILs32, a reference-based classification method.
Statistical analysis
No formal statistical method was used to predetermine sample size. Sample sizes were chosen based on previous studies using similar mouse tumor models, preliminary experiments, and feasibility considerations, while ensuring sufficient biological replicates to assess reproducibility and treatment effects. For animal experiments, group sizes were selected to be comparable to those commonly used in preclinical immunotherapy studies and were sufficient to detect consistent treatment-associated differences across independent experiments. For clinical and public transcriptomic analyses, all eligible samples meeting the predefined inclusion criteria were included.
Statistical analyses were conducted using R software (version 4.4.2) and GraphPad Prism (version 10.4.2; GraphPad Software, Boston, MA, USA). Survival curves were estimated by the Kaplan–Meier method, with differences assessed using the log-rank test. Continuous variables were compared between two groups using Student’s t test or the Mann–Whitney U test, depending on data distribution. For multiple group comparisons, ANOVA or the Kruskal–Wallis test followed by appropriate post hoc tests was applied. Categorical data were analyzed using the chi-squared test or Fisher’s exact test. Statistical significance was defined as P < 0.05. The specific statistical tests used are detailed in the figure legends or Results section.
Reporting summary
Further information on research design is available in the Nature Portfolio Reporting Summary linked to this article.
