


Study design and population
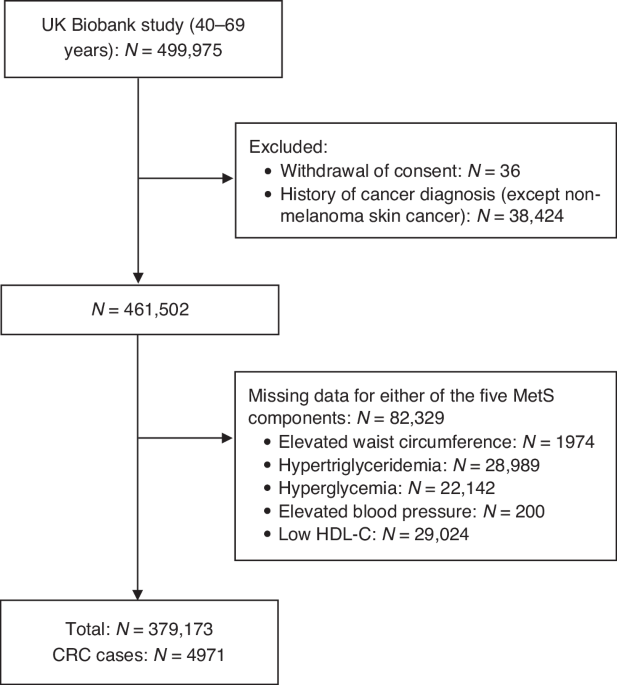
This study was based on a large-scale, population-based prospective cohort derived from the UK Biobank, which recruited over 500,000 participants aged 40–69 years between 2006 and 2010. The details have been previously documented [7]. In brief, participants were enroled from 22 assessment centres across England, Scotland, and Wales and underwent comprehensive baseline assessments, including questionnaires, physical measurements, and biological sample collection. Longitudinal follow-up of participants was conducted through linkage with electronic health records, enabling continuous tracking of various health outcomes including cancer incidence. Ethical approval for the UK Biobank study was obtained from the North West Multi-Centre Research Ethics Committee (11/NW/0382). All participants provided written informed consent prior to enrolment. Individuals with a prior cancer diagnosis (except for non-melanoma skin cancer) or missing data on MetS components were excluded from the current analysis. This study adhered to the Strengthening the Reporting of Observational Studies in Epidemiology (STROBE) reporting guideline [8].
Assessment of MetS
MetS was defined according to established criteria [3], incorporating five metabolic abnormalities: elevated waist circumference (≥102 cm in males and ≥88 cm in females for European populations), hypertriglyceridemia (≥1.7 mmol/L), hyperglycaemia (glycated haemoglobin (HbA1c) ≥ 42 mmol/mol, or antidiabetic medication use), elevated blood pressure (systolic ≥130 mmHg, diastolic ≥85 mmHg, or antihypertensive medication use), and low HDL-C (<1.03 mmol/L in males, <1.29 mmol/L in females, or lipid-modifying medications) (Table S1). For hyperglycaemia, because the UK Biobank study did not require fasting before blood glucose measurement, we used the more stable indicator of HbA1c, with a cutoff of ≥42 mmol/mol to define impaired glucose regulation [9, 10].
Lipid-modifying medications can influence multiple aspects of the lipid profile, including HDL-C and triglycerides [11]. To mitigate potential redundancy in classification, these medications were categorised under the reduced HDL-C group. The use of these medications was determined through Anatomical Therapeutic Chemical (ATC) codes, referencing an extensive review of prior studies that defined MetS using ATC classifications [10, 12,13,14]. A diagnosis of MetS was assigned when at least three of these criteria were met.
Outcomes
Incident CRC cases were identified through linkage to national cancer registries and hospitals, using International Classification of Diseases, 10th Revision (ICD-10) codes C18–C20. Follow-up data for cancer incidence were accessible through national cancer registries until July 31, 2019, for England, December 31, 2016, for Wales, and October 31, 2015, for Scotland. CRC cases diagnosed beyond these respective registry censoring dates were captured through hospital episode statistics, which remained available until September 30, 2021, for England and July 31, 2021, for Scotland. In Wales, complete diagnostic records were only obtainable up to March 31, 2016, preceding the registry data cutoff date.
Covariates
During baseline evaluations, comprehensive covariate data were collected through standardised protocols. Demographic variables included age (continuous variable), self-reported ethnicity (categorical: White, Other), and socioeconomic status measured by the Townsend deprivation index (continuous). Educational attainment was classified as an ordinal categorical variable (higher academic/professional, lower academic/vocational, no formal qualifications). Lifestyle factors comprised smoking status (categorical: never, former, current), alcohol consumption frequency (categorical: never, special occasions only, 1–3 times/month, 1–2 times/week, 3–4 times/week, daily or almost daily), and physical activity levels (categorical: low, moderate, high based on international physical activity questionnaire (IPAQ) [15]. Dietary variables included daily fruit intake (continuous, pieces/day) and vegetable consumption (continuous, tablespoons/day), along with red/processed meat intake (categorical: never, less than once a week, once a week, ≥2 times a week). Medical covariates were all categorical: CRC screening history (binary), family history of CRC in first-degree relatives (binary), and regular use of non-steroidal anti-inflammatory drugs (NSAIDs) or aspirin (binary).
Statistical analysis
In the UK Biobank, incident early-onset CRC cases were too few for meaningful analysis [16]. As the aim of the present study was not to address early-onset colorectal cancer specifically, an age cutoff of 60 years was selected to ensure adequate power and precision. This cutoff balanced the numbers of participants and CRC events across comparison groups, a prerequisite for adequate power to assess interaction.
Accordingly, four subgroups were defined based on sex and the 60-year cutoff: younger males (age <60 years), older males (age ≥60 years), younger females (age <60 years), and older females (age ≥60 years), and conducted stratified analyses accordingly. Baseline characteristics were summarised using means (standard deviations) for continuous variables and proportions for categorical variables. Group comparisons were conducted using Pearson’s Chi-squared test or Kruskal-Wallis rank sum test as appropriate.
To describe the distribution of MetS biomarkers, we assessed the sex- and age-stratified prevalence of MetS and its individual components. Age was grouped in 5-year intervals, and the prevalence of MetS and its components was examined across these age categories separately for males and females to evaluate sex-stratified age trends. Furthermore, we explored the variations in the number of metabolic abnormalities by sex-by-age stratification to depict how the accumulation of metabolic abnormalities differed across demographic subgroups.
Multivariable Cox proportional hazards models were employed to estimate hazard ratios (HRs) and 95% confidence intervals (CIs) for the association between MetS and CRC risk. Proportional hazards assumptions were verified using Schoenfeld residuals. All models adjusted for the full range of measured covariates, with additional adjustment for sex in the overall population analyses. To quantify the contribution of MetS to CRC risk, we calculated population attributable fractions (PAFs) with 95% CIs using Eide and Gefeller’s method [17], maintaining covariate consistency with the HR calculation. The adjusted PAFs were derived through logistic regression by systematically permuting the entry order of risk factors, with final estimates representing the mean values from all possible combinations computed using the ‘averisk’ R package, which generated CIs via Monte Carlo simulation [18].
To examine potential heterogeneity by tumour subsite, stratified analyses were performed for proximal colon, distal colon, and rectum, separately. Similarly, stratified analyses by family history of CRC in first-degree relatives were conducted. Sensitivity analyses were performed by excluding the first 1, 2, 3, and 4 years of follow-up, respectively, to minimise reverse causality [19].
We also examined the association between the number of metabolic abnormalities (ranging from 1 to 5, with 0 as the reference) and CRC risk, and tested for linear trends across categories to evaluate a potential dose–response relationship. To explore the individual contributions of each component, Cox models were constructed by entering each MetS component separately. Interaction terms between MetS and sex, age group (<60 vs. ≥60 years), and their combinations were tested in fully adjusted models to assess potential modification associations. Post-hoc power analyses were conducted to assess whether the sample size was sufficient to detect these interactions.
Moreover, we evaluated the potential nonlinear associations between six continuous variables (derived from five MetS components: waist circumference, triglycerides, HbA1c, systolic blood pressure, diastolic blood pressure, and HDL-C) and CRC risk across four stratified subgroups. Values below the 1st percentile or above the 99th percentile were treated as outliers and excluded from the analysis [10]. Restricted cubic spline (RCS) models were used to explore nonlinear patterns, using the median of each variable as the reference point and adjusting for all relevant covariates.
All statistical procedures were conducted in R software (version 4.4.1). Missing covariate data were imputed using the multiple imputation technique via the mice package. We generated five imputed datasets, whose results were subsequently pooled. Statistical significance was defined as two-sided P < 0.05.
