


Inhibitors for in vitro and cell-based assays were obtained as follows: ponatinib (MedChemExpress (MCE), HY-12047); asciminib (MCE, HY-104010); imatinib (MCE, HY-15463); dasatinib (MCE, HY-10181); osimertinib (MCE, HY-15772); and RMC-5552 (MCE, HY-132168). DasatiLink-1 and asc-tracer were obtained from the same batches as previously described14,34. DAS-DFGO-II and DAS-CHO-II were provided by M. Soellner. Das-tracer44 was provided by Promega. Synthesis and characterization of all other compounds are described in Supplementary Note 1. All compounds were stored at −20 °C as solids or stock solutions in DMSO.
Cell culture
All cells were cultured in humidified incubators at 5% CO2 and 37 °C on tissue-culture-treated plasticware. Cells were counted using a Countess II FL automated cell counter (Thermo Fisher Scientific) or manually using a haemocytometer. Cell lines were used directly from ATCC without further authentication, except that HEK293T cells were authenticated by STR testing. HUVECs were used directly from ATCC without mycoplasma testing. HEK293T cells tested negative for mycoplasma before use. K562 cells periodically tested negative for mycoplasma, including K562 PL2R tumour-derived cells. Other cell lines were not tested for mycoplasma during this work.
All K562 cell lines were cultured in RPMI 1640 medium with l-glutamine (Gibco 11875119) and 10% heat-inactivated fetal bovine serum (FBS, Axenia Biologix or Atlas Biologicals) and were passaged every 2–3 days generally by simple dilution into fresh complete medium or, if the medium seemed acidified, by centrifuging (300g, 3 min), aspirating medium and resuspending in fresh medium. Cell density was maintained between 5 × 10⁴ and 1 × 10⁶ cells per ml.
K562 wild-type cells were obtained from the American Type Culture Collection (ATCC, CCL-243). K562 stable cell lines were generated as follows: mutations in the pUltra BCR::ABL1 vector were generated using KLD Enzyme Mix (NEB M0554S) with KOD Xtreme Hot Start DNA Polymerase (Sigma-Aldrich 71975-M). Mutations were confirmed by Sanger sequencing (Azenta) and whole-plasmid sequencing (Plasmidsaurus). The pUltra BCR::ABL1 plasmids used in this work are available from Addgene as 210432 (wild type), 210433 (E255V mutation), 210434 (T315I mutation), 210435 (V468F mutation), 210436 (E255V/T315I mutation), 210437 (T315M mutation), 210438 (E255V/V468F mutation), 210439 (T315I/V468F mutation), 210440 (E255V/T315I/V468F mutation) and 210441 (T315M/V468F mutation). Lentivirus was generated as previously described67,68. In brief, 1 × 10⁶ HEK293T cells were transfected with 5 μg pUltra BCR::ABL1 and 1 μg of each lentiviral helper plasmid (TAT, GAG-POL, VSV-G and REV) using calcium phosphate supplemented with DEAE dextran in a 6-well plate, and medium was changed to RPMI 1640 after 1 day. Next, 3 × 10⁵ K562 cells were seeded in a 6-well plate and infected with lentivirus at low multiplicity of infection (<0.3) so that most cells would have a single lentiviral integration event. Five days after infection, a pure population of K562 pUltra EGFP-only control and pUltra wild-type BCR::ABL1 cells was selected by sorting on eGFP by the Penn State Flow Cytometry Core Facility on a Beckman Coulter MoFlo Astrios EQ cell sorter. K562 pUltra BCR::ABL1V468F cells were selected using 100 nM asciminib until >95% of the cells were eGFP-positive. All other K562 pUltra BCR::ABL1 mutants were selected by 1 μM imatinib until >95% of the cells were eGFP-positive. eGFP signal and density were determined using a BD Accuri C6 Plus with standard filter settings. All mutant lines were allowed to recover for at least 3 days after drug selection before use in viability assays.
K562 BCR::ABL1T315I base-edited BE-T315I cells were generated as previously described69. In brief, 5 × 10⁶ K562 wild-type cells were electroporated in a Lonza 4D-Nucleofector X unit with 5 μg Lenti sgABL1_T315I (sgRNA gTCACTGAGTTCATGACCTAC, cloned into Addgene, plasmid 104991) and 5 μg pSI-625 TargetACEmax (Addgene, plasmid 139105) in Chicabuffer 2 M. After 3 days of recovery in complete medium, these electroporated cells were selected in 1 μM imatinib for 2 weeks. gDNA was purified using a Monarch Genomic DNA Purification kit (NEB, T3010L). Exon 6 of ABL1 was amplified using KOD Hot Start polymerase (Sigma-Aldrich 71842) and primers (forward: TCTCAGGATGCAGGTGCTTG; reverse: TGAGTGGCCATGTACAGCAG) designed by Primer-BLAST70. Sanger sequencing was performed by the Penn State Genomics Core Facility using the forward amplification primer. Sanger sequencing confirmed the T315I mutation (from ACT to ATT) at a proportion of approximately 31% and a silent mutation at position 314 (from ATC to ATT) at a proportion of approximately 55%, as estimated by EditR (v1.0.10)71 (Supplementary Data 1). We note that parental K562 cells have genomic amplification of the BCR::ABL1 allele72,73, so these proportions probably represent multiple but incomplete edits of the population of BCR::ABL1 alleles.
HUVECs were obtained from the ATCC (CRL-1730) and cultured in F-12K medium (ATCC 30-2004) with 10% FBS (Gibco 10082147), 0.1 mg ml–1 heparin (Sigma-Aldrich H3393) and 0.03 mg ml–1 endothelial cell growth supplement (Corning 354006). Plasticware was prepared by coating with gelatin (Sigma-Aldrich G9391) as follows: a 2% gelatin solution was added to plates (for example, 0.5 ml for a 6-well plate well) and plates were dried ≥30 min at 37 °C. HUVECs were passaged after reaching 70–80% confluence by washing with PBS, detaching with 0.25% trypsin and washing gently with complete medium before diluting to split 2–3-fold.
HEK293T cells were obtained from the ATCC (CRL-3216) and cultured in DMEM with glucose, glutamine and pyruvate (Corning 10-031-CV), 10% FBS (Avantor 97068-085) and antibiotic–antimycotic (Corning 30-004-CI). Cells were passaged every 2–3 days by washing with PBS (Corning 21-040-CV), detaching with 0.25% trypsin (Corning 25-053-CI) and washing with complete medium before splitting to maintain confluence between 10 and 90%.
A549 cells were obtained from the ATCC (CCL-185) and cultured in DMEM, glucose, glutamine and pyruvate (Gibco 11995065) with 10% FBS (Atlas Biologicals) and 1% penicillin–streptomycin (Gibco 15140-122), and handled as for HEK293T cells.
H1975 cells were obtained from the ATCC (CRL-5908) and cultured in RPMI 1640 with l-glutamine (Gibco 11875093), 10% FBS (Atlas Biologicals) and penicillin–streptomycin (Gibco 15140122), and handled as for HEK293T cells.
In-cell NanoBRET affinity assays
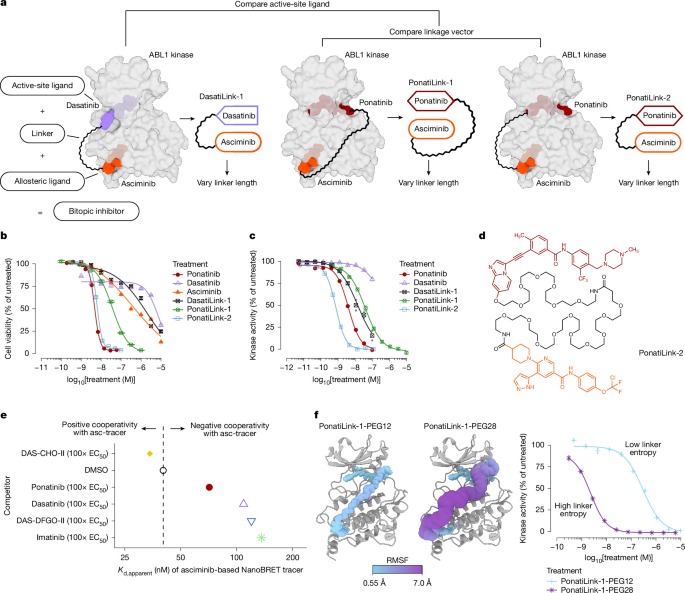
NanoLuc–ABL1 (full-length ABL1, NLuc–ABL1, Promega NV1011) was transfected into HEK293T cells using FuGENE HD (Promega E2311). Cells were plated into 384-well plates (Corning) at a density of 2 × 10⁵ cells per ml in DMEM (Corning 10-031-CV) without FBS and allowed to recover for 24 h. In tracer EC50 experiments, serially diluted tracer compound was added to cells. In unlabelled compound affinity experiments, serially diluted compound was added to cells in addition to tracer compound at the tracer EC50 value previously measured for NLuc–ABL1. In tracer competition-binding experiments, the serially diluted tracer compound was added to cells in addition to unlabelled compound dosed at 100× the largest observed EC50 value across independent affinity experiments with the dasatinib-based tracer. Following addition of tracer compound and/or unlabelled compound in all experiments, cells were equilibrated at 37 °C and 5% CO2 for 2 h. BRET signals were then recorded using NanoBRET NanoGlo Substrate and Extracellular NanoLuc Inhibitor (Promega, 2160) on a Synergy Neo2 plate reader (Agilent BioTek). The average BRET ratio of the no-tracer background control was subtracted from the BRET ratio of the associated condition, and data were fit with the doseplotr R package as for other dose–response data. Apparent compound affinities with das-tracer were measured with tracer at its EC50 concentration. Asciminib, DAS-DFGO-II and DAS-CHO-II affinity measurements were obtained over two independent experiments; the largest observed EC50 value between independent experiments was used for 100× EC50 calculations.
MD simulations and analysis
Initial structures for the ABL1 kinase domain (residues 255–531) in complex with ligands (asciminib, ponatinib and nilotinib) were taken from the bound forms (PDB identifiers 5MO4 and 3OXZ). Ponatinib (PDB identifier 3OXZ) was transplanted into the asciminib–nilotinib-bound structure (PDB identifier 5MO4) in place of nilotinib after backbone alignment. AlphaFold3 (ref. 74) was used to generate a complete template of ABL1, which was then used with MODELLER75 to fill in unresolved regions of the experimentally determined structures. Linker placement and construction were performed in MODELLER using glycine residues as a proxy for the PEG unit, with anchor points defined at the attachment points of the PEG linker. The PEG linker coordinates were mapped out onto the glycine peptide at a 1:1 ratio, and the experimentally determined poses of the respective ligands were extracted from the crystal structures. Parameterization of compounds was performed using the antechamber module of Amber24 with the GAFF2 forcefield76, using the AM1-BCC charge model77 and a path length of 30. The final bound ABL1 complexes, and the compounds alone, were prepared using tleap from Amber24. The systems were solvated using the TIP3P water model78 with the Amber19_SB forcefield79, and neutralized with Na+ and Cl– ions in an isometric octahedral box with a minimum distance of 15 Å from the nearest edge. Ion concentrations were subsequently adjusted to mimic experimental buffer conditions (0.14 M K+, 0.01 M Na+ and 0.15 M Cl−).
Simulations were performed stepwise. First, each system was energy-minimized for 2,500 steps using the steepest-descent method, followed by 2,500 steps of conjugate gradient with constraints (100 kcal mol–1 Å–2) on all non-solvent atoms. Second, the constraints were released on all atoms, and the system was further minimized for 10,000 steps each of the steepest-descent and conjugate gradient methods. The systems were heated to 300.0 K over 100 ps with a Langevin thermostat in the NVT ensemble with constraints (50 kcal mol–1 Å–2) applied on non-solvent atoms. Pressure was maintained at 1 atm with an MC barostat, with a collision frequency of 5 ps−1. Third, positional restraints were slowly released and densities were equilibrated over the course of 500 ps in the NPT ensemble at a temperature of 303.15 K and pressure conditions of 1 atm. Finally, unrestrained production simulations in the NPT ensemble were run for 500 ns for each system in triplicate, 1.5 μs total per compound. All calculations were carried out using an integration step of 2 fs. The SHAKE algorithm was applied to all hydrogen-containing bonds. MD simulations were conducted using the pmemd engine, with CUDA acceleration80.
For each production trajectory, the AmberTools cpptraj module81 was used to calculate root mean square deviation and RMSF values to monitor system equilibration and to assess local flexibility of the compounds, respectively. Atomwise RMSF maps for all compounds, generated as in Fig. 1f, are provided in Supplementary Data 2.
Triplicate simulations were initially performed for each compound. During some simulations, one of the affinity ligands was observed to exit its binding site. This occurred for one of the three initial simulations for each of PonatiLink-1-PEG12, PonatiLink-2-PEG13 and PonatiLink-2-PEG17 (3 out of 33 total initial simulations). These simulations were excluded and additional simulations were performed to replace them, with the goal of comparing linker behaviour while both ligands remained bound. For PonatiLink-2-PEG13 and PonatiLink-2-PEG17, the first subsequent simulation did not demonstrate unbinding; therefore, the data presented are from simulation runs 1, 2 and 4. For PonatiLink-1-PEG12, three additional simulations failed to produce 0.5 μs of sustained binding behaviour; therefore, data presented are from only the first two initial simulations. The total simulation time across systems was 19 μs, with 16 μs of non-excluded simulation time. The entropy of the bound bitopic compounds was calculated using quasi-harmonic analysis82 in cpptraj at a temperature of 300 K, using only the compound atoms.
Correlations between mean linker RMSF and entropy per atom across simulations were assessed using Pearson’s correlation coefficient (two-sided test) and reported as the coefficient of determination (R2). Chai-1 (ref. 83) was used to predict the binding pose of RO7304898 shown in Fig. 2a.
Recombinant EGFR expression
EGFR kinase domain (residues 666–1,022) was codon-optimized, synthesized by Twist Bioscience and cloned into the pFastBac vector using the Gibson Assembly method, which produced an amino-terminal 6×His tag and TEV protease cleavage site (ENLYFQG). The entire construct sequence was as follows: MSYYHHHHHHDYDIPTTENLYFQGAMGEAPNQALLRILKETEFKKIKVLGSGAFGTVYKGLWIPEGEKVKIPVAIKELREATSPKANKEILDEAYVMASVDNPHVCRLLGICLTSTVQLITQLMPFGCLLDYVREHKDNIGSQYLLNWCVQIAKGMNYLEDRRLVHRDLAARNVLVKTPQHVKITDFGLAKLLGAEEKEYHAEGGKVPIKWMALESILHRIYTHQSDVWSYGVTVWELMTFGSKPYDGIPASEISSILEKGERLPQPPICTIDVYMIMVKCWMIDADSRPKFRELIIEFSKMARDPQRYLVIQGDERMHLPSPTDSNFYRALMDEEDMDDVVDADEYLIPQQG.
His-TEV-tagged protein was captured using Ni-NTA resin (Thermo Fisher, 88222, 2 ml slurry per litre of culture) at 4 °C for 1 h with constant end-to-end mixing. The loaded beads were then washed with lysis buffer (20 mM Tris pH 8, 500 mM NaCl, 5% glycerol, 1 mM TCEP and 20 mM imidazole) and the protein was eluted with elution buffer (20 mM HEPES pH 8.0, 500 mM NaCl, 5% glycerol and 300 mM imidazole). His-tagged TEV protease (0.025 mg TEV per mg EGFR protein) was then added to the protein solution. The mixture was diluted 1:10 v/v with no salt buffer (20 mM HEPES pH 8.0 and 5% glycerol) and further purified by anion exchange chromatography (HiTrapQ column, Cytiva, 17115301) using a NaCl gradient of 50 mM to 500 mM in no salt buffer. Fractions containing pure EGFR protein were pooled, concentrated and flash-frozen in liquid nitrogen.
Detection of covalent modification of EGFR by whole-protein mass spectrometry
Test compounds were prepared as 100× stock solutions in DMSO. Compounds were diluted with SEC buffer (20 mM HEPES pH 8.0, 150 mM NaCl and 1 mM MgCl2) to prepare a 2× stock. Recombinant EGFR kinase domain protein was diluted with SEC buffer to 2 μM. Compound solution was mixed with the EGFR protein solution 1:1 (v/v), giving final concentrations of 1 μM EGFR kinase domain and 10 μM compound. The extent of modification was assessed by electrospray mass spectrometry using an Agilent Technologies 6545XT AdvanceBio LC/Q-TOF coupled to an Agilent 1290 Infinity II LC HPLC equipped with a ZORBAX RRHD Eclipse Plus C18 1.8 μm column (Agilent, 959757-902). The mobile phase was a linear gradient of 10–98% acetonitrile–water and 0.05% formic acid. Injection time stamps were used to calculate elapsed time. Time courses were fitted to a one-phase association model in GraphPad Prism (v11.0.2).
Cell viability assays
Cells were seeded on white, opaque, tissue-culture treated 96-well plates (Greiner Bio-One 655083 or Corning 3917) in the central 60 wells of the plate, with border wells filled with 200 μl sterile PBS or water. Cells were seeded in 90 μl complete medium, then allowed to recover overnight. Cells were treated in triplicate with 10 μl of 10× stocks of serial dilutions of compounds (10 conditions including DMSO control, changing pipette tips with each dilution), with a single pipette up and down to mix the suspension cells. In the case of A549 and H1975 cells, compound dilutions were prepared with a Tecan D300e liquid dispenser. Cells were incubated for 3 days before collection. Cell viability was assessed using CellTiter-Glo assays (Promega, G7572). Plates were brought to room temperature by placing on the benchtop, unstacked, for 15 min, then 100 μl CellTiter-Glo reagent diluted 5-fold with PBS was added to each well. Plates were shaken on an orbital shaker at 360 rpm for 20 min, then luminescence was recorded on a Tecan Spark plate reader (luminescence preset, 100 ms of integration time). Luminescence responses were normalized to the mean of the triplicate DMSO control wells for each compound.
Serial dilutions of compounds were prepared on 96-well tissue-culture-treated plates with one row per dilution series. Rows were prepared with one well of 297 μl complete medium and 3 μl DMSO stock (1,000× desired initial concentration), followed by 9 wells of complete medium and 1% DMSO at a volume V depending on the desired serial dilution ratio such that the serial dilution would bring each well to 300 μl. Then (300 μl – V) was serially diluted, pipetting thoroughly to mix, into all wells except the final well, which was left as a DMSO-only control. For example, for a 1,000-fold total dilution ratio, the required serial dilution ratio is \(\sqrt[8]{1,000}\) ≈ 2.371, so (300 – V) = 300/2.371 = 126.5 μl, and V = 173.5 μl. Pipette tips were replaced for each dilution to prevent overtreatment of low-concentration dilutions by compounds adhering to pipette tips.
All K562 cells were seeded at 1,000 cells per well. HUVECs (ATCC, CRL-1730) were seeded at 4,000 cells per well after a pilot experiment (data not shown) indicated that this seeding density produced subsaturated growth in the untreated condition over the experimental time course.
Saturation mutagenesis
BCR::ABL1 cDNA was cloned downstream of EGFP in a pUltra (Addgene, 24129) lentiviral vector by GenScript to produce pUltra wild-type BCR::ABL1 (Addgene, 210432). Twist Bioscience generated a saturating mutagenesis (SM) library of single amino-acid changes in the ABL1 SH3, SH2 and kinase domains (residues 64–512). The SM library was constructed in pools of eight amino acids (8-mers). Stable chemically competent Escherichia coli cells (NEB, C3040I) were transformed with each 8-mer of the SM library, with a coverage of >1,000×, and plated on 15-cm LB agar plates with ampicillin (100 μg ml–1). Coverage was calculated by estimating colony-forming units across the surface of the plate. Plates were incubated for 48 h at 30 °C, then colonies were scraped off the agar and plasmid DNA was extracted using an EZNA Plasmid DNA Midi kit (Omega Bio-Tek). HEK293T cells at 65–75% confluence in 10-cm plates were transfected with 35 μg of the SM ABL library and 10 μg of third-generation lentiviral packaging plasmids (1:1:1:1, VSV-G, GAG-POL, REV and TAT) using Thermo Fisher Lipofectamine 3000 according to the manufacturer’s protocol (ratio of 5 Lipofectamine: 1 DNA). The next day, the medium was changed to 10 ml fresh RPMI (Cytiva, SH30027.02). After 36 h, the medium was filtered and concentrated using Lenti-X Concentrator (Takara, 631232). Concentrated virus and 6 μg ml–1 polybrene were added to 10-cm plates containing 5 × 10⁶ K562 cells in 10 ml RPMI (multiplicity of infection < 1). Infection efficiencies ranged from 8 to 15%, with all samples having a library coverage of >1,000×. Infected K562 cells were allowed to recover for 36 h before enrichment by FACS on eGFP at the Penn State Flow Cytometry Core Facility using a Bigfoot Cell Sorter (Thermo Fisher). Sorted cells were expanded for 5 days, then cryopreserved for subsequent experimentation.
Mutational diversity of the K562 BCR::ABL1 mutant library was determined by tile-based amplification. The SH3, SH2 and kinase domains of BCR::ABL1 cDNA were divided into 15 150-bp overlapping tiles. Each tile was PCR-amplified using 1 μg of library gDNA per reaction (30 cycles: 15 s 98 °C, 30 s 65 °C, 30 s 72 °C) with two technical replicates per tile. All PCR reactions were performed using Watchmaker Genomics Equinox master mix. Indexed libraries were pooled at equimolar concentrations and sequenced using paired-end 150 bp reads on the Illumina NovaSeq X Plus platform by Novogene, generating over 1 × 10⁶ paired-end reads per sample. Sequencing data were processed by overlapping, error-correcting and merging paired-end reads using PEAR (v0.9.11)84. Merged reads were aligned to the ABL coding sequence (NM_005157.6) using bwa-mem2 (ref. 85) in a Linux environment. Variant calling and annotation were performed with a custom R pipeline, generating counts and sequencing depth for each unique mutant at each amino acid position. Subregions and subsequent full-sequence BCR::ABL1 regions for each condition were reconstructed from tiled data using custom Python scripts based on tile position cutoffs. All relevant code is available at GitHub (https://github.com/atlas-biotech/ab_shokat_ponatilink_2).
K562 cells stably expressing the BCR::ABL1 SM library were seeded at a density of 0.15 × 10⁶ cells per ml in 30 ml RPMI (Cytiva), with 10% FBS (Corning) and 1% PSG (Corning) per 15-cm non-treated tissue culture plate (library coverage >500×). Next, 10 mM stock solutions of compounds in DMSO were validated using a CellTiter-Glo 2.0 susceptibility assay before library experiments. Cell pools were treated with compounds for 32 days. Compounds were re-administered to each condition approximately every 3 days for the duration of the experiment by pelleting cells (350g for 5 min) and resuspending in fresh medium with freshly diluted compound. Cell counts and viability were monitored by flow cytometry every 1–3 days for the duration of the experiment using a BD Accuri C6. When live cell density exceeded 0.5 × 10⁶ cells per ml, cell conditions were split to 0.15 × 10⁶ cells per ml.
Immunoblotting
K562 cells were seeded in 6-well tissue-culture-treated plates (Corning 353046) at 1 × 10⁶ cells per well in 2 ml complete medium, and H1975 cells were plated at 0.4 × 10⁶ cells per well in 2 ml complete medium. Cells were allowed to recover at 37 °C overnight. For K562 cell signalling inhibition assays, serial dilutions of 10× compound stocks were prepared as for the cell viability assays, 200 μl of 10× stocks were added to plates, plates were swirled to mix and cells were incubated at 37 °C for 4 h before collection. For H1975 cell signalling inhibition assays, 2 μl of 1,000× DMSO stocks were added directly to plates, plates were swirled to mix and cells were incubated at 37 °C for 24 h before collection. For expression assays, cells were allowed to recover overnight but were not treated. To collect K562 cells, the medium in each well was manually pipetted up and down on each quadrant of the well to detach cells, and the suspension was transferred into a 2 ml tube on ice. Cells were pelleted at 400g for 4 min, then washed twice with 1 ml ice-cold PBS, with pipetting to resuspend. Dry cell pellets were flash-frozen and stored at −80 °C. To collect H1975 cells, medium was aspirated from the plates and cells were washed with 1–2 ml ice-cold PBS in place, then intact plates were stored at −80 °C.
To extract protein from K562 cell pellets, the pellets were thawed on ice for 5 min, then 60 μl lysis buffer (100 mM HEPES pH 7.5, 150 mM NaCl and 0.1% IGEPAL CA-630 (also known as NP-40, Sigma-Aldrich I3021), 1× complete EDTA-free protease inhibitor (Sigma-Aldrich/Roche 11873580001), 1× PhosSTOP phosphatase inhibitor (Sigma-Aldrich/Roche 4906845001)) was added to each pellet and pipetted four times to resuspend. Pellets were incubated on ice for 10 min, then centrifuged at 18,200g for 20 min, and 60 μl of clarified supernatant was transferred to fresh ice-cold PCR strip tubes. To extract protein from H1975 cells, plates were thawed on ice, then 80 μl ice-cold lysis buffer (Pierce RIPA buffer (Thermo 89900) with 1× complete EDTA-free protease inhibitor and 1× PhosSTOP phosphatase inhibitor) was added to each well, incubated for 10–30 min, then scraped with a plastic cell scraper and pipetted into ice-cold 2 ml tubes. Lysates were centrifuged at 18,200g for 15 min, then 72 μl of clarified supernatant was transferred into fresh ice-cold PCR strip tubes.
Protein concentrations were determined using Pierce BCA assays (Thermo Fisher 23225) according to the manufacturer’s instructions, performed in duplicate in 96-well plates with a ratio of 2 μl sample to 98 μl working reagent, and lysates were diluted to 2.5 mg ml–1 (initial concentrations were generally 3–6 mg ml–1) with lysis buffer. Gel loading samples were prepared with 5× Laemmli loading buffer (10% w/v SDS, 0.25 M Tris pH 6.8, 0.1% bromophenol blue, 0.5 M dithiothreitol and 50% glycerol) and denatured at 95 °C for 5 min before loading. Next, 10 μl of each loading sample was loaded alongside PageRuler prestained protein ladder (Thermo, 26616) on 4–12% Bis-Tris gels (Invitrogen NuPAGE, for example, WG1403) and separated by electrophoresis at 200 V for 50 min in MOPS buffer (Thermo, NP000102) for blots of K562 cells or for 45 min in MES buffer (Thermo, NP000202) for blots of H1975 cells. Gels of K562 cells were wet-transferred with a Bio-Rad Criterion transfer system to 0.45-μm nitrocellulose membranes (Bio-Rad, 1620115) at 75 V for 60 min at 4 °C with a −20 °C cold pack in Towbin transfer buffer (25 mM Tris, 192 mM glycine, pH 8.6, and 10% methanol) with stirring. Gels of H1975 cells were transferred with an iBlot3 semi-dry transfer system using the Broad Range preset. Subsequent steps were performed with gentle shaking. Membranes were blocked with 5% BSA–TBST (BSA: Sigma-Aldrich, 12659; TBST: 20 mM Tris, 150 mM NaCl, 0.1% Tween-20 and 0.02% sodium azide) for 1 h at room temperature, then cut into strips and probed with 1:1,000 dilutions (except as noted) of primary antibodies in 5% BSA–TBST at 4 °C overnight. Primary antibodies used were as follows, all obtained from Cell Signaling Technology: c-ABL (2862); phospho-c-ABL Y245 (isoform 1b numbering) (2861); STAT5 (94205); phospho-STAT5 Y694 and Y699 (9351); CRKL (3182); phospho-CRKL Y207 (3181); α-tubulin (3873); EGFR (4267); phospho-EGFR Y845 (2231); AKT (4691); phospho-AKT S473 (4060); ERK1/2 (9102); phospho-ERK1/2 T202/Y204 (9101); and BIM (2933). Primary antibody for GAPDH was obtained from Proteintech (60004-1-Ig) and used at 1:5,000 dilution. Antibodies were multiplexed in single solutions as follows: CRKL with phospho-CRKL, ERK with GAPDH and phospho-ERK with GAPDH.
After probing, strips were washed three times briefly with DI water, washed three times (4 min each) with TBST and incubated 1 h at room temperature with a mixture of two secondary antibodies, both at 1:10,000 dilutions in 5% BSA–TBST: LI-COR IRDye 800CW goat anti-rabbit (926-32211) and IRDye 680RD goat anti-mouse (926-68070). Strips were washed three times briefly with DI water, then washed three times (4 min each) with TBST.
For K562 cells, strips from blots were washed briefly 1× with DI water, stored briefly in TBS (TBST without Tween), then imaged simultaneously on a LI-COR Odyssey 9120 imager at 84 μm resolution, medium quality and intensity of 5 on the 800 channel and 3 on the 680 channel. Scans were processed using LI-COR ImageStudio Lite software: full scans were cropped into individual strips, the brightness of cropped strip images was adjusted and images were exported for figures at original resolution. For H1975 cells, strips from blots were imaged individually on a Bio-Rad ChemiDoc MP with the IRDye 800CW and IRDye 680CW settings, using automatic optimal exposure. Scans were processed using Bio-Rad Image Lab software: the brightness of strip images was adjusted and images were exported for figures at original resolution.
In vitro kinase activity assays
In vitro kinase activity assays were performed by Thermo Fisher Scientific (SelectScreen). Experiments were performed in technical duplicate. Data are reported as the per cent inhibition after correction for background fluorescence and normalization to DMSO controls. For dose–response experiments, kinase activity values were calculated (100% – % inhibition) and these values were processed and plotted as for cell viability experiments.
Colony-forming unit assays
Primary peripheral blood mononuclear cells (PBMCs) from healthy individuals were obtained from StemCell Technologies (lot 2410407006) and thawed in DMEM medium (Gibco) supplemented with 20% FBS, 2 mM EDTA, 1% penicillin–streptomycin–l-glutamine (100× PSG, Gibco 10378016) and 500 μg DNase I. Cells were pelleted and resuspended in RPMI supplemented with 10% FBS and 1% PSG and filtered through a 70-μm cell strainer. Around 3 × 10⁴ cells per treatment condition, in triplicate, were incubated with DMSO, ponatinib, asciminib, pona+asc (1:1 ratio) or PonatiLink-2 in 10 nM, 100 nM, 1 μM and 10 μM conditions in human methylcellulose-enriched medium (HSC005, R&D systems). Next, 35-mm culture dishes were inoculated in triplicate with the methylcellulose mixture using 16-gauge non-stick needles. The cultures were incubated at 37 °C and 5% CO2 for 14 days. Colony counts of BFU-E and CFU-G from the 1 μM and 10 μM conditions were determined by microscopy (Olympus CKX53, ×4 objective) by an individual blinded to the treatment conditions, and counts were normalized for each colony type independently relative to the mean of untreated controls. Following colony counts, plates from all conditions (unstained) were aligned and imaged using a ChemiDoc MP Imaging system (Bio-Rad) under the Coomassie blue setting to visualize BFU-E colony formation. Count data were analysed by negative binomial regression with log link function. Each colony type and dose level was considered separately. Statistics for treatment effects compared with DMSO control were calculated using Dunnett’s method for multiple comparisons (two-sided tests). Results are reported as the log fold change with Dunnett-adjusted P values.
PRISM pooled cell line screen
Ponatinib, asciminib and PonatiLink-2 were tested against the Broad Institute PRISM Laboratory’s MTS026 consortium screen. In brief, cell lines barcoded by lentiviral transduction were subjected to quality control checks, including mycoplasma testing, STR profiling and sequencing each barcode to confirm identity, pooled into groups of 20–25 lines by similar growth rates and cryopreserved. Pools were thawed directly into 384-well plates and treated with compounds at 8 doses in 3-fold dilutions from 2 μM for 5 days. Cells were then lysed with Qiagen TCL buffer and 5 μl of each pool for each cell set was collapsed into one 384-well plate. mRNA was reverse-transcribed, PCR-amplified and quantified by hybridization to Luminex beads as previously described58. Data from 865 cell lines passed quality control and were included in analyses. Cell viability as presented in this work was quantified as the Riemann AUC of mean viability readings at each dose, without reference to model fitting. Data-processing details can be found at GitHub (https://github.com/cmap/dockerized_mts).
In vitro kinase bead affinity assays
In vitro KINOMEscan kinase bead affinity assays were performed by Eurofins. Streptavidin-coated magnetic beads were treated with biotinylated small-molecule ligands for 30 min at room temperature to generate affinity resin. The liganded beads were blocked with excess biotin and washed with blocking buffer (SeaBlock (Pierce), 1% BSA, 0.05% Tween 20 and 1 mM DTT) to remove unbound ligand and to reduce nonspecific binding. Binding reactions were assembled by combining kinases, liganded affinity beads and test compounds in 1× binding buffer (20% SeaBlock, 0.17× PBS, 0.05% Tween 20 and 6 mM DTT). Test compounds were prepared as 111× stocks in 100% DMSO. Kd values were determined using an 11-point 3-fold compound dilution series with 3 DMSO control points. All compounds for Kd measurements were distributed by acoustic transfer (non-contact dispensing) in 100% DMSO. The compounds were then diluted directly into the assays such that the final concentration of DMSO was 0.9%. All reactions were performed in polypropylene 384-well plates. Each was a final volume of 0.02 ml. The assay plates were incubated at room temperature with shaking for 1 h and the affinity beads were washed with wash buffer (1× PBS and 0.05% Tween 20). The beads were then re-suspended in elution buffer (1× PBS, 0.05% Tween 20 and 0.5 μM non-biotinylated affinity ligand) and incubated at room temperature with shaking for 30 min. The kinase concentration in the eluates was measured by qPCR. Experiments were performed in technical duplicate.
Dose–response data analysis and visualization
Data from dose–response experiments were analysed and plotted with the ‘doseplotr’ R package, available at GitHub (https://github.com/jackwalkerstevenson/doseplotr). In brief, four-parameter log-logistic functions were fit using the ‘drda’ R package86 to the normalized response and the log-molar dose, with the low-dose asymptote constrained to between 80% and 120%. Throughout this work, IC50 refers to the absolute 50% inhibitory concentration, that is, the concentration at which a fitted curve crosses 50% of the control response, and EC50 refers to the relative 50% effective concentration, that is, the concentration at which a fitted curve passes the midpoint between its upper and lower asymptotes. Inhibitory concentrations at other thresholds (for example, IC90) are likewise absolute. This usage distinguishes two definitions of a half-maximal concentration; it is not intended to distinguish inhibitory from non-inhibitory responses.
Animal experiments
The mouse toxicity study was performed by Crown Biosciences in accordance with the Crown Institutional Animal Care and Use Committee (IACUC CBSD-ACUP-001). In brief, 9-week-old female NOD/SCID mice were purchased from the Jackson Laboratory (stock no. 001303) and were housed with ad libitum food and water at 20–26 °C and 30–70% humidity on a 12-h light cycle at the Crown Biosciences San Diego vivarium. Mice were dosed daily with PonatiLink-2-PEG17 100 mg kg–1 in water 10 ml kg–1 by intraperitoneal injection. Blood was drawn for compound concentration measurements from the submandibular vein immediately before and 3 days after dosing on day 14, as well as by cardiac bleed at time of euthanasia 7 days after dosing. Blood was processed into plasma and frozen for later analysis. Plasma bioanalysis was performed by liquid chromatography–triple quadrupole mass spectrometry by BioQual Solutions.
Tumour growth studies were performed by the University of California, San Francisco (UCSF) Preclinical Therapeutics Core in accordance with the UCSF Institutional Animal Care and Use Committee (IACUC 194778). In brief, 24 6–7-week-old female NOD/SCID mice per study were purchased from the Jackson Laboratory (stock no. 001303) and were housed with ad libitum food and water on a 12-h light cycle at 20–23 °C and 40–70% humidity at the UCSF Preclinical Therapeutics Core vivarium. Xenografts were established by subcutaneous injection in the right hind flank of 5 × 10⁶ cells in 50 μl each of RPMI 1640 medium and Matrigel. When all tumours reached approximately 100–200 mm3, mice were randomized into 3 groups (n = 8 per group) using a stratified method in Studylog (v4.2.1.3) and dosing was initiated. This day was annotated as day 0. Group sizes were predetermined using power calculations based on an estimated 20% standard deviation and 20–35% effect size, with 8 mice per group selected based on historical data and model complexity. Animal specialists were blinded to treatment group during all procedures and data collection; animal allocation and coding were performed by the Preclinical Therapeutics Core manager. Tumour dimensions and body weight were measured twice a week or once a week as indicated. Tumour volume was calculated to approximate the volume of an ellipsoid as 0.5 × width2 × length. The tumour size end point was defined as 20 mm in the maximum dimension, and mice were killed on the same day they were observed to reach end point, according to the IACUC protocol’s Humane End Point standard: “If the greatest tumour dimension exceeds 20 mm in the largest dimension, then the animal will be euthanized.” Mice were also monitored for body weight loss and euthanized if necessary according to the IACUC protocol: “Drug treatment will be stopped if weight loss >15% occurs. If weight loss continues to exceed 15% of pre-tumour implantation body weight, the animal will be euthanized.” Significance of time to end point was calculated using log-rank tests (two-sided, one degree of freedom, test statistic = χ2) between vehicle and each treatment group, corrected for multiple testing by the Holm method.
For the dasatinib + PonatiLink-2 study, K562 cells were used for seeding. Mice were dosed with vehicle (both 5 mM trifluoroacetic acid 5 ml kg–1 by intraperitoneal injection and 1:1 propylene glycol and water 10 ml kg–1 by oral gavage), dasatinib (Ambeed, A355193) 5 mg kg–1 in 1:1 v/v propylene glycol–water 10 ml kg–1 by oral gavage, or both dasatinib 5 mg kg–1 in 1:1 v/v propylene glycol–water 10 ml kg–1 by oral gavage and PonatiLink-2-PEG17 100 mg kg–1 in water 5 ml kg–1 by intraperitoneal injection. The vehicle and dasatinib-only groups were dosed daily Monday–Friday for 2 weeks, then Monday–Thursday for one additional week. The dasatinib + PonatiLink-2-PEG17 group received dasatinib on the same schedule, with PonatiLink-2-PEG17 given Thursday–Friday for 2 weeks, then Wednesday–Thursday for one additional week. The study was terminated 3 months after dosing was discontinued. One mouse (477) in the dasatinib-only group was euthanized owing to sudden body weight loss on day 56.
For the ponatinib study, K562 pUltra BCR::ABL1E255V/T315I cells were used for seeding. Mice were dosed daily Monday–Friday (day 0 was a Thursday) with vehicle (both 5 mM trifluoroacetic acid 5 ml kg–1 by intraperitoneal injection and 25 mM citrate buffer pH 2.8 10 ml kg–1 by oral gavage), ponatinib hydrochloride (MCE, HY-108766) 30 mg kg–1 in 25 mM citrate buffer pH 2.8 10 ml kg–1 by oral gavage, or PonatiLink-2-PEG17 100 mg kg–1 in water 5 ml kg–1 by intraperitoneal injection. Blood was drawn from the saphenous vein for compound concentration measurements from all three groups both immediately before and either 2 h (vehicle and PonatiLink-2) or 6 h (ponatinib) after dosing on day 14, processed into plasma and frozen for subsequent analyses. The study was terminated when all mice in the vehicle-treatment group had reached end point (apart from two spontaneous regressions) on day 42. One mouse (452) in the ponatinib arm was accidentally killed by handling error on day 27. Plasma bioanalysis was performed by liquid chromatography–triple quadrupole mass spectrometry by Oakland Analytics.
The K562 PL2R cell line was cultured from the PonatiLink-2-resistant tumour at the end of the study. The tumour was collected, washed with PBS, minced with scalpels and incubated with 5 ml Accutase (Innovative Cell Technologies) at 37 °C for 45 min with periodic mixing. Accutase was quenched by adding an equal volume of warm complete medium. Dissociated cells and remaining tumour fragments were passed through a 100-μm cell strainer, pressing with a syringe plunger with the strainer immersed in a film of medium, followed by rinsing with additional medium. Strained cells were pelleted, resuspended in complete medium and cultured for 1 week before cryopreserving. Parallel cultures maintained with and without 30 nM PonatiLink-2 for 1 week showed minimal difference in resistance to PonatiLink-2 or parent compounds (data not shown). The cells cultured without supplemental PonatiLink-2 were used for experiments presented here.
Sanger sequencing of spontaneous resistance mutants
gDNA was extracted from 25 mg samples of tumour tissue or pellets of 2 × 10⁶ cultured cells using a DNEasy Blood & Tissue kit (Qiagen 69504). The ABL1 gene was PCR-amplified from the lentiviral integration site using primers spanning from the carboxy-terminus of BCR to the C terminus of the ABL1 kinase domain (forward primer GAAGCTTCTCCCTGACATCCGT; reverse primer TCGTCTTGGTGGGCAGCTC) with thermocycling as follows: 2 min 98 °C, followed by 25 cycles of (10 s 98 °C, 20 s 74 °C, 36 s 72 °C), followed by 2 min 72 °C. The expected 1.7-kb fragment was isolated by gel purification using an EZNA Gel Extraction kit (Omega), eluting with 30 μl nuclease-free water and re-eluting 1× with the eluate for maximum concentration. Sanger sequencing was performed by Elim Biopharm.
Reporting summary
Further information on research design is available in the Nature Portfolio Reporting Summary linked to this article.
