


Type I IFN-stimulated genes are differentially expressed in tumour-associated monocytes and macrophages in the glioblastoma tumour microenvironment
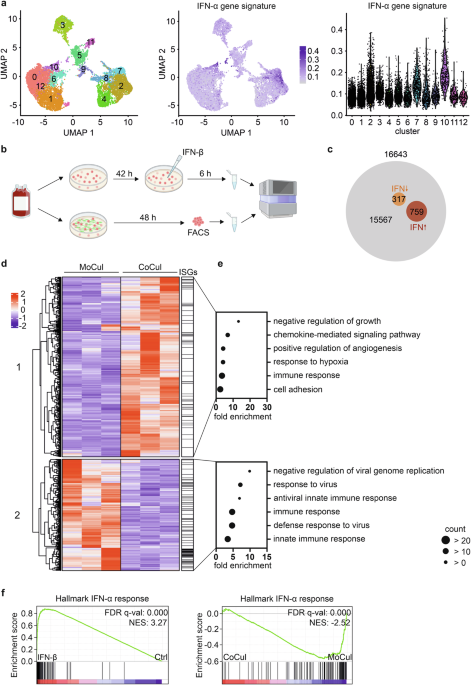
Macrophages, which comprise the majority of the immune infiltrate in GB, exert various anti-tumour actions when exposed to type I IFNs20. However, surprisingly little is known about type I IFN signatures in GB-associated macrophages. Therefore, we re-analysed scRNA sequencing data of seven patients with newly diagnosed GB from a previous study (GSM4972211)9, focusing on CD45-expressing cells to specifically investigate immune-cell subsets. Clustering analysis of the immune-cell subtypes identified 14 distinct cluster populations, the majority of which contained cells of myeloid origin (Supplementary Fig. 1a and b). Specifically, while markers for innate and adaptive lymphocytes (CD3G, granzyme A (GZMA) and killer cell lectin-like receptor (KLR) B1) were almost exclusively expressed in clusters 7–9, clusters 0–6 and 10–13 displayed a pronounced expression of the myeloid markers CD68 and CD14 and the complement C1QA chain (Supplementary Fig. 1b). To gain further insights into the different TAM clusters and their type I IFN responses, we re-analysed cells within the myeloid clusters 0–6 and 10–13 separately and clustered them anew. In line with the original analysis9, TAM clusters were distinguished into brain-resident microglia (MG-TAMs) (TAM clusters 0, 1, 2, 4, 6, 10, and 12) based on prominent expression of CX3C motif chemokine receptor 1 (CX3CR1), excitatory amino acid transporter 1 (SLC1A3) and transmembrane protein 119 (TMEM119), or cells of monocytic origin (MO-TAMs) (TAM clusters 5, 8 and 9), expressing integrin-α4 (ITGA4), transforming growth factor-β1 (TGFBI) and formyl peptide receptor 3 (FPR3) (Fig. 1a, left panel; Supplementary Fig. 1c). Of note, some cluster populations (3, 7 and 11) did not fit into one of these categories, as they either expressed markers of both subgroups or none of them at all and, thus, could contain dendritic or granulocytic cells. Finally, we used the “hallmark interferon-α response” from MSigDB29 to score type I IFN responses between the different TAM clusters. Interestingly, while the highest ISG signature expression was observed in some MG-TAM clusters (2, 10), the clusters containing MO-TAMs (5, 8, 9) rather displayed low to medium ISG signature scores (Fig. 1a, middle and right panel). Of note, there also appeared to be a rather prominent patient-to-patient variability in the analysed samples (Supplementary Fig. 1d). To further investigate type I IFN responses in MO-TAMs in GB, we isolated primary human monocytes from buffy coats and co-cultured them for 48 h with the GB cell line LN229 (Fig. 1b). This experimental setup was chosen to reflect the early interactions between these cell types after monocytes entered the tumour. For downstream analyses of RNA expression changes, monocytes and GB cells were separated by FACS. To identify bona fide IFN targets, we further treated monocytes in the absence of GB with IFN-β (1 ng/ml) for 6 h. Principal component analysis of the expressed genes, determined by bulk RNA-seq analyses, clearly distinguished the three experimental conditions (Supplementary Fig. 1e). It is noteworthy that differentiation along the main principal component (PC1: 66% variance) separated co-culture- and IFN-β-induced mRNA expression profiles from control monocytes in opposite directions. Of the 16,643 genes detected by RNA-seq, 1,076 genes were differentially expressed after IFN-β treatment compared with the control (padj < 0.1, |log2FC | > 1). Among these, 317 were down- and 759 were upregulated (Fig. 1c; Supplementary Table 6a), the latter being deemed ISGs. Similarly, we found 929 genes to be differentially expressed between mono- and co-culture (padj < 0.1, |log2FC | > 1), 575 being up- and 354 being downregulated (Fig. 1d; Supplementary Table 6b). Of note, annotation of the above-described ISGs revealed a strong enrichment in the cluster with differentially expressed genes (DEGs) downregulated in co-cultured monocytes. In line, while there was a functional enrichment for gene ontology (GO) terms related to immune and inflammatory responses among genes from both clusters, genes downregulated in co-culture appeared to be specifically enriched in antiviral immune responses and type I IFN signalling processes (Fig. 1e; Supplementary Table 7a). Moreover, Gene Set Enrichment Analysis (GSEA) using the Hallmark gene sets from MSigDB not only validated a strong enrichment of the IFN-α response upon treatment with IFN-β but also revealed a depletion of the same set of genes in co-culture (Fig. 1f; Supplementary Table 7b).
Fig. 1: Expression of type I IFN response genes in tumour-associated myeloid cells in the glioblastoma tumour microenvironment.
a, Uniform manifold approximation and projection (UMAP) of CD45-positive cells with substantial expression of myeloid markers from seven patients with newly diagnosed GB9 (left panel) and relative expression of an interferon (IFN)-α gene signature scored with UCell visualized as feature (middle panel) and violin plots (right panel). b, Experimental procedure of the in vitro experiments: primary human monocytes were isolated from buffy coats using CD14-MACS, before being cultured for 48 h either in mono-culture (MoCul) or in co-culture (CoCul) with LN229 cells. Alternatively, monocytes were treated with 1 ng/ml IFN-β for the last 6 h. After fluorescence-activated cell sorting (FACS)-based purification, RNA was isolated form monocytes and RNA expression was determined by RNA sequencing (n = 3). c, Venn diagram depicting all genes captured by RNA-seq in monocytes, and highlighting subgroups of genes up- or downregulated (padj < 0.1, |log2FC | > 1) after IFN-β stimulation. d, Differentially expressed genes (z-score normalized counts) between mono- and co-cultured monocytes (padj < 0.1, |log2FC | > 1), categorized by k-means clustering. Annotation column depicts genes upregulated in mono-cultured monocytes treated with IFN-β (padj < 0.1, log2FC > 1) from c, herein determined as interferon-stimulated genes (ISGs). e, Top six functional annotation terms for each cluster identified by the Database for Annotation, Visualization and Integrated Discovery, ordered by fold enrichment (size of circles represents counts of enriched genes within the annotation clusters). f, Gene set enrichment analysis of untreated versus IFN-β-treated monocytes (left panel), or mono- versus co-cultured monocytes (right panel). FDR, false discovery rate; NES, normalized enrichment score.
These results point towards an attenuated expression of ISGs in primary human monocytes co-cultured with GB cells.
Type I IFN responses are downregulated in monocytes communicating with glioblastoma cells
To gain further insights into altered ISG expression profiles in monocytes upon co-culture with GB cells, we determined the overlap of the 759 above-described ISGs with the DEGs in co-cultured monocytes (padj < 0.1, |log2FC | > 1). While only 9.57% of the 575 upregulated genes in co-culture appeared to be ISGs, a markedly larger proportion of the downregulated genes (i.e. 22.32% of 354) were ISGs (Fig. 2a). The observation that ISGs comprise approximately one quarter of the downregulated genes in co-cultured monocytes, the overlap herein referred to as co-culture-repressed ISGs (CoR-ISGs), indicates that IFN-related signalling might be of major relevance in this context. The CoR-ISGs encompassed many classical ISGs, including interferon-induced protein with tetratricopeptide repeats (IFIT) 1, interferon-inducible (IFI) 6 and 44 L, oligoadenylate synthetase (OAS) 3, HECT and RLD domain-containing E3 ubiquitin protein ligase (HERC) 5 and ISG15 (Fig. 2b; Supplementary Fig. 2a). To further examine if ISG downregulation in monocytes upon co-culture with LN229 cells depends on direct cell-cell contacts, we co-cultured the two cell types in an indirect manner, i.e. using a transwell, Boyden chamber approach (Fig. 2c; Supplementary Fig. 2b). Interestingly, the expression of exemplary ISGs IFIT1, OAS3, IFI44L, ISG15, IFI6 and HERC5 was also significantly decreased in this indirect co-culture approach compared with monocytes alone, although the reduction was less pronounced than in direct co-culture. In line, IFIT1 and ISG15 protein expression was reduced in monocytes upon 48 h of indirect co-culture with LN229 cells (Fig. 2d; Supplementary Fig. 2c). These findings indicate that soluble factors might contribute to decreased ISG expression in monocytes in the GB context. Importantly, ISG mRNA expression was similarly reduced after 24 and 48 h and was partially lost after 72 h of co-culture (Fig. 2e). As we previously observed differences in ISG expression among different TAM subtypes (Fig. 1a), we wondered if co-culture with LN229 cells might affect ISG expression in microglia as well. Interestingly though, ISG expression was not reduced in C20 or HMC3 microglial cell lines after 24-h co-culture with LN229 cells (Supplementary Fig. 2d). Finally, to determine if the observed ISG downregulation upon co-culture is a LN229-specific phenomenon or if it is a more general response in the GB TME, we co-cultured primary human monocytes with a panel of GB cell lines (LN229, T98G, U87 and U251) for 24 h in the transwell set-up. As co-culture with T98G and U87 cells provoked a similar ISG downregulation in primary human monocytes, this hints towards a broader phenomenon (Fig. 2f). Nevertheless, co-culture with U251 cells did not elicit the same phenotype in monocytes, providing a well-suited negative control for further analyses. Interestingly, a comparison of the basal transcriptomes of the four GB cell lines with GSEA using the C2 curated gene set collection from MSigDB revealed a strong enrichment of the gene set “(Verhaak) glioblastoma multiforme mesenchymal”3, which refers to the “mesenchymal” TCGA subtype in LN229, T98G and U87 (REST) compared with U251, whereas the “classical” TCGA subtype was enriched in U251 respective to the other cell lines (Supplementary Fig. 2e; Supplementary Table 7c).
Fig. 2: Downregulation of type I IFN responses in monocytes upon contact with glioblastoma cells.
a, b, Primary human monocytes isolated from buffy coats were co-cultured with LN229 cells for 48 h (CoCul) or treated with 1 ng/ml interferon-β (IFN-β) for the last 6 h. RNA expression was determined by RNA-seq. a, Venn diagram depicting genes upregulated in monocytes by IFN-β and up- or downregulated after co-culture with LN229 cells (padj < 0.1, |log2FC | > 1). b, Heatmap visualizing 79 genes (z-score normalized counts) upregulated after stimulation with IFN-β and downregulated after co-culture with LN229 cells (co-culture-repressed-ISGs (CoR-ISGs)) from a. Selected interferon-stimulated genes (ISGs) are highlighted (green). c, d, Primary human monocytes were mono-cultured (MoCul, cyan) or co-cultured (CoCul, blue) with LN229 cells in transwell inserts for 48 h. c, mRNA expression of selected ISGs (interferon-induced protein with tetratricopeptide repeats 1 (IFIT1), oligoadenylate synthetase 3 (OAS3), interferon-inducible 44 L (IFI44L), interferon-stimulated gene 15 (ISG15), interferon-inducible 6 (IFI6), HECT and RLD domain-containing E3 ubiquitin protein ligase 5 (HERC5)) was analysed by qPCR and normalized to TATA-box-binding protein (TBP) expression (n = 3). d, Expression of IFIT1 and ISG15 protein was determined by Western blot analysis and normalized to total protein (n = 8). e, Primary human monocytes were co-cultured with LN229 cells in transwell inserts for the indicated time points (n = 6). f, Primary human monocytes were co-cultured with various GB cell lines in transwell inserts for 24 h (n = 7). e, f, mRNA expression of IFIT1, OAS3 and IFI44L was analysed by qPCR and normalized to TBP expression. All data are means ± SEM and were statistically analysed using paired t test (c, d) or one-way repeated measures analysis of variance with Dunnett’s multiple comparisons test (e, f) (*P < 0.05, **P < 0.01, ***P < 0.001).
In conclusion, attenuated type I IFN responses upon contact with GB cells appear to be a rather widespread phenomenon in primary human monocytes, but not in microglia, and depend, at least to a major degree, on soluble factors in the TME.
GM-CSF is a major factor in the glioblastoma-cell-mediated decrease in type I IFN responses in monocytes
In order to identify potentially contributing soluble factors, we measured the concentration of classical, TME-associated cytokines (IL-6, IL-1β, IL-10) in supernatants from monocytes and co-cultures of monocytes and LN229 cells (Fig. 3a). In fact, while IL-10 concentrations of both conditions were similar, levels of the pro-inflammatory cytokines IL-6 and IL-1β appeared to be higher in co-culture supernatants. It is noteworthy that both IL-1β and IL-10 levels were generally extremely low (close to or below the detection limit). To assess whether these differences might play a role in reduced ISG expression in monocytes upon co-culture with GB cells, we next evaluated cytokine secretion more broadly (a total of 14 cytokines) in different GB cell lines that had been shown to be differentially effective in regulating ISGs in monocytes (Fig. 2f). As the ISG-repressive properties of the four GB cell lines did not correlate with the concentrations of any of the detectable cytokines (IL-1α, IL-1β, IL-11, IL-12p40, IL-12p70, IL-15, IL-33 or IL6) (Supplementary Fig. 3a and b), they did not appear to be crucial for the observed changes in type I IFN signalling in co-cultures of monocytes and GB cells. Considering that reduced ISG expression upon contact with GB cells was prominent in early monocytes and slightly recovered during their maturation to macrophages (Fig. 2e), we next asked whether factors contributing to the monocyte-to-macrophage maturation process might affect GB-cell-mediated ISG depletion. Therefore, we co-cultured primary human monocytes for 24 h with LN229 cells in the transwell set-up, either with the differentiation factors M-CSF (50 ng/ml), GM-CSF (10 ng/ml), or a combination of the two (50 ng/ml M-CSF plus 10 ng/ml GM-CSF). As observed before, the co-culture-induced ISG repression was prominent in the presence of M-CSF. Strikingly though, GM-CSF by itself (regardless of the presence or absence of additional M-CSF) massively inhibited ISG expression in monocytes (Supplementary Fig. 3c). The notion that co-culture did not further reduce CoR-ISG expression beyond the GM-CSF-induced repression, suggested that the two effects might be related. Therefore, we analysed the expression of the GM-CSF target gene cytokine-inducible SH2-containing protein (CISH). Interestingly, CISH expression was significantly elevated in monocytes co-cultured with different GB cell lines, but not in monocytes co-cultured with U251 (Fig. 3b). In line, GM-CSF was detected in the supernatants of LN229, T98G and U87 cells, but not in the supernatants of U251 cells or monocytes alone (Fig. 3c). Activation of GM-CSF downstream signalling was further confirmed by the upregulation of STAT5 phosphorylation in monocytes upon co-culture with LN229 cells (Fig. 3d; Supplementary Fig. 3d). As the GM-CSF concentrations observed in the supernatants were much lower than those supplemented for differentiation purposes, GM-CSF supplementation was titrated down with respect to its CoR-ISG inhibitory efficacy. Indeed, recombinant human GM-CSF already suppressed ISG expression in primary human monocytes at concentrations of 50 pg/ml to a similar extent to co-cultures with LN229 cells (Fig. 3e; Supplementary Fig. 3f). These results indicate that even very low, pathophysiologically relevant concentrations of GM-CSF might attenuate type I IFN signalling in monocytes in the GB TME. Interestingly, the same concentration of GM-CSF did not reduce CoR-ISG expression in microglial cells (HMC3, C20) (Supplementary Fig. 3e). To gain further insights into the role of GM-CSF in this context, we next determined transcriptome changes of monocytes treated with recombinant human GM-CSF (50 pg/ml), or co-cultured with GM-CSF-producing LN229 versus non-GM-CSF-producing U251 (Fig. 3f-I). In addition, global RNA expression of monocytes co-cultured in the transwell set-up for 24 h with LN229 in the presence or absence of an antibody (0.5 µg/ml) neutralizing GM-CSF (Fig. 3f-II) was analysed. Corroborating the observation in direct co-cultures (Fig. 2b), CoR-ISGs were mostly decreased in indirect co-cultures relative to mono-culture controls (Fig. 3f-l, middle columns; Supplementary Table 6c). Importantly, the same CoR-ISGs were decreased, even to a similar extent, after treatment with human recombinant GM-CSF (Fig. 3f-I, left columns). Specifically, there was a strong decrease in cluster 2 and a less prominent decrease in cluster 3 in both conditions. In contrast, CoR-ISGs were not decreased but rather increased in co-cultures with U251 relative to mono-cultures (Fig. 3f-I, right columns). Co-culture again reduced the expression of CoR-ISGs after IgG-treatment albeit to a lesser extent (Fig. 3f-II, left columns) and neutralization of GM-CSF slightly upregulated CoR-ISG expression in both mono- and co-cultures (Fig. 3f-II, middle and right columns). Rescued CoR-ISG expression due to neutralization of GM-CSF in the co-cultures was further validated via qPCR analyses (Supplementary Fig. 3g).
Fig. 3: GM-CSF restricts type I IFN responses in monocytes.
a, Primary human monocytes were mono-cultured (MoCul, cyan) or co-cultured (CoCul, blue) with LN229 cells in transwell inserts for 24 h. Interleukin (IL)-6, IL-1β and IL-10 protein concentrations in supernatants were determined by cytometric bead array (n = 13). b, Primary human monocytes were co-cultured with various glioblastoma cell lines in transwell inserts for 24 h (n = 7). mRNA expression of the granulocyte-macrophage colony-stimulating factor (GM-CSF) target gene cytokine-inducible SH2-containing protein (CISH) was analysed by qPCR and normalized to TATA-box-binding protein (TBP) expression. c, GM-CSF protein concentrations in supernatants of several glioblastoma cell lines or primary human monocytes (Mo) were determined by ELISA (n = 4). d, Primary human monocytes were mono-cultured (MoCul, cyan) or co-cultured (CoCul, blue) with LN229 cells in transwell inserts for 24 h (n = 14). Protein expression of phosphorylated signal transducer and activator of transcription 5 (pSTAT5) (left panel) and total STAT5 (right panel) was determined by Western blot analysis and normalized to total protein. e, Primary human monocytes were treated with recombinant human GM-CSF (50 pg/ml) for 24 h (n = 8). mRNA expression of selected interferon-stimulated genes (ISGs) (interferon-induced protein with tetratricopeptide repeats 1 (IFIT1), oligoadenylate synthetase 3 (OAS3), interferon-inducible 44 L (IFI44L)) and CISH was analysed by qPCR and normalized to TBP expression. All data are means ± SEM and were statistically analysed using paired t test (a, d, e, (IFIT1, OAS3, CISH)), or Wilcoxon matched-pairs signed rank test (e, IFI44L), or one-way repeated measures analysis of variance with Dunnett’s multiple comparisons test (b) (*P < 0.05, **P < 0.01, ***P < 0.001). f, Primary human monocytes were co-cultured with LN229 cells or U251 cells in transwell inserts or treated with 50 pg/ml recombinant human GM-CSF for 24 h (I). Monocytes were incubated with 0.5 µg/ml GM-CSF neutralizing antibody (α-GM-CSF), or polyclonal goat IgG control (IgG) and co-cultured with LN229 cells in transwell inserts for 24 h (II). RNA expression was determined by RNA sequencing (n = 6). Heatmaps depict log2FC of co-culture-repressed-ISGs (CoR-ISGs) determined in Fig. 2a, categorized by k-means clustering.
Taken together, these results suggest that GM-CSF plays a central role in the GB-cell-mediated decrease in ISG expression in monocytes.
Downregulated IFN-stimulated gene expression in monocytes co-cultured with glioblastoma cells is not dependent on IFNAR
As we observed a rather broad attenuation of ISG expression in monocytes co-cultured with GB cells, we next investigated if canonical type I IFN signalling could be involved. We observed a slight decrease in phosphorylation of the major transcription factor STAT1 in co-cultures (Fig. 4a; Supplementary Fig. 4). Therefore, we aimed to investigate the role of IFNAR. While IFNAR1 expression slightly increased in monocytes between 24 and 48 h after isolation, no differences were detectable between mono- and co-culture in the transwell set-up (Fig. 4b). In line with this, IFNAR1 protein surface expression increased from 24 to 48 h as measured by flow cytometry, again with no differences between mono- and co-culture (Fig. 4c). Of note, IFNAR1 expression after 24 h was only slightly higher than the background (Supplementary Fig. 4b). Therefore, changes in ISG expression in monocytes upon contact with GB cells are not attributable to changes in IFNAR availability. To assess whether IFNAR might still be involved, independent of its availability at the surface, we scavenged type I IFN with the decoy receptor B18R (0.1 µg/ml) or blocked IFNAR2 with a specific antibody (50 ng/ml) in either monocytes co-cultured with LN229 in the transwell set-up or monocytes treated with GM-CSF (50 ng/ml) for 24 h. Both intervention strategies were able to decrease IFN-β-induced upregulation of ISG expression to control levels (Supplementary Fig. 4c). Notably, although both scavenging of type I IFN and neutralization of IFNAR2 strongly reduced basal expression of exemplary ISGs (Supplementary Fig. 4c), GB co-culture- and GM-CSF-mediated downregulation of ISGs was still largely visible after blockade of type I IFN- and IFNAR-mediated signals (Fig. 4d).
Fig. 4: Co-culture-mediated downregulation of type I IFN responses in monocytes is largely independent of IFNAR.
a–c, Primary human monocytes were mono-cultured (MoCul, cyan) or co-cultured (CoCul, blue) with LN229 cells in transwell inserts for 24 h (a) or for the indicated time points (b, c). a, Phosphorylated signal transducer and activator of transcription 1 (pSTAT1) protein expression was determined by Western blot analysis and normalized to total STAT1 expression (n = 11). b, Interferon-α/β-receptor 1 (IFNAR1) mRNA expression was analysed by qPCR and normalized to TATA-box-binding protein (TBP) expression (n = 5). c, IFNAR1 protein surface expression was analysed using flow cytometry and plotted as median fluorescence intensity (MFI) (n = 3). d, Primary human monocytes were incubated with 0.1 µg/ml recombinant B18R, or 50 ng/ml IFNAR2 neutralizing antibody (α-IFNAR2) or IgG2a-isotype control (IgG2a), and mono-cultured (MoCul, cyan), co-cultured with LN229 cells in transwell inserts (CoCul, blue), or treated with 50 pg/ml recombinant human granulocyte-macrophage colony-stimulating factor (GM-CSF, grey) for 24 h (n ≥ 3). mRNA expression of selected interferon-stimulated genes (ISGs) (interferon-induced protein with tetratricopeptide repeats 1 (IFIT1), oligoadenylate synthetase 3 (OAS3) and interferon-inducible 44 L (IFI44L)) was analysed by qPCR and normalized to TBP expression. All data are means ± SEM and were statistically analysed using paired t test (a), two-way repeated measures analysis of variance (ANOVA) with Šídák’s multiple comparisons test (b, c) or one-way repeated measures ANOVA with Dunnett’s multiple comparisons test (d) (*P < 0.05, **P < 0.01, ***P < 0.001).
Thus, canonical type I IFN signalling via IFNAR was ruled out as playing a major role in the GB co-culture-mediated downregulation of basal type I IFN responses.
TGF-β contributes to GM-CSF-mediated downregulation of type I IFN signalling in monocytes interacting with glioblastoma cells
To mechanistically understand the attenuation of type I IFN responses in co-cultured monocytes, we examined the RNA-seq data obtained from indirect co-cultures after 24 h (Fig. 3f-I) in more detail using GSEA with the C2 curated gene set collection from MSigDB (Supplementary Table 7d). Herein, “(Foroutan) integrated TGF-β EMT up”30 emerged as the top enriched gene set in co-cultured monocytes compared with mono-cultured monocytes (Fig. 5a, left panel). Moreover, the same gene set was enriched in basal transcriptomes of LN229, T98G and U87 (REST) compared with U251 (Fig. 5a, right panel). Visualizing the genes from this gene set expressed in co-cultured monocytes relative to mono-cultured monocytes revealed that a substantial number of TGF-β targets increased in the co-culture, suggesting a robust TGF-β response (Fig. 5b; Supplementary Table 6d). Specifically, while clusters 1 and 2 appeared highly variable, but slightly increased in response to co-culture, cluster 3 contained 15 genes with a strong and consistent upregulation in co-cultures relative to mono-cultures. Importantly, the induction of TGF-β signalling in primary human monocytes co-cultured with GB cells was further substantiated when visualizing the identical signature in the original RNA-sequencing data (Fig. 1) from the direct co-cultures after 48 h (Supplementary Fig. 5a; Supplementary Table 6d). Of note, the clusters with the most upregulated targets (cluster 3) displayed a considerable overlap between direct (Supplementary Fig. 5a) and indirect (Fig. 5b) co-cultures, including genes such as matrix metalloproteinase 2 (MMP2), transglutaminase 2 (TGM2) and arachidonate 5-lipoxygenase activating protein (ALOX5AP). To investigate whether changes in TGF-β concentration were responsible for the observed signature, we measured TGF-β levels in supernatants from mono- and co-cultures, and in supernatants from different GB cell lines (Fig. 5c). Surprisingly, the presence of TGF-β was similar in mono- and co-cultures and there were also no notable changes among GB cell lines, indicating that other factors derived from GB cells, apart from TGF-β, might have a direct impact on the TGF-β signalling pathway. To find out if GM-CSF could be such a factor, we compared the “(Foroutan) integrated TGF-β EMT up” gene set in mono- and co-cultures treated with either IgG control or with GM-CSF neutralizing antibody (Supplementary Fig. 5b). While the TGF-β signature still appeared to be enriched in co-cultures compared with mono-cultures after IgG treatment, there was no significant enrichment after blockade of GM-CSF, strongly suggesting that GM-CSF is involved in GB-cell-mediated enrichment of TGF-β target genes. In line with this, phosphorylation of mothers against decapentaplegic homolog 2 (SMAD2), i.e. one of the major transcription factors of TGF-β-dependent signalling, was increased in co-cultures, but, to our surprise, barely after treatment with GM-CSF (Fig. 5d; Supplementary Fig. 5c). Stimulation with TGF-β (1 ng/ml) for 24 h and the specific interference with TGF-β signalling using the inhibitor SB431542 (10 µM) confirmed the TGF-β responsiveness of the proposed TGF-β targets (Supplementary Fig. 5d). Interestingly, ISGs also appeared to be highly sensitive to TGF-β, as their expression was strongly reduced after TGF-β stimulation, which was reversed by the inhibition of TGF-β signalling with SB431542 (Fig. 5e). To test whether TGF-β signalling might also contribute to the GM-CSF-mediated attenuation of ISG expression upon co-culture with GB cells, we treated monocytes co-cultured in the transwell set-up with LN229 or stimulated with GM-CSF (50 pg/ml) for 24 h with the TGF-β inhibitor SB431542 (10 µM) (Fig. 5f). Indeed, inhibition of TGF-β signalling slightly increased ISG expression in co-culture, but had only minor effects on ISG expression after GM-CSF treatment. In line with the failure to induce SMAD2 phosphorylation (Fig. 5d), GM-CSF did not induce or only slightly induced TGF-β targets compared with co-culture (Supplementary Fig. 5e). The observation that GM-CSF neutralization still sufficed to suppress the co-culture-induced TGF-β signature (Supplementary Fig. 5b, lower panel), suggests that exogenous recombinant GM-CSF and endogenous GB-cell-derived GM-CSF might differ with respect to their impact on the TGF-β cascade.
Fig. 5: TGF-β contributes to GM-CSF-mediated downregulation of type I IFN signalling in monocytes interacting with glioblastoma cells.
a, Gene set enrichment analysis of mono-cultured (MoCul) versus co-cultured (CoCul) monocytes, or of LN229, T98G and U87 (REST) versus U251 glioblastoma cells. b, Primary human monocytes were co-cultured with LN229 cells in transwell inserts for 24 h. RNA expression was determined by RNA-seq (n = 6). Heatmap visualizes log2FC (CoCul relative to MoCul) of genes obtained from gene set “(Foroutan) integrated TGF-β EMT-up”, categorized by k-means clustering. c, TGF-β protein concentrations in supernatants of mono-cultured (MoCul, cyan) or co-cultured (CoCul, blue) monocytes (with LN229 cells for 24 h) (left panel) (n = 6) or in supernatants of several glioblastoma cell lines (right panel) (n = 3) were determined by cytometric bead array. d, Primary human monocytes were mono-cultured (MoCul, cyan) or co-cultured with LN229 cells in transwell inserts (CoCul, blue) or treated with 50 pg/ml recombinant human granulocyte-macrophage colony stimulating factor (GM-CSF, grey) for 24 h (n = 10). Phosphorylated mothers against decapentaplegic homolog 2 (pSMAD2) protein expression was determined by Western blot analysis and normalized to total SMAD2/3 expression. e, Primary human monocytes were treated with 1 ng/ml recombinant human transforming growth factor-β (TGF-β, yellow) and an inhibitor for TGF-β signalling (SB431542, 10 µM) for 24 h (n = 6). f, Primary human monocytes were incubated with SB431542 (10 µM) or DMSO, and mono-cultured (MoCul, cyan) or co-cultured (CoCul, blue) with LN229 cells in transwell inserts, or treated with 50 pg/ml recombinant human granulocyte-macrophage colony-stimulating factor (GM-CSF, grey) for 24 h (n = 13). mRNA expression of selected interferon-stimulated genes (ISGs) (interferon-induced protein with tetratricopeptide repeats 1 (IFIT1), oligoadenylate synthetase 3 (OAS3), interferon-inducible 44 L (IFI44L)) was analysed by qPCR and normalized to TATA-box-binding protein (TBP) expression. All data are means ± SEM and were statistically analysed by paired t test (c, left panel), one-way repeated measures analysis of variance (ANOVA) with Dunnett’s multiple comparisons test (d), or two-way repeated measures ANOVA with Šídák’s multiple comparisons test (e, f) (*P < 0.05, **P < 0.01, ***P < 0.001; #P < 0.05, ##P < 0.01, ###P < 0.001 (compared with respective DMSO controls)). FDR, false discovery rate; NES, normalized enrichment score.
Thus, TGF-β signalling appears to be involved in the GM-CSF-mediated downregulation of type I IFN signalling in monocytes during their interaction with GB cells.
IFN-stimulated gene expression in monocyte-derived tumour-associated macrophages correlates negatively with active GM-CSF signalling in the glioblastoma tumour microenvironment in vivo
Having demonstrated that type I IFN responses are reduced in co-cultured, differentiating monocytes by GB-derived GM-CSF, in part via enhanced TGF-β signalling in vitro (Fig. 6a), we next aimed to validate these findings in tumour biopsies from patients with GB. Therefore, we performed mfIHC to investigate the expression of ISG15 (as a type I IFN target), CISH (as a marker for GM-CSF activity) and nuclear phosphorylated SMAD2 (pSMAD2) (as a proxy for active TGF-β signalling) in GB cells (glial fibrillary acidic protein (GFAP)+), MO-TAMs (ionized calcium-binding adapter molecule 1 (IBA1)+ transmembrane protein 119 (TMEM119)−) and MG-TAMs (IBA1+TMEM119+) in tissue microarrays from 40 patients with GB (Supplementary Fig. 6a). As expected, GB cells constituted the vast majority of cells within the biopsies (median: 66.35%). Although GFAP is also expressed in resident astrocytes, only a low number of astrocytes are expected in the available sections from tumour cores. Interestingly, MO-TAMs (9.24%) outnumbered MG-TAMs (1.97%) in most biopsies (Fig. 6b), which was even more prominent in GB of the mesenchymal subtype compared with classical and pro-neural subtypes (mesenchymal: 13.29% vs 1.49%, classical/pro-neural: 7.31% vs 2.3%) (Supplementary Fig. 7a). Across all biopsies, 8.94% and 18.84% of the cells were ISG15hi and CISHhi, respectively, yet a much larger proportion of all cells displayed signs of activated TGF-β signalling (nuclear p-SMAD2hi 40.41%) (Fig. 6c). Of note, the number of ISG15hi cells was substantially lower in the mesenchymal subtype (4.43%) than in classical and pro-neural subtypes (13.5%), whereas the proportions of cells with high CISH and pSMAD2 expression in the subtypes were rather similar (16% vs 21.8% and 40.41% vs 46.68%, respectively) (Supplementary Fig. 7b). While more than half of the MG-TAMs (53.06%) had high ISG15 expression, most GB cells and MO-TAMs showed low or no expression (6.49% and 9.63%, respectively) (Fig. 6d, left panel), which corroborates the scRNA-seq data, where a higher overall ISG signature expression was observed in MG-TAMs than in MO-TAMs (Fig. 1a). Again, the proportions of cells with high ISG15 expression in all three cell types were especially low in biopsies from the mesenchymal subtype (GB: 3.05%, MO-TAM: 6.84%, MG-TAM: 40.59%) compared with the other subtypes (GB: 13.85%, MO-TAM: 33.07%, MG-TAM: 66.15%) (Supplementary Fig. 7c, left panel). In contrast, markedly more MG-TAMs (40.64%) and GB cells (22.76%) than MO-TAMs (13.14%) expressed high levels of CISH, which was similar across all GB subtypes, hinting at tumour cells and microglia being potential sources of GM-CSF (Fig. 6d, middle panel; Supplementary Fig. 7c, right panel). In line with the overall high percentage of pSMAD2hi cells, the proportions of pSMAD2hi GB cells (43.54%), MO-TAMs (48.89%) and MG-TAMs (92.51%) were substantially higher than those of ISG15hi and CISHhi cells (Fig. 6d, right panel). High pSMAD2 levels further appeared to be present throughout the tissue sections (Supplementary Fig. 6a), suggesting generally elevated TGF-β signalling in GB. Strikingly, ISG15- and CISH-expressing cells localized to distinct, seemingly mutually exclusive regions of the tumour cores (Fig. 6e). Low Manders’ M1 (overlap of CISH signal with ISG15 signal) (0.29) and M2 (overlap of ISG15 signal with CISH signal) (0.27) correlation coefficients (MCCs) confirmed that ISG15- and CISH-expressing cells did not co-localize to a major extent (Fig. 6f). To further validate that ISG15 and CISH were not expressed in the same cells, we determined the proportion of TAMs expressing only one or both markers (Fig. 6g). Interestingly, while a substantially lower proportion of MO-TAMs expressed high levels of both ISG15 and CISH (1.6%) than only one of the markers (6% (ISG15) or 7.36% (CISH)), cells expressing single or both markers at high levels were rather evenly distributed in MG-TAMs (7.76% (ISG15), 9.61% (CISH) or 12.8% (both)). In line with previous observations, the proportion of ISG15hi tumour cells was low, regardless of co-expression with CISH (Supplementary Fig. 6b). To gain further insights into the impact of GM-CSF on type I IFN responses in GB specimens, we determined the minimum distances between each CISHhi cell and the next ISG15hi or ISG15lo cell for the different cell types. In line with the in vitro observations of monocytic versus microglial cells, the mean minimum distance between CISHhi cells and the next MG-TAM appeared to be independent of the ISG15 expression of the latter (Fig. 6h, right panel), whereas ISG15lo MO-TAMs and tumour cells were located significantly closer to CISHhi cells compared with ISG15hi cells (Fig. 6h, left panel; Supplementary Fig. 6c). Finally, to assess if the GM-CSF-dependent decrease in ISG expression specifically in MO-TAMs might have functional consequences for the GB TME, we stained the tissue microarray for the T cell marker CD3 to determine T cell recruitment (Supplementary Fig. 6d). As expected, T cell abundance was very low across all tumour samples (0.54%) (Supplementary Fig. 6e). Interestingly, the proportion of ISG15lo MO-TAMs correlated negatively with the proportion of T cells (Supplementary Fig. 6f), suggesting that T cell infiltration into GB partly depends on type I IFN responses specifically in MO-TAMs. We further analysed the minimum distance between each ISG15hi or ISG15lo MO-TAM and the next T cell and found that T cells were located substantially closer to MO-TAMs with high ISG15 than with low ISG15 expression (Fig. 6i).
Fig. 6: IFN-stimulated gene expression in monocyte-derived tumour-associated macrophages correlates negatively with abundant GM-CSF signalling in the glioblastoma tumour microenvironment in vivo.
a, Model of the modulation of type I interferon (IFN) responses in monocytes upon contact with granulocyte-macrophage colony-stimulating factor (GM-CSF)-secreting glioblastoma (GB) cells facilitated by transforming growth factor-β (TGF-β) signalling. b–i, GB tissue microarrays from 40 patients were analysed by multiplex fluorescent immunohistochemistry using antibodies against glial fibrillary acidic protein (GFAP), ionized calcium-binding adapter molecule 1 (IBA1), transmembrane protein 119 (TMEM119), interferon-stimulated gene 15 (ISG15), cytokine-inducible SH2-containing protein (CISH), phosphorylated mothers against decapentaplegic homolog 2 (pSMAD2) and cluster of differentiation 3 (CD3). b, Percentage of tumour cells and residual resident astrocytes (GB; GFAP+, blue), monocyte-derived tumour-associated macrophages (MO-TAM; IBA1+TMEM119-, orange), and microglial TAMs (MG-TAM; IBA1+TMEM119+, green), or of c, ISG15hi, CISHhi and pSMAD2hi cells per individual core (n = 40). d, Percentage of ISG15hi, CISHhi and pSMAD2hi cells among tumour cells, MO-TAMs and MG-TAMs. e, Representative image of one GB core displaying DAPI (white), CISH (purple), ISG15 (yellow) and the overlay. Scale bar 20 µm. f, Manders’ co-localization coefficient (MCC) for each individual core (n = 40). M1 depicts fraction of signal from CISH overlapping with ISG15 and M2 depicts fraction of signal from ISG15 overlapping with CISH. g, Percentage of MO-TAMs and MG-TAMs with high expression of ISG15, CISH or both. h, Mean minimal distance between CISHhi cells and ISG15hi or ISG15lo MO-TAMs or MG-TAMs. i, Mean minimal distance between ISG15hi or ISG15lo MO-TAMs and T cells. All data are presented as boxplots depicting median (line), interquartile range (box) and minimum/maximum (whiskers) and were statistically analysed using Friedman test (b, c, d, g), or Wilcoxon test (h, i) (*P < 0.05, **P < 0.01, ***P < 0.001).
Taken together, in line with the in vitro observations, ISG expression in MO-TAMs in GB in situ appears to be reduced by GM-CSF, likely produced by tumour cells or MG-TAMs. Specifically, MO-TAMs with low ISG expression due to GM-CSF signals in close proximity have a reduced capacity to recruit T cells, thereby inhibiting anti-tumour T cell responses in GB.
