


Human participants and cohorts
All samples analyzed in this study were collected using protocols approved by Institutional Review Boards (IRBs) at their respective centers. Collection centers included Stanford University and Stanford Health Care and the Veterans Affairs Palo Alto Health Care System (VA Palo Alto). BLCA cases were collected under IRB 55427. The control cases were collected under IRB 55427, 12597 or 18225. RCC samples were collected under IRB 12597. Prostate cancer samples were collected under IRB 49693. All participants provided written informed consent for use of their clinical data and biospecimens for research. In total, 683 urine samples were collected from 515 individuals. The clinical and demographic characteristics such as age, sex and smoking history of participants are presented in Supplementary Table 1 and consent was obtained to publish clinical and demographic characteristics. Sex and smoking history were self-reported and identified from medical records. Participants were not compensated for their participation in this study. Risk stratification was performed using the American Urological Association risk classification system, which is based on factors such as tumor grade, stage, size and the presence of carcinoma in situ61.
Cancer cohorts
Patients with BLCA, PRAD or kidney cancer enrolled at Stanford University or VA Palo Alto.
Noncancer cohorts
Individuals who were either asymptomatic, had hematuria or had lower urinary tract symptoms such as frequent urination, difficulty with urination or discomfort during urination enrolled at Stanford University or VA Palo Alto.
Validation cohorts
Patients with BLCA and controls without cancer enrolled at Stanford University or VA Palo Alto but not used for model training.
Formalin-fixed paraffin-embedded tumor extraction, quantification and library prep
For comparison of BLCA tumor RNA versus urine cfRNA and the UROMOL/BRS subtype analyses, hematoxylin and eosin-stained sections from formalin-fixed paraffin-embedded (FFPE) bladder tumor blocks were annotated by a pathologist to identify regions containing tumor. BLCA grade and stage for each patient with BLCA were obtained from clinical pathology reports and notes. Core punches were performed on FFPE blocks targeting regions containing tumor tissue and RNA was extracted using CELLDATA DNAstorm/RNAstorm 2.0 Combination Kit (Biotium) according to the manufacturer’s recommendation with minor modifications. The resulting eluate was incubated with 28 U DNase I (RNase-Free DNase Set, Qiagen) for 30 minutes at room temperature to remove DNA. RNA was subsequently isolated using the Zymo RNA Clean & Concentrator kit and stored at −80 °C. Concentration of RNA was quantified using Nanodrop or quantitative PCR (qPCR). For library preparation, 100 ng of RNA was input into library preparation. For samples with less than 100 ng of RNA, all extracted tumor RNA was used for library preparation (range 25–100 ng). Double-stranded complementary DNA (cDNA) was synthesized from tumor RNA using the NEBNext Ultra™ II RNA First-Strand Synthesis Module and Non-Directional Second Strand Synthesis Module (New England Biolabs). Double-stranded cDNA was treated with 100 U S1 nuclease (Thermo Fisher) for 30 minutes at room temperature to hydrolyze single-stranded regions. The KAPA Hyper Prep kit (Kapa Biosystems) was used to prepare libraries for sequencing, following the manufacturer’s instructions with slight modifications, as previously described62. Whole-coding transcriptome capture was performed using the Twist Biosciences Comprehensive Exome Hybridization kit, following respective manufacturer’s instructions. Captured libraries were sequenced using 2 × 150 bp paired-end reads on Illumina HiSeq4000 or NovaSeq6000 instruments. For tumor FFPE samples captured using the whole-coding transcriptome capture panel, we targeted ~30 million read pairs.
Urine collection and processing
First void urine samples were collected before any instrumentation into empty 120 ml urine collection cups (with or without subsequent addition of ethylenediaminetetraacetic acid to a final concentration of 5 mM) or Norgen Urine Collection and Stabilization Cups. Within 24 hours, urine supernatant was isolated using centrifugation at 2000g for 10 minutes. Urine supernatant was stored at −80 °C until cell-free nucleic acid isolation.
cfRNA extraction and DNA digestion
Q-Sepharose resin-based method
Cell-free nucleic acids were extracted from urine using a previously published protocol26 optimized for urine cfDNA extraction. The resulting eluate was incubated with 14 U DNase I (RNase-Free DNase Set, Qiagen) for 30 minutes at room temperature to digest DNA. The digested eluate was purified using the Zymo RNA Clean & Concentrator kit and stored at −80 °C.
Standard QIAamp method
Cell-free nucleic acids were extracted from urine using a previously published protocol62. The resulting eluate was incubated with 14 U DNase I (RNase-Free DNase Set, Qiagen) for 30 minutes at room temperature to digest DNA. RNA was purified using the Zymo RNA Clean & Concentrator kit and stored at −80 °C.
Modified QIAamp method
Cell-free nucleic acids were extracted from urine using the miRNA protocol from the QIAamp Circulating Nucleic Acid kit (Qiagen (range 1–20 ml)) with slight modification. The modifications include scaling reagents proportionally to accommodate >4 ml of urine, increasing lysis incubation time from 30 minutes to 60 minutes, and performing a double elution of the column to maximize RNA yield. The resulting eluate was incubated with 14 U DNase I (RNase-Free DNase Set, Qiagen) for 30 minutes at room temperature to digest DNA. The digested eluate was purified using the Zymo RNA Clean & Concentrator kit and stored at −80 °C.
cfRNA size evaluation and quantification
The urine cfRNA size distribution was analyzed using Agilent Bioanalyzer RNA 6000 Pico chip. Quantitative real-time polymerase chain reaction was used for quantification of cfRNA. An RNA-targeted amplicon was designed and generated by Elim Biopharmaceuticals to span the boundary between exons 1 and 2 in the housekeeping gene POLR2A (Forward 5′-TGAGTCCGGATGAACTGAAGC-3′, Reverse 5′-CCCTCAGTCGTCTCTGGGTA-3′). A DNA-specific primer pair was designed to cover a 78 bp transcriptionally silent region of chromosome 12 (Forward 5′-TACGGTTGGTCCTTTCTTCG-3′, Reverse 5′-TTTCCTTTGGGTCTGAATGC-3′). Reverse transcription was first performed using the High-Capacity cDNA Reverse Transcription kit (Applied Biosystems). qPCR was then performed using 2X Power SYBR Green PCR Master Mix (Thermo Fisher Scientific) on Applied Biosystems 7500 Fast Real-Time PCR or QuantStudio 7 Pro instruments. Universal Human Reference RNA (Thermo Fisher Scientific) was run in parallel to generate a standard curve, and cfRNA concentrations were calculated by comparing the sample’s POLR2A Ct value to the standard curve. If DNA was detected using the DNA-specific primer, DNA digestion, clean-up and quantification was repeated.
cfRNA library preparation and sequencing
uRARE-seq
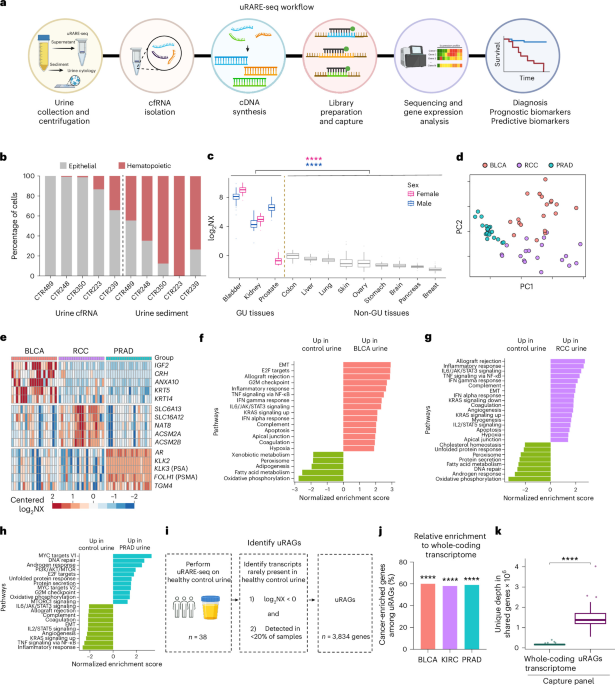
We targeted an input mass of 500 pg cfRNA. For samples with less than 500 pg, all extracted cfRNA was used for library preparation (range 8–500 pg). Double-stranded cDNA was synthesized from cfRNA using the NEBNext Ultra™ II RNA First-Strand Synthesis Module and Non-Directional Second Strand Synthesis Module (New England Biolabs). Double-stranded cDNA was treated with 100 U S1 nuclease (Thermo Fisher) for 30 minutes at room temperature to hydrolyze incomplete (single-stranded) regions. The KAPA Hyper Prep kit (Kapa Biosystems) was used to prepare libraries for sequencing, following the manufacturer’s instructions with slight modifications, as previously described62. Whole-coding transcriptome capture was performed using the Twist Biosciences Comprehensive Exome Hybridization kit, following the manufacturer’s instructions. Single-plex capture using the uRAG capture panel (see ‘uRAG-focused capture panel design’ for details) was performed using the Twist Biosciences Hybridization kit (Supplementary Table 3). Captured libraries were sequenced using 2 × 150 bp paired-end reads on Illumina HiSeq4000 or NovaSeq6000 instruments. For urine samples captured using the whole-coding transcriptome panel, we targeted ~30 million read pairs. For urine samples captured using the uRAG panel, we targeted 50–60 million read pairs.
Mapping, deduplication and quality control for uRARE-seq and tumor FFPE RNA
FASTQ files were demultiplexed using a custom pipeline, as previously described62. Fastp (v0.20.0) was used to trim the first 10 bases from the 5′ end of Read 1 and the 3′ end of Read 2 and to remove low-quality or short (< 35 bp) read pairs from each sample. Remaining high-quality reads were aligned to the reference transcriptome (GENCODE v27) and to the human genome (hg19) using STAR 2-pass63 (v2.7.0). PCR duplicates were removed from both transcriptome-aligned and genome-aligned files using a custom barcoding approach. Deduplicated reads were used for gene-level expression estimation using RSEM (v1.2.28)64.
Quality control was assessed using the RNASeQC package (v2.3.5), focusing on read mapping quality, mapping rates and rates of exonic, intronic, intergenic and ribosomal RNA reads. In addition, DNA contamination was estimated by calculating the percentage of reads that map to intronic sequences out of the total number of reads that map to exonic sequences.
Gene expression normalization
RSEM expected counts for captured genes were used for expression analyses (tximport R package v1.22). Counts were first normalized using the TMM method, which accounts for sample-to-sample variation in library size and transcriptome complexity (edgeR R package v3.36). Log-transformed and normalized expression values are referred to as ‘log2NX (normalized expression)’.
Differential gene expression analysis
Differential gene expression analysis was performed using DESeq265 (DESeq2 R package v1.34). GSEA was performed using the fgsea R package (v1.20). GSEA was performed using hallmark gene sets from MSigDB66,67. For GSEA, the hallmark pancreas beta cells and bile acid metabolism gene sets were excluded because these pathways have been shown to be nonspecific68 and/or were not deemed relevant.
CIBERSORTx deconvolution
CIBERSORTx deconvolution was performed on normalized gene expression data using the previously published TM4 gene signature matrix60.
Tissue and cell-type gene signatures
Tissue signatures were identified using gene expression data from the Genotype-Tissue Expression (GTEx)69 project. Gene-level read counts generated by the UCSC Toil RNA sequencing bioinformatic pipeline were accessed in the UCSC Xena repository70. Gene expression was TMM-normalized. The normal tissue types that were evaluated from GTEx included bladder (n = 9), brain (n = 1,107), breast (n = 168), colon (n = 261), esophagus (n = 598), kidney (n = 24), liver (n = 97), lung (n = 241), ovary (n = 79), pancreas (n = 145), prostate (n = 86), skin (n = 497), stomach (n = 167) and whole blood (n = 290). Genes were defined as tissue-enriched if expression was 5-fold higher in each tissue compared to all other tissues and if average tissue log2NX was greater than zero.
For cell-type signatures, GU organs (kidney and bladder) and immune-related cell-type signatures were obtained from the PanglaoDB single-cell RNA sequencing database. Since prostate cells were not represented in PanglaoDB, prostate cell-type signatures were obtained from gene expression data downloaded from Tabula Sapiens71. Genes were defined as cell-type-enriched if their expression was 5-fold higher in the cell type compared to all cells in other major compartments (epithelial, endothelial, immune and stromal) and 2-fold higher in each cell subtype compared to cells within its own compartment.
For cancer-enriched genes, the cancer tissue types analyzed from the Cancer Genome Atlas (TCGA) included BLCA (n = 344), kidney (n = 350) and PRAD (n = 473). Cancer-enriched genes were defined as genes that are 5-fold higher in each cancer type compared to matched normal tissue expression data obtained from GTEx.
uRAG-focused capture panel design
To identify uRAGs, urine cfRNA gene expression data were analyzed from reference controls (n = 38) generated with the whole-coding transcriptome urine cfRNA-Seq method. Expression was TMM-normalized. RAGs were defined as genes that were expressed in less than 20% of samples and for which average log2NX was less than zero. In total, there were 3,834 uRAGs. RAGs are listed in Supplementary Table 2. Next, expression uniformity was calculated in cfRNA using the Gini coefficient, and endogenous control genes were selected from housekeeping genes72 with a Gini <0.1. In addition, BLCA, PRAD and kidney cancer-associated genes from the literature were manually curated for inclusion in the panel, including genes that are recurrently mutated or rearranged in BLCA, PRAD and kidney cancer. In total, the RAG-focused capture panel consists of 4,782 unique genes (listed in Supplementary Table 3).
Generating machine learning models using elastic net
BLCA detection model
Elastic net logistic regression was used to train a urine cfRNA-based model to distinguish patients with BLCA (n = 151) from controls (n = 100). Nested 10-fold cross-validation was used to tune hyperparameters and estimate model performance (Sklearn Python package). Starting with all targeted genes, feature selection included:
-
(1)
Removing genes that are differentially expressed between male and female reference controls (n = 38)
-
(2)
Removing genes located on sex chromosomes
-
(3)
Keeping genes that are differentially expressed between public BLCA RNA-Seq from TCGA (n = 407; downloaded from the UCSC Xena repository70 and TMM-normalized) and reference control urine cfRNA (n = 38) using P < 0.05 and absolute log2 fold change of 3 as the cut point
-
(4)
Removing genes with an average log2NX > 0 in GTEx blood samples and that are expressed in more than 20% of GTEx blood samples
-
(5)
Removing immune-related genes included in the previously published CIBERSORTx LM22 gene list60
-
(6)
Manually adding back ‘TERT’ and ‘IGF2’
The list of genes (n = 381) and their coefficient values for the BLCA detection model is listed in Supplementary Table 4.
BLCA muscle invasion and BLCA grade models
For BLCA muscle invasion and BLCA grade models, only BLCA urine cfRNA samples that were detected in the BLCA detection model were considered for analysis. Elastic net logistic regression was used to train a urine cfRNA-based model to distinguish NMIBC (n = 116) from MIBC (n = 28) and LG BLCA (n = 31) from HG BLCA (n = 113) urine samples. Nested 10-fold cross-validation was used to tune hyperparameters and estimate model performance (Sklearn Python packages). Starting with all targeted genes, feature selection included:
-
(1)
Removing genes that are differentially expressed between male and female reference controls (n = 38)
-
(2)
Removing genes located on sex chromosomes
-
(3)
Keeping genes that are differentially expressed between:
-
(a)
For BLCA muscle invasion model: public NMIBC tumor RNA-Seq data from UROMOL (n = 535; downloaded from Lindskrog et al.30 and TMM-normalized) and public MIBC RNA-Seq from TCGA (n = 407; downloaded from the UCSC Xena repository70 and TMM-normalized) using P < 0.05 and absolute log2 fold change of 3 as the cut point
-
(b)
For BLCA grade model: differentially expressed genes between public LG BLCA and HG BLCA from UROMOL (n = 535; downloaded from Lindskrog et al.30 and TMM-normalized)
-
(a)
-
(4)
Removing genes with an average log2NX > 0 in GTEx blood samples and that are expressed in more than 20% of GTEx blood samples for BLCA grade model
-
(5)
Removing immune-related genes included in the previously published CIBERSORTx LM22 gene list60
-
(6)
Manually adding back ‘KRT14’ for BLCA muscle invasion model
The list of genes (invasion model, 124; grade model, 294) and their coefficient values for the grade and muscle invasion classifier are listed in Supplementary Table 4.
Hypergeometric analysis of overlapping grade-associated genes in urine and tumor tissue
To determine the overlap between grade-associated genes in tumor tissue and urine, we first identified genes that were differentially expressed between LG and HG NMIBC tumors in the UROMOL cohort30 and were included in the uRAG panel (log2 fold change > 1 and P < 0.05), yielding 57 LG-associated and 185 HG-associated tumor genes. We next identified genes differentially expressed in urine cfRNA from patients with LG versus HG NMIBC, yielding 158 LG-associated and 457 HG-associated urine genes. We then performed a hypergeometric test to assess the statistical significance of the observed overlap between tumor and urine gene sets, which comprised 33 LG-associated and 160 HG-associated genes. The total background gene set consisted of the 4,782 genes included in the uRAG panel.
Limit of detection estimation using BLCA tumor RNA spiked into urine cfRNA
To determine the LOD95 of uRARE-seq, we performed in silico spiking experiments using sequencing data from three healthy control urine samples and three BLCA tumor RNA samples generated using the uRAG-focused panel. Reads were randomly subsampled from these samples and combined in prespecified cancer fractions (range 0.001–50% allele frequency), determined based on the average somatic mutations’ allele fraction identified using uCAPP-Seq27 of the same BLCA RNA samples. The BLCA detection model described above was used to score each spiked-in sample for the uRAG capture panel. The limit of blank was calculated from the average and standard deviation of healthy cfRNA controls and was set as the detection threshold for remaining spikes. Logistic regression was employed to model the relationship between cancer spike-in fraction and BLCA detection, and LOD95 was defined as the cancer fraction where 95% of the spiked-in samples are detected.
Urine cytology
For urine cytology analysis, ‘negative’ or ‘atypical’ results were considered clinically negative and ‘suspicious’ or ‘malignant’ results were considered clinically positive73.
Detection thresholds and classifying BCG molecular responses
The BLCA detection score thresholds for calling a sample positive were set based on specificity in noncancer controls in the training cohort. For modeling early detection applications using pretransurethral resection of bladder tumor samples, the threshold was set at 90% specificity (0.249). For MRD detection, the threshold was set at 99% specificity (0.83) for pre-BCG samples to account for potential expression changes due to recent surgery and 95% specificity (0.543) for post-BCG samples since they were months removed from surgery and BCG treatment.
Based on changes of BLCA detection scores, we defined BCG molecular response classes based on the following criteria:
-
(1)
mCR after surgery: patients with BLCA detection score below the detection threshold after surgery (but before adjuvant therapy)
-
(2)
mCR after BCG: patients with detectable BLCA detection score prior to BCG induction who, after completing BCG induction, have undetectable BLCA detection score
-
(3)
mRD: patients with detectable BLCA detection score following BCG induction
utDNA analysis
For the comparisons between uRARE-seq and tumor-naive utDNA detection, mutation detection was performed using the tumor-naive uCAPP-Seq method from Dudley et al.26. For the comparison with tumor-informed utDNA detection, utDNA analysis was performed using RePhyNERX-enhanced uCAPP-Seq method (field-effect-informed) described in Shi et al.27. Briefly, the RePhyNERX removes likely field-effect mutations by analyzing the relative frequency of a somatic mutation in tumor tissue compared to all other mutations and compares this to its relative frequency in a urine sample. If the mutation is present at a higher relative frequency in a urine sample than expected, it is removed from consideration for MRD monitoring.
T cell clonality analysis
To facilitate T cell receptor analysis, the uRAG capture panel contains baits targeting the CDR3-proximal edges of the V genes and the junctions between the J and C genes. CDR3 sequences were analyzed using the SABER pipeline, as previously described74.
Response prediction model signatures
Elastic net logistic regression was used to train a model to distinguish between no mCR and mCR to BCG using presurgery samples from the BCG training cohort. Leave-one-out cross-validation using the LeaveOneOut function (Sklearn) was used to evaluate the out-of-fold predictive performance of the model. For feature selection, in each leave-one-out cross-validation fold, differential gene expression (DESeq2) and gene set enrichment analysis (fgsea) were performed to identify pathway-informed leading-edge genes in the training fold cohort. Features considered for model training were limited to leading-edge genes from significant molecular signatures database pathways that are proliferation- and immune-related and genes identified from public literature, including:
-
Interferon gamma response signatures33
-
T cell signatures33,34,35,36,37
The R package Survminer was used to select the optimal cutoff (0.5) based on the BCG training cohort. The list of genes (n = 623) and their coefficients for the response prediction model classifier are listed in Supplementary Table 4.
Statistics and reproducibility
All statistical analyses were carried out using R v4.1.3 or Prism. Statistical tests used throughout the paper included Fisher’s exact test, Mann–Whitney U test, Student’s t test, Pearson correlation and Friedman test. Kaplan–Meier curves were compared by the log-rank test, which was also used to derive hazard ratios. Unless P values are listed, significance labels used in the paper indicate: *P < 0.05; **P < 0.01; ***P < 0.001 and ****P < 0.0001. Unless otherwise specified, confidence intervals depict 95% confidence. No statistical method was used to predetermine sample size. No data were excluded from the analyses. The experiments were not randomized. The investigators were not blinded to allocation during experiments and outcome assessment.
Reporting summary
Further information on research design is available in the Nature Portfolio Reporting Summary linked to this article.
