


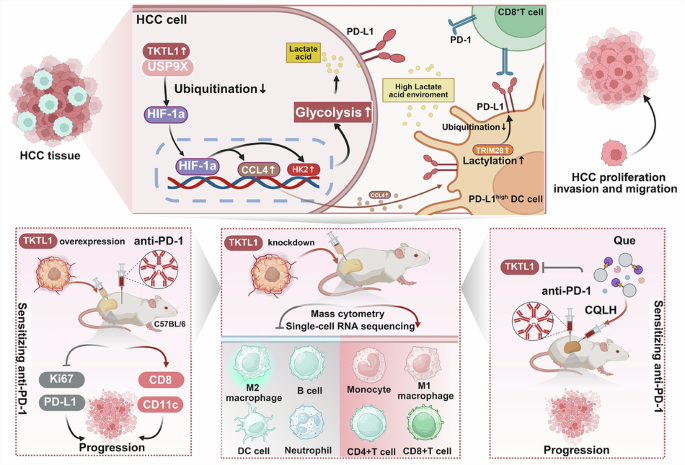
Clinical specimens and patient cohorts
Tumor and adjacent non-tumorous tissues were collected from 98 HCC patients undergoing curative resection at the Hepatobiliary Surgery Center of the First Affiliated Hospital of Nanjing Medical University (2016-2024). All patients provided written informed consent under Institutional Review Board approval (2019-SR-332). Fresh tissue samples from the NCT04297202 trial cohort were stratified into responders and non-responders according to mRECIST criteria. Subsets of these fresh specimens were subjected to multi-omics analyses: RNA sequencing was performed on 6 responders and 4 non-responders, while proteomic profiling included 5 responders and 7 non-responders.
RNA and proteomics sequencing
We processed cancer samples with Trizol for lysis, followed by RNA sequencing. The RNA sequencing data was then evaluated by Berry Genomics (Beijing, China). For proteomics sequencing, cell pellets/tissue were suspended on ice in 200 μL lysis buffer. Peptides were labeled with TMT (Tandem Mass Tag) reagents according to the manufacturer’s instructions (Thermo Fisher Scientific, USA). TMT-labeled peptides mixture was fractionated using a Waters XBridge BEH130 column on Agilent 1290 HPLC operating at 0.3 mL/min. Buffer A consisted of 10 mM ammonium formate and buffer B consisted of 10 mM ammonium formate with 90% acetonitrile; both buffers were adjusted to pH 10 with ammonium hydroxide. The fractions were dried for nano LC-MS/MS analysis (Shanghai Bioprofile, China).
Immunohistochemistry (IHC) and immunofluorescence (IF)
The paraffin-embedded sections underwent a process of removing wax and rehydration in preparation for immunohistochemical analysis. The activity of peroxidase was effectively blocked by a 3% hydrogen peroxide solution from Beyotime in China. Following an overnight incubation at 4 °C with primary antibodies, the tissue sections were treated with a biotinylated secondary antibody. Subsequently, the sections were exposed to a combination of streptavidin-horseradish peroxidase (Beyotime, China).
In the process of conducting fluorescent immunohistochemistry, the initial step involved fixing the sample at room temperature using a 4% solution of paraformaldehyde for a duration of 20 min. Subsequently, the sample was subjected to immersion in a 0.05% solution of Triton X-100 for a period of 5 min. Following these treatments, the samples were sealed overnight in a solution containing 2% BSA PBS and were exposed to primary antibodies at a temperature of 4 °C. The treated samples were then linked with either Alexa Fluorite or HRP (Beyotime, China) at room temperature. A combined secondary antibody was applied and left to incubate for 1 h. To maintain the integrity of the nucleus, DAPI staining (Beyotime, China) was utilized. Subsequent to drying, images were captured utilizing a laser scanning confocal microscope from Zeiss, Germany. A detailed list of the antibodies employed in this investigation can be found in supplementary table 2.
Animal models
The experimental protocols were approved by the Institutional Animal Care and Use Committee (IACUC) of the First Affiliated Hospital of Nanjing Medical University (Approval ID: IACUC-2404094). All procedures complied with the institutional guidelines established by the Nanjing Medical University Animal Experiment Center. To mitigate potential biases, all experimental procedures employed stratified randomization of animals across treatment groups based on baseline tumor volume/body weight. All mice were 6-week-old C57BL/6 mice at the start of experiments, with an initial body weight range of 18–22 g. Processing order (e.g., drug administration, measurements) was systematically rotated daily. Cage position within racks was alternated every 48 h to eliminate microenvironmental gradients (light/temperature). Outcome assessments (tumor measurements, behavioral tests) were performed by blinded operators using standardized protocols. Experimental mice were included based on verified tumor establishment (subcutaneous: 100–150 mm³; orthotopic/PDX: imaging-confirmed lesions; chemically induced: histopathological HCC confirmation), baseline health (body weight loss ≤10%, no systemic distress), and successful PDX engraftment (F1). Animals were excluded for health deterioration (body weight loss >20%, spontaneous ulceration/necrosis), treatment-related complications (nanosystem toxicity, inadequate drug uptake), or technical failures (implantation errors, poor biodistribution). All exclusions required objective validation (imaging/histology/behavioral scoring), with immediate euthanasia if ethical thresholds (body weight loss >20% or severe distress) were breached. For survival curve statistics, we defined a 20% or more weight loss, severe mobility impairment, or a tumor size exceeding 1.5 cm as the humane survival endpoint.
Subcutaneous tumor model establishment
Six-week-old C57BL/6 mice were subcutaneously inoculated with Hepa1-6 cells (1 × 10⁶ cells/mouse) transduced with lentiviral vectors for TKTL1 overexpression (OE-TKTL1) or empty vector control (OE-VE), subsequently stratified into four tumor-bearing experimental groups (n = 4/group): OE-VE, OE-TKTL1, OE-VE+anti-PD-1, and OE-TKTL1+anti-PD-1 (The random grouping scheme was generated by using SPSS to produce a random number table and then matching it with the ear tag reference table), with anti-PD-1 monoclonal antibody (10 mg/kg) administered intraperitoneally three times per week commencing on day 8 post-implantation.
Orthotopic transplantation model
Lentivirus-transduced TKTL1-overexpressing (OE-TKTL1) or empty vector control (OE-VE) Hepa1-6 cells suspended in 100 μL sterile PBS were subcutaneously implanted into the right flank of 6-week-old C57BL/6 mice, with subsequent humane euthanasia upon xenografts reaching 800 mm³; excised tumors underwent meticulous dissection to remove necrotic and stromal tissues, whereafter viable specimens were aseptically minced into 2 mm³ fragments and orthotopically engrafted into hepatic parenchyma of recipient mice (n = 5/group) under isoflurane anesthesia, followed by randomization into four cohorts: OE-VE, OE-TKTL1, OE-VE + anti-PD-1, and OE-TKTL1 + anti-PD-1 (The random grouping scheme was generated by using SPSS to produce a random number table and then matching it with the ear tag reference table), with weekly tumor monitoring via in vivo bioluminescence imaging until terminal endpoint, where final tumor burden was quantified by digital caliper measurements using ellipsoid volume formula, supplemented by necropsy documentation, gravimetric analysis, and histopathological assessment.
DEN&CCL4-induced orthotopic hepatocarcinogenesis model
C57BL/6 mice underwent diethylnitrosamine (DEN, 25 mg/kg in 0.9% NaCl, 10 μL/g injection volume) priming via intraperitoneal administration, with pre-procedural identification through toe-clipping and comprehensive injection logs. At 4 weeks of age, subjects transitioned to ear-tag identification with concomitant fasting body weight documentation. Chronic liver injury was induced from week 4 through twice-weekly intraperitoneal delivery of 10% CCl4 (0.1 mL/mouse in corn oil vehicle) over 10 consecutive weeks, with monthly fasting weight monitoring. Hepatic tumorigenesis was longitudinally tracked via MRI commencing at 20 weeks of age. Upon confirmation of orthotopic hepatocellular carcinoma establishment, mice received single-stranded AAV-TKTL1 or control vectors through tail vein systemic delivery (The random grouping scheme was generated by using SPSS to produce a random number table and then matching it with the ear tag reference table). Pharmacological interventions commenced 7 days post-viral transduction under stratified randomization, with tumor progression quantified through MRI volume measurements.
The PDTX model
All experiments were conducted using NCG mice. Two qualified xenografts were thawed and propagated subcutaneously in immunodeficient hosts until reaching 800 mm³, followed by humane euthanasia. Excised tumors underwent macro-dissection to remove necrotic cores and peritumoral stromal components, with viable tissues aseptically fragmented into 2 mm³ implants for secondary engraftment. When donor-derived tumors reached 80–120 mm³, recipient mice were stratified into cohorts (n = 3 /group, n = 5/group for OS) through block randomization balancing tumor burden and body weight (The random grouping scheme was generated by using SPSS to produce a random number table and then matching it with the ear tag reference table). On cohort assignment day (D0), human PBMCs were adoptively transferred via tail vein injection, with therapeutic interventions initiated 24 h post-PBMC infusion according to protocol-defined dosing schedules. Longitudinal monitoring included biweekly tumor volumetry and body weight tracking at critical phases: pre-engraftment, pre-treatment, during treatment cycles, and pre-termination. Immune reconstitution was validated through serial flow cytometric analysis of peripheral hCD45+ populations at 2-day post-PBMC injection and terminal timepoints. Terminal endpoints comprised tumor excision, gravimetric analysis, macroscopic documentation, and histopathological correlation studies for efficacy evaluation.
Single-cell RNA sequencing and mass cytometry analysis in mouse tumor tissues
Single-cell RNA sequencing (scRNA-seq) was performed on dissociated tumor tissues from C57BL/6 mice (sh-NC and sh-TKTL1 groups). Following tissue dissociation (Tumor Dissociation Kit, Miltenyi Biotec) and viability assessment, single-cell suspensions were processed using the MobiNova®-100. Data were analyzed with Cell Ranger and Seurat for clustering and annotation using canonical marker genes.
For mass cytometry (CyTOF), the treatment method of mouse tissue was referred to Miltenyi Biotec mouse tumor isolation Kit. Percoll removed impurities and split red. CyTOF staining steps included 194Pt staining–Fc block–surface antibody staining–overnight DNA staining–intracellular antibody staining–data collection on computer.
Cell cultures
Mice HCC cells (Hepa1-6) and human HCC cells (Hep-3B and HCC-LM3) were supplied by the Cell Bank of Type Culture Collection. Hepa1-6 cells, Hep-3B and HCC-LM3 cells were all cultured with DMEM medium (Gibco, USA). At 37 °C and 5% CO2 in an incubator, all the cells were supplied with 10% fetal bovine serum (Gibco, USA) and 1% penicillin/streptomycin (Gibco, USA).
DC2.4 murine dendritic cells were maintained in RPMI-1640 supplemented with 10% heat-inactivated FBS, 20 ng/mL recombinant murine GM-CSF, 100 U/mL penicillin, and 100 μg/mL streptomycin at 37 °C/5% CO₂, with media replenished every 48 h. Hepa1-6 murine hepatocellular carcinoma cells were cultured in DMEM containing 10% FBS under identical conditions. CD8⁺ T cells were isolated from C57BL/6 mouse spleens using a CD8⁺ T Cell Isolation Kit (Miltenyi Biotec, Germany) and pre-activated for 48 h in RPMI-1640 complete medium with 2.5 μg/mL anti-CD3/CD28 antibodies and 100 U/mL recombinant murine IL-2. All cell lines were authenticated before the start of the experiment and were regularly tested for infections, including mycoplasma.
Cell transfection
TKTL1 expression was downregulated in human HCC cell lines by using shRNA (Genechem, China). For a whole day, we incubated 1 × 10⁵ cells in each well of a six-well plate with 2 ml of medium. Subsequently, the medium was increased to 1 ml, and 40 µL of polybrene (Sigma-Aldrich, USA) were combined with the relevant quantity of virus. Following a 12- to 16-h incubation period, the cells were cultivated in standard media and puromycin was added for screening (Beyotime, China). Overexpression experiments involved OE-TKTL1 lentivirus in mice or HCC cells were performed. We used qRT-PCR and Western blotting assays to monitor the transfection effectiveness. Sequences used in this study were listed in supplementary table 1.
TRIM28 knockdown was achieved by transfecting species-specific constructs: mice-targeting siRNA (Transheep, China) into murine DC 2.4 cells. Cells were plated at 1 × 10⁵ density per well in 6-well plates containing 2 ml culture medium and incubated for 24 h. The medium was then exchanged for 1 ml fresh medium supplemented with viral particles and 40 µL polybrene (Sigma-Aldrich, USA). Following 12–16 h incubation, cells underwent puromycin selection in standard culture medium. Transduction efficiency was confirmed through qRT-PCR and Western blot analysis. Sequences used in this study were listed in supplementary table 1.
RNA extraction and qRT-PCR
The Cell/Tissue Total RNA Isolation Kit (Vazyme, China) was used to extract total RNA from tissues and cells. We converted RNA into cDNA using a reverse transcription kit (Vazyme, China). Supplementary table 1 includes a list of all primer sequences. The levels of mRNA expression were normalized using the internal control (β-actin).
Western blotting
Proteins were extracted from the cells using RIPA lysis buffer (Sigma-Aldrich, USA) containing protease and phosphatase inhibitor (Beyotime, China), separated by 10% SDS-PAGE (Sigma-Aldrich, USA), and transferred to polyvinylidene fluoride (PVDF) membranes (Millipore, USA) as per the manufacturer’s operating manual. After blocking the membranes for 30 min with blocking buffer (NCM, China), the membranes were incubated with primary antibodies for a whole night at 4 °C. The ECL signals were seen using an ECL Kit (NCM, China) following a 1-h incubation period with the corresponding secondary antibodies and three TBST-buffered saline washings every 10 min. Antibodies used in this study were listed in Supplementary table 2.
Cell proliferation assay
In the clone forming experiment, HCC cells were seeded in 6-well plates at a density of 1000 cells/well. After 10 days, the cells were fixed using methanol, followed by staining with Giemsa (Sigma-Aldrich, USA), and the colonies were then imaged and counted.
Using Cell-Light 5-ethynyl-2’-deoxyuridine (EdU) DNA Cell Proliferation Kit (RiboBio, China), we performed the EdU experiment to assess cell proliferation. We plated 5 × 10⁴ HCC cells in 24-well plates, and the cells were then cultured for 24 h. The cell lines were fixed with 4% paraformaldehyde after incubating them with 50 mmol/L EdU solution for 2 h. Following the manufacturers protocol, we treated the cell lines with Apollo Dye Solution and DAPI, respectively. EdU cell lines were captured and counted under Olympus FSX100 microscope (Olympus, Japan).
Transwell assay
By adhering to the manufacturer’s guidelines, HCC cells were placed in the upper chambers with 200 μl of serum-free RPMI 1640 medium (Gibco, USA). In preparation for the invasion and migration assays, the transwell chamber (Corning, USA) was coated with a matrigel mixture (BD Biosciences, USA). The bottom chamber was filled with DMEM medium (Gibco, USA) and 10% FBS (Gibco, USA) to serve as a cell attractant. Following a 48-h incubation period, the top chambers were fixed and stained with crystal violet dye (Beyotime, China) for 15 min. Cell counting and imaging were conducted in 3 different fields for visualization purposes.
Wound healing assay
HCC cells were evenly distributed in 6-well culture plates. A standard 20-µl pipette tip was employed to create deliberate wounds on the confluent cell layer. The controlled elimination process aimed to segregate debris and floating cells at the well’s base. Subsequently, a serum-free medium was introduced, and the plate was subjected to a 37 °C incubation. The width of the scratch was measured using an inverted microscope and images were captured at 0 and 48 h. This experimental procedure was repeated thrice to assess both the initial wound width and the extent of cell migration.
Flow cytometry detection and analysis
Single-cell suspensions were prepared from spleens, lymph nodes, and tumor tissues. Initially, all cells were stained with Live/Dead dye (BioLegend) at 4 °C for 30 min. Regarding surface staining, cells were collected and washed twice with phosphate-buffered saline (PBS). Subsequently, they were stained in PBS supplemented with 2% fetal bovine serum (FBS) using antibodies at the recommended dilution on ice for 30 min in the dark. Prior to flow cytometry analysis, the cells were washed twice with PBS. For the intracellular staining of cells to quantify cytokines, cells were harvested and washed twice with PBS. They were then fixed, permeabilized, and stained using the Intracellular Fixation & Permeabilization Buffer set (eBioscience, 88 – 8824) in accordance with the manufacturer’s protocol. Before fluorescence-activated cell sorting (FACS) analysis, the stained cells were washed twice with PBS. Antibody information is detailed in Supplementary table 2. Cells were initially gated based on forward scatter (FSC) and side scatter (SSC) characteristics to exclude debris. Subsequently, FSC – area (FSC – A) and FSC – height (FSC – H) were used for gating, followed by SSC – A and SSC – H to eliminate non-singlet cells. Target cells were then gated to obtain the population of interest through specific staining. Data were acquired using the CytoFLEX S system (Beckman) and analyzed with FlowJo (v.10.5.3).
Metabolomics sequencing and detection
A concoction of methanol, acetonitrile, and water was prepared in a 2:2:1 proportion. After cooling, 1 ml of this blend was sonicated for 60 min in ice water. The sample then underwent an hour-long incubation at −20 °C. Centrifugation at 14,000 × g at a temperature of 4 °C was performed for 20 min to facilitate LC-MS analysis. The evaluation of metabolomics utilized a UPLC-ESI-Q-Orbitrap-MS system (UHPLC, Shimadzu Nexera X2 LC-30AD, Shimadzu, Japan), complemented by Q-Exactive Plus (Thermo Scientific, USA). Data were obtained via electrospray ionization (ESI) in both positive and negative modes. Quality control (QC) samples were made by combining all aliquots, followed by data normalization. Every six samples saw the injection of QC and blank samples (75% acetonitrile in water).
Metabolic flux analysis
Cells were cultured in medium containing uniformly labeled [U-¹³C] glucose for 8–12 h to achieve isotopic steady-state. Upon reaching metabolic equilibrium, pre-cooled extraction solvent was added to the culture. The mixture was vortexed, immediately snap-frozen in liquid nitrogen, and subjected to sonication. Following low-temperature incubation for ≥1 h, the samples were centrifuged at low temperature. The resulting supernatant was collected, lyophilized, and reconstituted in solvent. After thorough dissolution, the solution was centrifuged again under cold conditions, and the final supernatant was transferred to LC-MS vials for analysis. LC-MS signals were matched to corresponding metabolites by comparison with a standard compound database and/or via algorithm-based prediction.
Seahorse assay
The extracellular flux analyzer, Seahorse XF96 (Agilent Seahorse XF Technology, USA), was used to assess the glycolytic activity of the HCC cells. In Seahorse XF96 well plates, cells were seeded at 12,000 cells per well. Right before the assays, these cells were changed from a culture medium to an assay medium and incubated for 1 h at 37 °C. Under baseline conditions and with the addition of Glucose (Agilent, USA), Oligomycin (Agilent, USA), and 2-deoxyglucose (Agilent, USA), the extracellular acidification rate (ECAR) was determined. By graphing the total ECAR as a function of time (mpH/min), respectively, in the XF96 Glycolysis report generator, the total ECAR was calculated. Cells were immediately trypsinized and normalized individual well rate data to protein concentration after the completion of the experiment.
NADPH/NADP⁺ ratio in tumor cells
Human hepatocellular carcinoma cells were cultured in DMEM high-glucose medium with 10% FBS, 100 U/mL penicillin and 100 μg/mL streptomycin at 37 °C with 5% CO₂. Logarithmic phase cells (70–80% confluence) were lysed with pre-cooled RIPA buffer on ice, centrifuged, and the supernatant was collected. NADPH/NADP⁺ contents were detected using Promega kit (G9081): standard curves were prepared, 10 μL supernatant was added to 96-well plates (3 replicates), followed by detection buffer and enzyme mixture, incubated in dark for 30 min, and absorbance was measured at 560 nm. The NADPH/NADP⁺ ratio was calculated from standard curves, with 3 independent repeats
CUT&Tag assay
Freshly harvested cells were counted and aliquoted into microcentrifuge tubes. Following low-speed centrifugation, the supernatant was discarded. Cells were resuspended in Digitonin Permeabilization Buffer and gently agitated. Concanavalin A-coated magnetic beads (ConA beads), pre-equilibrated in Binding Buffer, were added dropwise to the suspension. Samples were gently inverted for 5–10 min. After magnetic separation and buffer removal, cells were resuspended in ice-cold Antibody Buffer. Tubes were incubated on a rotator at room temperature for 2 h. Primary antibody was removed, and cells were washed. A 1:100 dilution of secondary antibody in Digitonin Permeabilization Buffer was added. Tubes were gently agitated and incubated on a rotator at room temperature for 30–60 min. Following washing, the CUT&Tag Transposome complex was diluted 1:250 in Digitonin Permeabilization Buffer 2 and added dropwise to the cells. After gentle agitation, tubes were placed on a magnetic stand. The supernatant was discarded after bead capture. CUT&Tag Activation Buffer (300 µL) was added, tubes were gently agitated, and incubated at 37 °C for 1 h. DNA was extracted (1 h), amplified by PCR (1 h; including a 5 min 72 °C step prior to cycling), purified (30 min), and subjected to sequencing.
Luciferase reporter assay
The full-length human HK2 gene promoter was cloned into the pGL3-basic luciferase reporter vector (Genechem, China) to generate the wild-type reporter plasmid pGL3-HK2-WT. A series of HK2 promoter deletion fragments of different lengths were amplified by PCR and cloned individually into pGL3-basic to identify the minimal core region required for both basal and HIF-1α-induced HK2 promoter activity. Using a site-directed mutagenesis kit (Genechem, China), the HIF-1α core binding site in the HK2 promoter was mutated using pGL3-HK2-WT as the template, generating the mutant reporter plasmid pGL3-HK2-Mut. Reporter plasmids were co-transfected with the pRL-TK Renilla luciferase internal control plasmid into cells. At 48 h post-transfection, luciferase activity was measured using the Dual-Luciferase Reporter Assay System (Promega, USA), and results were expressed as the ratio of firefly to Renilla luciferase activity.
ChIP-qPCR assay
We performed the ChIP assay using the EZ-Magna ChIP Chromatin Immunoprecipitation Kit (Abcam, UK), according to the manufacturer’s instructions. In brief, we fixed cells in 1% formaldehyde for 10 min at ambient temperature. The fixed cells were harvested, lysed, and sonicated for 10 cycles of 10 s ON/20 s OFF and 50% AMPL using Sonics VCX130 (Sonics & Materials, USA). Antibodies against HIF-1α and rabbit IgG (Thermo Fisher, USA) were used for immunoprecipitation. PCR amplification of the precipitated DNA was performed.
Immunoprecipitation (IP) assay
Cells were introduced with the specified plasmids and allowed to incubate for a period of 24 h. Following this, the cells underwent lysis in an IP lysis buffer, which had protease and phosphatase inhibitor tablets, for half an hour. Post centrifugation at 12,000 rpm at a temperature of 4 °C, the supernatant, which contained the protein, was subjected to overnight incubation with protein G agarose beads (Beyotime, China) and specific antibodies at 4 °C. Subsequently, the beads were thoroughly rinsed three times with buffers having 300 mM and 150 mM NaCl and then were treated with a 2×SDS loading buffer at 4 °C before executing the immunoblotting process. The information of antibodies could be found in Supplementary table 2.
Immunoprecipitation-mass spectrometry (IP-MS)
Target protein gel bands were excised, destained (50% ACN/50 mM NH₄HCO₃), and dehydrated (100% ACN). Reduction used 10 mM TCEP (37 °C, 30 min); alkylation used 25 mM iodoacetamide (RT, dark, 30 min). After washing (50 mM NH₄HCO₃) and dehydration, in-gel digestion used 2 μg trypsin (50 mM NH₄HCO₃, 37 °C, overnight). Peptides were extracted (50% ACN/0.1% FA), SpeedVac-dried, and resuspended in 0.1% FA. LC separation (EASY nLC-1200, 400 nL/min) used: 2–7% B (1 min), 7–35% B (35 min), 35–55% B (9 min), 55–100% B (7 min), 100% B (8 min). Mobile phase A: 0.1% FA; B: 0.1% FA/80% ACN. MS (Q Exactive HF-X) used nano-ESI (2.0 kV). Full MS: Orbitrap, 60,000 resolution. MS/MS: Top 20 precursors, NCE 27, Orbitrap 30,000 resolution, 20 s dynamic exclusion. Data searched via Proteome Discoverer 2.4 against SwissProt Human (2023_09) with Trypsin/P (≤ 2 miscleavages).
GST pull-down assay
Purified recombinant protein (Abcam, UK) was incubated with glutathione agarose gel at 4 °C for 1 h, followed by washing with binding buffer. Target protein was added and incubated for another hour under the same conditions. The protein complex was washed and eluted using elution buffer. Eluted proteins were analyzed by SDS-PAGE and Western blotting. GST (glutathione S-transferase) protein was used as a negative control.
Mass cytometry
Peripheral blood mononuclear cells (PBMCs) from 18 samples (from 9 HCC patients) underwent CyTOF analysis. CyTOF staining steps comprised 194Pt staining → Fc block → surface antibody staining → overnight DNA staining (191/193Ir) → intracellular antibody staining → collecting data on the computer. The data analysis steps comprised A. FlowJo pre-treatment: circle and select single, live and complete CD45+ immune cells; B. Bio-information analysis: X-shift algorithm performs cell subpopulation clustering, manual annotation, TSNE dimensionality reduction visual display, as well as statistical analysis.
Chemokine array
Prepared samples were uniformly applied to the array membrane, ensuring complete coverage of all spot wells, and incubated at room temperature for 1–2 h to facilitate specific binding of chemokines to the immobilized capture antibodies. Unbound components were subsequently removed by thorough washing with wash buffer. If required, a blocking agent was applied to minimize non-specific binding and reduce background noise. The membrane was then incubated with a biotinylated or enzyme-conjugated detection antibody specific for the captured chemokines, forming an antibody-chemokine-detection antibody sandwich complex. Finally, bound complexes were detected using an appropriate method.
Lactylation detection
Lactylated proteins were immunoprecipitated from sample lysates using a lactylation-specific antibody to form antigen-antibody complexes. Biotin-conjugated secondary antibodies were then applied, and lactylated targets were specifically enriched via streptavidin-biotin affinity purification. Enriched proteins were resolved by SDS-PAGE according to molecular weight and subsequently transferred to PVDF membranes. Membranes were probed with a primary antibody specific for lactylation modifications, followed by an appropriate HRP- or fluorophore-conjugated secondary antibody. Immunocomplexes were detected using chemiluminescent or fluorescent imaging systems, enabling qualitative and semi-quantitative analysis of protein lactylation.
Prediction of potential allosteric sites of TKTL1 and virtual screening
Using AlphaFold, we estimated potential allosteric sites within the TKTL1 protein structure. To identify promising compounds, we conducted virtual screening using two commercial chemical libraries, each containing over 67,000 compounds. The screening process employed grid-based ligand docking facilitated by the GLIDE software (Schrödinger Maestro 11.4), meticulously targeting the expected locations. Subsequently, we procured the top 1 compounds with the highest scores from MCE for experimental investigation.
Microscale thermophoresis (MST)
With the use of conventional capillaries and Monolith NT.115 (NanoTemper Technologies GmbH, Germany), MST was used to ascertain the binding affinity of TKTL1 with Quercetin 3-glc-7-gent. Lysates from HEK-293T cells expressing GFP-TKTL1 were used as a source of fluorescently labeled TKTL1. HEK-293T cells were transfected with GFP-fused TKTL1 and lysed 24 h after transfection. To assess the binding of Quercetin 3-glc-7-gent to TKTL1, cell lysates were diluted 1.5-fold with MST buffer (10 mM Na-phosphate buffer, pH 7.4, 1 mM MgCl2, 3 mM KCl, 150 mM NaCl, 0.05% Tween-20) to provide optimal fluorescence levels. Quercetin 3-glc-7-gent titration series (0–1 mM) were incubated with diluted cell lysates. Measurements were performed in a high-quality coated capillary (NanoTemper Technologies GmbH, Germany) using an LED light source at 470 nm with 100% IR laser power and a temperature of 25 °C. The fluorescence signal was normalized, and the Hill equation was fitted using MO Affinity Analysis v2.1.3 software (NanoTemper Technologies GmbH, Germany).
Synthesis of the CQLH nanosystem
Synthesis of Hollow Mesoporous MnO₂ Nanoparticles (H-MnO₂ NPs): Hollow mesoporous MnO₂ nanoparticles were synthesized via a modified hydrothermal method. Briefly, 0.5 g KMnO₄ and 0.3 g CTAB were dissolved in 40 mL deionized water under vigorous stirring. The solution was transferred to a Teflon-lined autoclave and heated at 160 °C for 6 h. The resulting brown precipitate was collected by centrifugation (12,000 rpm, 15 min), washed three times with ethanol/water (1:1 v/v), and dried at 60 °C overnight.
Co-Loading of Quercetin 3-glc-7-gent and Lactate Oxidase (LOX): H-MnO₂ NPs (10 mg) were dispersed in 5 mL PBS (pH 7.4) containing Quercetin 3-glc-7-gent (1 mg/mL) and LOX (20 μg/mg NPs). The mixture was gently agitated at 4 °C for 24 h. The co-loaded nanoparticles (denoted as QL@MnO₂) were collected by centrifugation (10,000 rpm, 10 min) and washed twice with PBS to remove unbound cargo.
HCC Cell Membrane Coating: Cell membranes were isolated from Hepa1-6 HCC cells using hypotonic lysis and differential centrifugation. Membrane protein concentration was quantified by BCA assay. QL@MnO₂ nanoparticles were mixed with HCC membrane fragments (1:1 w/w protein ratio) and co-extruded 10× through a 200-nm polycarbonate membrane using an Avanti mini-extruder to form the biomimetic CQLH nanosystem.
Characterization of the CQLH nanosystem
TEM: Morphology of H-MnO₂ NPs and CQLH was analyzed by transmission electron microscopy (JEOL JEM-2100, 200 kV). Samples were drop-cast onto copper grids and air-dried.
SEM-EDS: elemental mapping (Mn, O, C, N) was performed using SEM coupled with EDS
Size and Zeta Potential: Hydrodynamic diameter and surface charge of nanoparticles (H-MnO₂, QL@MnO₂, CQLH) were measured by dynamic light scattering (DLS, Malvern Zetasizer Nano ZS) in PBS.
Loading Efficiency: Quercetin 3-glc-7-gent loading was quantified via UV-Vis spectrophotometry (λ = 370 nm) after dissolving nanoparticles in DMSO. LOX loading was determined by BCA assay of the unbound supernatant.
pH-Responsive Release: Quercetin 3-glc-7-gent release from CQLH was evaluated in PBS at pH 7.4, 6.5, and 5.0 using dialysis (MWCO 14 kDa). Samples were analyzed by HPLC at predetermined intervals.
Membrane Coating Validation: Protein profiles of HCC cell membranes and CQLH were compared by 10% SDS-PAGE.
AFP Immunoblotting: α-Fetoprotein (AFP) expression on CQLH was confirmed by Western blot using anti-AFP antibody (1:1000 dilution).
Mn²⁺ Release: Mn²⁺ ions generated by CQLH in acetate buffer (pH 5.0) were quantified via o-phenanthroline assay and ICP-MS.
Catalytic Activity: LOX enzymatic activity was measured spectrophotometrically (λ = 570 nm) using an Amplex™ Red Lactate Assay Kit.
Statistical analysis
All experiments were carried out based on independent biological replicates. Statistical analysis was performed using GraphPad Prism 10.0 software, with p < 0.05 indicating statistically significant differences. The specific methods are as follows: For comparison between two groups, an unpaired t-test was used to analyze the differences between biological replicate samples of the two groups; for comparison among multiple groups, one-way ANOVA or two-way ANOVA was used to analyze the differences among biological replicate samples of three or more groups; for survival analysis, the Kaplan–Meier method was used to draw survival curves, and the log-rank test was used to compare the survival differences among biological replicate samples of different groups; for correlation analysis, the Pearson correlation coefficient was used to evaluate the linear association between two variables in biological replicate samples. The detailed results of all statistical analyses (including, test type, p-value, etc.) are indicated in the legends of the corresponding figures.
Schematic generation tools
The illustrations in this article were created using Figure Draw and BioRender software, for which authorization licenses have been obtained.
Patient and public involvement
Patients and the public were not involved in this work.
Ethics statement
All human-derived samples were approved by the Ethics Review Committee of the First Affiliated Hospital of Nanjing Medical University (2019-SR-332). All in vivo animal experiments were approved by the Committee on the Ethics of Animal Experiments of Nanjing Medical University (IACUC-2404094).
