


Cell culture
HT1080 (a gift from J. Klumperman, UMC Utrecht), U2OS (ATCC; HTB-96), Swiss 3T3 (ATCC; CCL-92), MDA-MB-231 (mCh-Lifeact; described in ref. 84), 1205Lu (Lifeact-eGFP; described in refs. 85,86) and HEK293T cells (ATCC; CRL-3216) were cultured in Dulbecco’s modified Eagle medium (DMEM; Capricorn Scientific or Gibco) supplemented with 10% fetal bovine serum (FBS; Corning) and 100 U ml−1 penicillin and 100 µg ml−1 streptomycin (1% Pen Strep; Sigma). Cells were kept at 37 °C with 5% CO2 and routinely tested for mycoplasma using a commercial assay (Mycoaltert assay, LT07-518; Lonza). No commonly misidentified cell lines were used, and cells were not authenticated.
Serum starvation
For assays directly or indirectly assessing RhoA activation, cells were first serum-starved to lower the baseline RhoA activity as follows: cells were plated at 10–15% confluency in normal culture medium containing 10% FBS, transferred to medium containing 0.5% FBS 24 h after plating and changed to FBS free medium a further 24 h after that, then incubated overnight (16–18 h) before commencing the experiment. Swiss 3T3 cells were directly transferred from full medium to serum-free medium and starved for 24 h.
DNA constructs
GFP-GEF-H1 was a gift from S. Etienne-Manneville (Institut Pasteur, Paris, France). For protein purification, a strepII-tagged GFP-GEF-H1 was generated by Gibson assembly using GFP-GEF-H1 as a template to clone into a SII-GFP expression vector. For GFP-GEF-H128–100, GFP-GEF-H128–100-G4, GFP-GEF-H11–136 and GFP-GEF-H11–136-G4, a synthetic gene encoding amino acids 1–136 of GEF-H1 (UniProt Q92974-1), comprising the C1 domain and its adjacent disordered regions, was purchased from Genewiz-Azenta. This was used as a template to amplify GEF-H128–100 and GEF-H11–136. Gibson assembly was used to clone both GEF-H11–136 and GEF-H128–100 into either an SII-GFP expression vector or a modified SII-GFP vector containing a GCN4 coiled-coil domain to promote dimerization. F-tractin-mStayGold was a gift from A. Miyawaki (Addgene 212019)87,88. mCh-α-tubulin consisted of a human α-tubulin fused with mCherry89. pLenti-RhoA2G42 was a gift from O. Pertz (Addgene 40179), FLAG-aTAT132 was a gift from S. Etienne-Manneville (Institut Pasteur, Paris, France), VASH2-FLAG and SVBP-FLAG were a gift from M. Martin (University of Brussels, Belgium), and HA-MATCAP58 was a kind gift from T. Brummelkamp (Netherlands Cancer Institute, Amsterdam, the Netherlands). psPAX2 (Addgene 12260) and pMD2.G (Addgene 12259) lentiviral packaging constructs were a gift from D. Trono (EPFL, Lausanne, Switzerland). pSpCas9(BB)–2A-Puro (PX459) V2.090 (Addgene 62988) was a gift from F. Zhang (Broad Institute of MIT and Harvard, Cambridge, USA).
Cell transfection
Cells were plated at 15% confluency the day before transfection. A ratio of 1 µg plasmid DNA to 3 µl Fugene6 (Promega) transfection reagent was used, and the transfection mix was prepared in optiMEM (Gibco) according to the manufacturer’s instructions. Cells were used for experiments 24 h after transfection.
Western blotting
Cell lysates were collected on ice using RIPA buffer (20 mM Tris pH 7.5, 100 mM NaCl, 1% NP-40, 0.1% sodium dodecyl sulfate (SDS), 0.2% sodium deoxycholate, 10 mM ethylenediaminetetraacetic acid (EDTA)) containing freshly added broad spectrum protease inhibitors (cOmplete protease inhibitor cocktail, Roche, 11873580001) and phosphatase inhibitors (PhosSTOP, Roche, 4906837001), mixed with loading dye (50 mM Tris pH 6.5, 2% SDS, 1.5 mM bromophenol blue, 8% glycerol) and 5% β-mercaptoethanol, then boiled for 10 min. Lysates were run on 5–16% acrylamide gels and transferred, to polyvinylidene difluoride (PVDF) membrane (0.45-µm pore size, Merck Millipore, IPVH00010) or nitrocellulose membrane (0.2-µm pore size, Amersham, 10600006) in the case of p-MLC, using wet transfer at 37 V and 4 °C overnight. Membranes were blocked using 5% bovine serum albumin (BSA) in Tris-buffered saline with 0.1% Tween 20 (TBST) for 2–8 h, then incubated in primary antibody diluted in blocking buffer, rabbit anti-p-MLC (Cell Signaling, 3671S, dilution 1:250) or rabbit anti-GEF-H1 (Abcam, ab155785, dilution 1:1,000) overnight or mouse anti-actin (Sigma, MAB1501, dilution 1:4,000) for 1 h. Blots were washed three times for 5 min each with TBST after primary antibody incubation, then incubated with goat anti-mouse horseradish peroxidase (HRP)-conjugated secondary (Agilent, P044701-2, 1:2,500 dilution) or swine anti-rabbit HRP-conjugated secondary (Agilent, P039901-2, 1:2,500 dilution). Blots were again washed three times for 5 min each with TBST, then developed using ECL western blotting substrate (Promega, W1015) and imaged using an Amersham ImageQuant 800 set-up, taking care not to saturate the signal. Actin was used as a loading control. Quantifications of p-MLC blots were performed in Image J. The p-MLC signal was first normalized to the actin loading control, and then to the experiment average.
GEF-H1 knockout cell line generation
Anti-GEF-H1 targeting sequence 5′-ATGGGCACCTCTTCACCACC-3′ was cloned into the pSpCas9(BB)–2A-Puro (PX459) V2.0 plasmid using the BbsI restriction site. This GEF-H1 targeting CAS9 plasmid was then transfected into HT1080 cells as described above. At 24 h after transfection, 3 μg ml−1 puromycin (InvivoGen, ant-pr-1) was added to the medium to select for transfected cells for 24 h. From the surviving cell pool, single cells were plated in a 96-well plate and expanded into clonal cell lines. These were screened for GEF-H1 knockout (KO) by immunofluorescence, western blotting and by performing targeted sequencing of genomic DNA. Genomic DNA was extracted using the GeneJET Genomic DNA Purification Kit (Thermo Scientific, K0722), then amplified using the following primers—forward 5′-GCTCTGCTTTAGGAACTGGTGT-3′ and reverse 5′-GAGAGAAGAGTGACCCTCATGG-3′—then repurified and sent for sequencing using the reverse primer.
RhoA2G stable cell line generation
Lentivirus was used to generate stable cell lines expressing the RhoA2G FRET sensor. Lentivirus was produced in HEK293T cells. For this purpose, cells were plated in a 10-cm dish to be 90% confluent on the day of transfection. Cells were transfected with 15 μg of pLenti-RhoA2G, 10 μg of psPAX2 and 5 μg of pMD2.G using 90 μl of MaxPEI (1 mg ml−1 polyethylenimine, Polysciences) in optiMEM (1.2 ml total volume). Transfection mix was vortexed briefly and incubated at room temperature (r.t.) for 10 min before adding to the cells. Cell medium was refreshed the next day using 7 ml of medium, and the conditioned medium was discarded. Two days after transfection, conditioned medium was collected and stored at 4 °C, and 7 ml of fresh medium was applied. Three days afterwards, transfection medium was harvested and combined with medium harvested the previous day, spun for 5 min at 3,000g to pellet any floating cells, then supernatant was filtered through a 0.045-μm filter to remove debris. The filtrate was applied to an Amicon Ultra-15 filter column (Merck, UFC903029) and centrifuged for 30 min at 3,000g to purify virus. The remaining supernatant with virus was aliquoted and stored at −80 °C until use for cell transduction.
HT1080 WT or GEF-H1 KO cells were plated in a 12-well plate such that they would be 40–50% confluent on the day of transduction. Medium was refreshed with medium containing 6 μg ml−1 polybrene (Merck, TRI-1003-G) before applying virus. Lentivirus was thawed on ice and 5 μl applied per well. At 24 h after transduction, the medium was refreshed with medium containing 3 μg ml−1 puromycin (InvivoGen, anti-pr-1) to select for transduced cells. After 24 h of antibiotic selection, the cells were returned to normal cell culture medium, expanded, and frozen down for future use.
RhoA2G FRET experiments
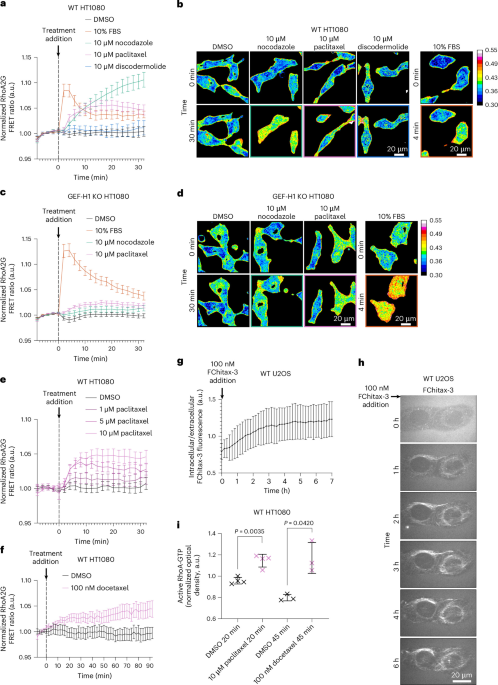
RhoA2G HT1080 WT or GEF-H1 KO cells were plated on 25-mm coverslips and serum-starved as described above. Just before the start of the experiment, coverslips were mounted inside prewarmed imaging rings (Thermo Scientific, A7816) with 1 ml of serum-free medium. FRET experiments were conducted on a Zeiss LSM880 Airyscan microscope fitted with an S1 (Pecon) temperature control and CO2 system set to 37 °C and 5% CO2, and a ×100/1.46 Alpha Plan-APO oil immersion objective. ZEN black v2.3 software was used to operate the microscope, a 445-nm laser was used to excite the monomeric teal fluorescent protein (mTFP), the emission for mTFP was collected between 472 and 500 nm, and the emission for mVenus was collected between 565 and 654 nm. These settings had been optimized previously to minimize crosstalk using cells containing only mTFP or mVenus as controls. One frame was acquired every 2 min, and five frames were acquired immediately before drug/dimethyl sulfoxide (DMSO) or serum addition.
RhoA G-LISA GTPase activation assay
A RhoA G-LISA GTPase activation assay kit purchased from Cytoskeleton (BK121) was used according to the manufacturer’s instructions to quantify active RhoA in cells. HT1080 cells were plated at 10% confluency in 10-cm dishes and serum-starved as described above. Cells were treated with either DMSO, paclitaxel or docetaxel, for the concentrations and times indicated, before the cells were washed on ice in a refrigerated room (4 °C) with ice-cold phosphate-buffered saline (PBS; taking care to remove all the PBS by aspirating at an angle on ice for 1 min) and lysed with ice-cold lysis buffer from the kit. Cell lysates were homogenized using a syringe with a 27-G needle and pre-cleared by centrifuging in a centrifuge pre-cooled to 4 °C for 2 min at 10,000g. The supernatant was aliquoted on ice into ice-cold Eppendorf tubes, snap-frozen, and stored at −80 °C until the start of the G-LISA essay. One of the aliquots was used for quantifying the protein concentration using a BCA assay. A final concentration of 250 ng protein µl−1 was used in the assay after dilution with the binding buffer. An enzyme-linked immunosorbent assay (ELISA) was conducted carefully following the manufacturer’s instructions. A FLUOstar OPTIMA plate reader was used to quantify luminescence. Each experiment contained duplicates, the average of the background (lysis buffer only) was subtracted from the average of the sample, and the result was normalized to the mean of the experiment.
Immunofluorescence cell staining
To stain F-actin, 4% paraformaldehyde (PFA) fixation was used, and to stain microtubule binding proteins such as GEF-H1 or EB1 + EB3, methanol fixation was used. For PFA fixation, cells were fixed at r.t. for 15 min using 4% PFA in MRB80 buffer (80 mM K-Pipes, 1 mM EGTA, 4 mM MgCl2; pH 6.80 with KOH) prewarmed to 37 °C. For methanol fixation, cells were fixed on ice for 15 min using −20 °C methanol. After fixation, cells were washed three times with PBS. In the case of 4% PFA fixation, cells were permeabilized with 0.2% Triton-X in PBS for 2.5 min. The cells were then blocked in blocking buffer (2% BSA in PBS with 0.05% Tween 20) for 1 h. Primary antibodies were diluted in blocking buffer and incubated on cells for 1 h; the antibodies used were rat anti-tyrosinated-α-tubulin (Thermo, MA1-80017; dilution 1:200), mouse anti-α-tubulin (Sigma, T6199; dilution 1:200), mouse anti-acetylated-tubulin (Sigma, T7451; dilution 1:200), rabbit anti-de-tyrosinated-tubulin (Abcam, ab48389, dilution 1:200), rat EB1 + EB3 (Absea, 15H11; dilution 1:10), rabbit anti-GEF-H1 (Abcam, ab155785; dilution 1:150) and mouse anti GFP (Sigma, 11814460001; dilution 1:200). Coverslips were washed by dunking in two different containers of PBS with 0.05% Tween 20, then secondary antibodies or phalloidin diluted in blocking buffer were incubated on cells for 1 h; the secondary antibodies or phalloidin used were donkey anti-rat-Alexafluor-488 (Thermo, A21208; dilution 1:200), goat anti-rat-Alexafluor-594 (Thermo, A11007; dilution 1:200), AlexaFluor-594 conjugated phalloidin (Thermo, A12381; dilution 1:200), goat anti-mouse-AlexaFluor-488 (Thermo, A11029; dilution 1:200) goat anti-mouse-DyLight-405 (Jackson ImmunoResearch, 115-475-166; dilution 1:150), goat anti-rabbit-Alexafluor-405-plus (Thermo A48253; dilution 1:200) and goat anti-rabbit-AlexaFluor-488-plus (Thermo, A32731; dilution 1:200). The samples were mounted with Mowiol mounting medium (10% Mowiol, Sigma, 81381; 30% glycerol, 60% 0.2 M Tris, pH 8.5) with 2.5% DABCO (Sigma, D2522) and allowed to set overnight.
Images of fixed cells for analysis were acquired on a Nikon Eclipse 80i widefield microscope using a Photometrics CoolSNAP MYO CCD camera and a Plan Apo VC ×100/1.40 oil objective. A CoolLED pE-300 system was used to excite the sample. A Chroma ET-DAPI (49000) filter was used to image AlexaFluor-405 and DyLight-405, a Chroma ET-GFP (49002) filter was used to image AlexaFluor-488 or GFP, and a Chroma ET-mCherry (49008) filter was used to image AlexaFluor-594. Nikon NIS Br software was used to operate the microscope.
The images of cells in Figs. 2 and 3a and Extended Figs. 3 and 5 were acquired on a Leica TCS SP8 confocal microscope using a ×100 (oil) HC PL APO ×100/1.40 objective. The microscope was equipped with a 405-nm direct-modulated (DMOD) flexible laser and a white laser (programmable between 470 and 670 nm), two photomultiplier tube detectors and three hybrid detectors. LAS X software was used to control the microscope.
Live-cell imaging with drug addition
Cells were seeded on 25-mm glass coverslips or glass-bottomed dishes (Cellvis) and, if not already stably expressing fluorescent markers, transfected with GFP-GEF-H1 and mCh-α-tubulin or F-tractin-mStayGold as described above, and serum-starved if applicable. At 48 h after transfection, the coverslips were mounted in prewarmed imaging rings (Thermo, A7816) with 1 ml of medium, and cells plated on glass-bottomed dishes were used directly. Cells were imaged either on a custom Yokogawa spinning disc or an Andor Dragonfly spinning disc.
The Yokogawa spinning disc microscope had an Eclipse Ti-E body (Nikon) with perfect focus, a MS-2000-XYZ stage with Piexo Top Plate (ASI), a CSU-X1-A1 spinning disc unit (Yokogawa) and STXG-PLAMX-SETZ21L temperature and CO2 control (TokaiHit). An S Fluor ×100 oil objective (Nikon) was used to acquire images. Voltran Stradus 488-nm (Vortran) and Coherent OBIS 561-nm (Coherent) lasers were used to excite the sample, and ET525/50m (GFP) and ET630/75m (mCherry) filters were used to filter the signal. A prime BSI sCMOS camera (Teledyne Photometrics) was used to take images, and MetaMorph 7.10 (Molecular Devices) software was used to control the microscope.
The Andor Dragonfly spinning disc microscope had an Eclipse Ti-E (Nikon) body with perfect focus, dual Andor Zyla 4.2 sCMOS cameras, and was fitted with a ×60 Plan apo oil objective. A 488-nm laser line was used to excite GFP or mStayGold, with a 525/50 filter to filter the signal, and a 561-nm laser was used to excite mCherry, with a 600/50 filter to filter the signal. The microscope was operated with Fusion software (v2.3.0.36).
In both cases, microscope incubation chambers were preheated to 37 °C with 5% CO2. One image was taken every 30 s (GFP-GEF-H1 imaging) or 1 min (F-actin imaging); the first 10 min acquired served as a baseline, after which either 10 µM paclitaxel (PTX) or discodermolide (DDM) was applied to cells and cells were imaged for another 10–15 min or 1 h.
Analysis of cell images
FRET analysis
The fluorescence intensities of the mTFP/donor and mVenus/acceptor channels for FRET experiments were quantified in Image J. Cell outlines were created, and the mean pixel intensity (mean grey value) quantified for both channels at all time points, alongside the respective background measurements (taken for an area without cells). The FRET ratio rFRET was subsequently calculated using the following equation, where Idonor and Iacceptor are the intensities of the donor and acceptor channels, respectively:
$${r}_{\mathrm{FRET}}=\,\frac{{I}_{\mathrm{acceptor}\mathrm{cell}}-{I}_{\mathrm{acceptor}\mathrm{background}}}{\left({I}_{\mathrm{acceptor}\mathrm{cell}}-{I}_{\mathrm{acceptor}\mathrm{background}}\right)+\left({I}_{\mathrm{donor}\mathrm{cell}}-{I}_{\mathrm{donor}\mathrm{background}}\right)}$$
Quantification of fluorescence intensity
The GFP-GEF-H1 fluorescence intensity or Phalloidin staining intensity was measured in Image J by outlining the cell and quantifying the mean pixel intensity (mean grey value) and subtracting the mean pixel intensity of an area without cells (background). Final values were normalized to the experiment’s mean.
Quantification of GFP-GEF-H1 binding to microtubules
To ensure comparable GFP-GEF-H1 expression levels between treatments, upper and lower thresholds for the GFP-GEF-H1 signal were set for each experiment, and cells with GFP-GEF-H1 signals above and below the threshold were excluded. The GFP-GEF-H1 microtubule-to-cytoplasmic ratio rMT/cytoplasm was quantified in Image J. First, the channels were aligned using the template-matching plugin, then the mean GFP-GEF-H1 fluorescence was determined for all cells as described above, and only cells with comparable expression levels across different treatment groups were used for subsequent analysis. For each cell, ten line scans, three pixels wide, were drawn perpendicular to the microtubule in regions where the cytoplasm was devoid of microtubules on either side of the microtubule. The GFP-GEF-H1 intensity on the microtubule, IMT, was calculated by taking the mean pixel intensity at the location with the maximum value of the tubulin staining plus the value directly on either side of that maximum; the GFP-GEF-H1 intensity in the cytoplasm, Icytoplasm, was defined as the values 4–6 pixels before and after the maximum of the tubulin staining. These distances were determined by looking at line scans across microtubules, as shown in Fig. 3b. The mean background pixel intensity, Ibackground, was measured in a region devoid of cells. The background was subtracted from the GFP-GEF-H1 intensity on the microtubule and in the cytoplasm, then the ratio of GFP-GEF-H1 on the microtubule and GFP-GEF-H1 in the cytoplasm was taken as follows:
$${r}_{\mathrm{MT}/\mathrm{cytoplasm}}=\frac{{I}_{\mathrm{MT}}-{I}_{\mathrm{background}}}{{I}_{\mathrm{cytoplasm}}-{I}_{\mathrm{background}}}$$
The mean cell microtubule-to-cytoplasm ratio over the ten line scans was plotted.
Protein purification
The proteins were purified from HEK293T cells using Strep(II)-streptactin affinity purification as described previously60. The cells were transfected with a 1:3 wt/wt mix of DNA construct and PEI (Polysciences) and harvested 48 h after transfection in lysis buffer (50 mM HEPES, 1 mM MgCl2, 1 mM dithiothreitol (DTT), 300 mM NaCl and 0.5% Triton X-100; pH 7.4) containing protease inhibitors (Roche). They were kept on ice for 15 min and centrifuged to clear the debris. The lysate was incubated with StrepTactin beads (IBA Lifesciences) for 45 min. The beads were washed five times with lysis buffer (high salt washes) and three times with lysis buffer but with 150 mM NaCl instead of 300 mM (low salt washes). The protein was then eluted in elution buffer (50 mM HEPES, 150 mM NaCl, 1 mM MgCl2, 1 mM EGTA, 1 mM DTT, 0.05% Triton X-100 and 2.5 mM d-desthiobiotin (Sigma-Aldrich), pH 7.4). All purified proteins were snap-frozen and stored at −80 °C.
Mass spectrometry
Protein digestion
For liquid chromatography–tandem mass spectrometry (LC–MS/MS) analysis, 2 mg of GFP-GEF-H1 purified protein was used. The volume was adjusted to 20 µl using elution buffer (50 mM HEPES pH 7.4, 150 mM NaCl, 1 mM MgCl2, 1 mM EGTA, 1 mM DTT, 0.05% Triton X-100, 2.5 mM d-desthiobiotin). The sample was first reduced and alkylated by adding Tris(2-carboxyethyl)phosphine (TCEP) and chloroacetamide (CAA) to a final concentration of ~10 mM and 40 mM, respectively. Incubation first took place at 99 °C for 10 min, then in the dark for 20 min at r.t.
The sample was digested using the single-pot, solid-phase-enhance sample preparation method (SP3)91. For this, Cytiva Sera-Mag carboxylate-modified magnetic beads—hydrophilic and hydrophobic beads—were used in a 1:1 ratio. The beads were washed with ultrapure water (MQ), repeated twice. To ensure that the bead concentration remained above 0.5 µg μl−1, a total of 75 µg of beads were added to the sample, then 100% ethanol (EtOH) was added to a final concentration of 75% EtOH. The sample was incubated in a Thermomixer at 1,000 r.p.m. for 20 min at r.t. The tube was placed in a magnetic rack, and the supernatant removed. The beads were washed twice with 80% EtOH, followed by a washing step with 100% acetonitrile (ACN). For digestion, the beads were resuspended in 200 µl of 100 mM ammonium bicarbonate (AMBIC) by pushing the particles into solution; the digestion-bead solution was not pipetted or homogenized. The sample was then sonicated for 2 min in a water bath and digested using the proteases trypsin and lys-C (in 1:25 and 1:75 protease-to-protein ratios, respectively). Digestion was performed overnight in a Thermomixer at 1,000 r.p.m., at 37 °C. The sample was spun down and acidified by adding 10% trifluoracetic acid (TFA) to a final concentration of 5% TFA. The beads were immobilized on a magnetic rack, and the acidified peptide solution was transferred to a new Eppendorf tube. The peptide sample was dried in a vacuum centrifuge.
LC–MS/MS
Samples were resuspended in 50 µl of 2% formic acid (FA), then 5 µl was used for analysis by LC–MS/MS. Peptides were separated on a nanospray UHPLC system (Ultimate 3000, Thermo) using a 50-cm reversed-phase analytical column with an integrated emitter (75-µm inner diameter), packed in-house with ReproSilPur C18-AQ 1.9-µm resin (Dr Maisch). Mobile-phase buffer A was composed of 0.1% FA (vol/vol) and mobile-phase buffer B consisted of 80% ACN (vol/vol) and 0.1% FA (vol/vol). The Acclaim Pepmap 100 C18 (5 mm × 0.3 mm, 5 μm, Thermo) trap column was operated at a temperature of 32 °C, and the analytical column at a temperature of 50 °C. A flow rate of 0.3 μl min−1 was used. Starting at 4.0%, buffer B was increased over a total gradient time of 45 min using the following stepwise increases: 11% buffer B (3–35 min), 30% nuffer B (35–40 min), 44% buffer B (40–44 min) and 55% buffer B (44–45 min). The column was then washed out with 99% buffer B for 5 min, followed by a 10-min re-equilibration step with 4.0% buffer B.
The Ultimate 3000 system was coupled to a Thermo Scientific Orbitrap Exploris 480 instrument. Data were acquired in SII for Xcalibur software using a data-dependent mode (DDA), and MS1 scans were acquired at 60,000 resolution using a scan range of 375–1,600 m/z. With an isolation window of 1.4 m/z, precursor ions with an intensity threshold higher than 200,000 and charge states between 2+ and 6+ were selected for fragmentation. Precursors were fragmented by stepped higher-energy collisional dissociation (HCD) with a normalized collision energy (NCE) of 28%. The MS2 scans were acquired at 15,000 resolution, with maximum injection time set to auto, and the scan range set to a first mass of 120 m/z. The dynamic exclusion time was set to custom, with a 10-ppm upper and lower tolerance and excluding isotypes.
MaxQuant analysis
Raw data were analysed using MaxQuant-Andromeda software (v.2.4.7.0) for protein identification, using iBaq values for quantification. MS/MS spectra were searched against the UniProtKB Human Proteome (organism_id: 9606, reviewed, canonical & isoform FASTA, downloaded 12 March 2025) and a separate FASTA file containing the recombinant protein StrepII-GFP-GEF-H1. Default parameters were used for the precursor mass tolerance (20 ppm first search, 4.5 ppm main search), and the false discovery rate was set to 1%. Up to three missed cleavages for both proteases were allowed. Carbamidomethylation of cysteine residues was set as a fixed modification, and oxidation of methionine and acetylation of the protein N terminus were set as variable modifications, with a maximum of five modifications per peptide.
The iBaq values from the MaxQuant search were imported into Perseus software (v.2.0.11.0), and the protein groups were filtered out for ‘Reverse’ (false positives), ‘Contaminants’ and ‘Only identified by site’, as well as having only one peptide hit, and transferred to excel files for further analysis. The iBaq values were normalized to percentages, with the highest iBaq value set to 100%.
In vitro reconstitution assays
Sample preparation
The flow chambers were prepared by plasma-cleaning the coverslips and attaching them to glass slides using strips of double-sided tape to create chambers with a volume of ~10 µl. The surface was functionalized by 5-min incubations with 0.2 mg ml−1 PLL-PEG-biotin (Susos AG) and then 0.83 mg ml−1 neutravidin (Invitrogen), both dissolved in MRB80 buffer (80 mM K-Pipes, 1 mM EGTA, 4 mM MgCl2; pH 6.80 with KOH). Double-cycled biotinylated GMPCPP seeds prepared as described previously53 were then flowed in and incubated for 2 min, followed by a >3-min incubation with K-casein.
All tubulin used were from Cytoskeleton Inc. All mixes contained a freshly prepared master mix composed of 0.1% (wt/vol) methylcellulose, 0.5 mg ml−1 K-casein, 50 mM KCL, 50 mM glucose, 0.2 mg ml−1 catalase, 0.5 mg ml−1 glucose oxidase and 10 mM DTT, and were mixed in MRB80 buffer. For the GEF-H1 binding assays, the master mix was supplemented with 17 µM porcine brain tubulin, 0.6 µM TRITC rhodamine-labelled tubulin, 1 mM GTP/GTPyS and the required concentration of GEF-H1 proteins. For the paclitaxel and discodermolide expansion assays, the microtubule mix had master mix supplemented with 17 µM porcine brain tubulin, 0.6 µM TRITC rhodamine-labelled tubulin and 1 mM GTP, and the wash-in mix had master mix with 20 μM paclitaxel/200 nM discodermolide. For the experiments with GEF-H1 and paclitaxel/discodermolide, the microtubule mix was the same as for the binding assays, and the wash-in mix had 4.85 µM porcine brain tubulin, 0.15 μM TRITC rhodamine-labelled tubulin, 20 µM paclitaxel/200 nM discodermolide and the same concentration of GEF-H1 proteins. For the GTPyS-GDP parallel chamber experiment, fluorescent TetraSpeckTM beads were incubated for 2 min before PLL-PEG-biotin incubation. in parallel chambers prepared on the same coverslip. A second mix was made containing master mix, 17 µM porcine brain tubulin, 0.6 μM TRITC rhodamine-labelled tubulin and 500 pM GFP-GEF-H1. The mixture was divided equally, and either GTP or GTPγS was added to each half. All mixes were spun in an Airfuge set-up for 5 min at 20 psi. The microtubule mixes were flowed into the chambers, and the wash-in mixes were kept on ice before manually washing-in during image acquisition.
TIRF microscopy
TIRF microscopy was performed on an inverted Nikon Eclipse Ti-E research microscope equipped with azimuthal spinning TIRF illumination, a perfect focus system, and an ASI motorized MS-2000-XY stage. Imaging was carried out using a Nikon APO TIRF ×100/1.49 NA oil immersion objective in combination with an iLas2 illumination system (Roper Scientific, now Gataca Systems). Images were acquired with a CoolSNAP MYO CCD camera (Teledyne Photometrics), providing a pixel size of 0.045 μm pixel−1. Samples were maintained at 30 °C for all experiments using a Tokai Hit STXG-PLAMX-SETZ21L stage top incubator. Excitation was achieved using the following lasers: Coherent OBIS 561 nm (100 mW), Vortran Stradus 642 nm (110 mW) and Vortran Stradus 488 nm (150 mW). Emission was collected through the corresponding Chroma filters ET-GFP (49002), ET-mCherry (49008) and ET-647. Image acquisition was controlled using Metamorph software (version 7.10.2.240, Molecular Devices).
Image processing
To calculate intensity, videos were averaged over frames, and the mean intensity was calculated at the required region of interest. The ImageJ plugin KymoResliceWide v.04 was used to generate kymographs (https://github.com/ekatrukha/KymoResliceWide). To calculate lattice expansion, a straight line was drawn from the end of the bright seed to a speckle towards the plus end of the kymograph before wash-in. After flow-in, a second line was drawn between the same two points. The difference in lengths, reflecting the speckle shift, was used to calculate the percentage of expansion.
IRM to determine microtubule protofilament number
Porcine brain tubulin was isolated using the high-molarity PIPES method92. Biotin-labelled tubulin (Cytoskeleton Inc, T333P) was diluted 1:50 with unlabelled porcine brain tubulin to obtain biotin-labelled tubulin mix. Twelve protofilament microtubules were polymerized from 4 mg ml−1 of biotin-labelled tubulin for 1 h at 37 °C in 10 mM phosphate buffer supplemented with 6 mM MgCl2, 2 μM paclitaxel and 1 mM GTP (NU-1012, Jena Bioscience), according to ref. 93. Polymerized microtubules were centrifuged for 30 min at 18,000g in a Microfuge 18 centrifuge (Beckman Coulter). After centrifugation, the pellet was resuspended and kept in BRB80 supplemented with 10 μM paclitaxel at r.t. GMPCPP-stabilized 14-protofilament microtubules (and seeds for the dynamic microtubule assay) were polymerized from 4 mg ml−1 biotin-labelled tubulin for at least 3 h at 37 °C in BRB80 supplemented with 1 mM MgCl2 and 1 mM GMPCPP (Jena Bioscience, NU-405). Polymerized microtubules were centrifuged, and the pellet was resuspended as above.
For the imaging experiments, chambers were assembled by melting thin strips of parafilm between two glass coverslips silanized with hexamethyldisilazane (Sigma, 379212) and functionalized with 20 µg ml−1 anti-biotin antibodies (in BRB80; Sigma, B3640), incubated for 5 min, and 1% pluronic (F127 in BRB80; Sigma, P2443), incubated for at least 30 min.
TIRF microscopy was performed on an inverted Nikon Eclipse Ti2 (Nikon) equipped with a TIRF module and iLas illumination device (Gataca Systems), a perfect focus system and a motorized XY stage. Imaging was carried out using a Nikon APO TIRF ×60/1.49 NA oil immersion objective. Images were acquired with a PRIME BSI camera (Teledyne Photometrics), providing a pixel size of 0.072 × 0.072 μm2. Microtubules were visualized by IRM using a CoolLED pE-300 system, and excitation of fluorescently labelled tubulin was achieved using the Chroma TRF89901v2 ET 488-nm Laser Quad Band Set. Image acquisition was controlled using NIS-Elements software (version v5.42).
To measure the IRM signal of the microtubules, the background signal was first measured, then the 12-protofilament microtubules were immobilized in the chamber and their position imaged. The 14-protofilament GMPCPP-stabilized microtubules were then added to the chamber and the microtubules imaged. The dynamic microtubule assay was performed by immobilizing GMPCPP seeds on the coverslip surface, then 8 mg ml−1 of free fluorescent tubulin HiLyte488 (Cytoskeleton Inc, TL488M) was added in BRB80-based assay buffer (10 mM DTT, 20 mM D-glucose, 0.1% Tween 20, 0.05 mg ml−1 casein, 1 mM ATP, 1 mM GTP, glucose oxidase and catalase). Microtubule dynamics were measured for 5 min using both IRM and TIRF microcopy. The IRM signal of the microtubules was measured from the last frame.
The background-subtracted IRM signal, proportional to the local protein density, was used to analyse the microtubule thickness (protofilament number)94, then the mean IRM signal was measured by drawing a thick line along the microtubule. The resulting number was normalized to the signal of the 14-protofilament microtubules for the 12- versus 14-protofilament experiment as well as for the dynamic assay experiment.
Cryo-EM
Sample preparation
To ensure that the tubulin was fully depolymerized, after thawing, 50 µM porcine tubulin (Cytoskeleton) was incubated with 2 mM GTP in MRB80 on ice for 5 min. To reduce the formation of sheet-like structures, this mix was first polymerized for 10 min at 37 °C in the absence of discodermolide, followed by further polymerization for 20 min at 37 °C in the presence of 100 µM discodermolide. The polymerized microtubules were then pelleted using an Airfuge Air-Driven ultracentrifuge (5 min at 119,000g). The pellets were resuspended in MRB80 supplemented with 100 µM discodermolide to an approximate concentration of 8 µM tubulin (assuming 80% recovery). The concentration of polymerized tubulin was determined by depolymerization of a sample in MRB80 with 50 mM CaCl2 and 1 mM DTT, and measurement at A280 (extinction coefficient: 115,000 M−1 cm−1) on a NanoDrop instrument. Finally, discodermolide-bound microtubules were diluted to a concentration of 2 µM tubulin in MRB80 + 100 µM discodermolide.
Cryo-EM grid preparation and data acquisition
QUANTIFOIL holey carbon R3.5/1 Cu 200 mesh grids (Quantifoil Micro Tools) were glow-discharged at 25 mA for 45 s at 0.39 mbar (PELCO easiGlow), then 4 µl of discodermolide-stabilized microtubules were applied to the grid of an EM GP2 automatic plunge freezer (Leica) chamber. The grids were incubated at 30 °C and 95% humidity for 30 s, back-side blotted for 1.5 s and then plunged into liquid ethane. Data were recorded on a Titan Krios I set-up (The Netherlands Centre for Electron Nanoscopy (NeCEN), Leiden University, The Netherlands) equipped with a K3 summit direct electron detector and operated at 300 keV using EPU software. A magnification of 105,000×, corresponding to a nominal pixel size of 0.836 Å at the sample, was used, with a total dose of 50 e−/Å2 per exposure collected over 50 fractions (Supplementary Data 1). A defocus range of −0.6 to −2.0 µm was used (Supplementary Data 1).
Cryo-EM image processing
Videos were motion-corrected and CTF estimation was performed using cryoSPARC95,96 (Extended Data Fig. 6e). Approximately 500 particles from movies with varied defocus values and CTF estimations were manually picked, 2D-classified, and used as input for automatic filament tracing in cryoSPARC95,96. Filament tracing was performed with the separation distance set to the length of a single dimer, 82 Å. Particles were extracted in a box size twice as big as the microtubule filament diameter (~500 Å, 576 pixels) and binned by 2 (288 pixels). The particles were sorted into 11- to 16-protofilament classes by heterogeneous refinement. Particles belonging to 13- and 14-protofilament microtubules were selected for further separate processing. First, helical refinement was performed (twist = 0°, rise = 82.5 Å), followed by local refinement. Unbinned particles were then re-extracted in cryoSPARC95,96, and refined without any imposed symmetry (C1). The pixel size was calibrated in UCSF ChimeraX by maximizing the correlation of the final map with a map of a tubulin monomer generated from a previous tubulin structure (PDB 5XLT)97, to give a calibrated pixel size of 0.849 Å. Lattice parameters were calculated from a helical search of the C1 map (Extended Data Fig. 6f,g) using the Relion helix toolbox in Relion 5.098. Molecular graphics and analyses performed with UCSF ChimeraX99.
Statistics and reproducibility
No statistical methods were used to predetermine sample sizes, but our sample sizes are similar to those reported in similar studies71,73. All experiments were performed on either cultured cells or purified proteins, so there was no variability introduced by our model that would need to be balanced with randomization. For data where most treatments fit a normal distribution and one group would fit a normal distribution with the removal of one or two outliers, these outliers were excluded. Researchers performing the analysis were not blind to the treatment groups associated with the data. In many cases this was for practical reasons, for example, to check that cells transfected with a microtubule acetylating enzyme indeed had acetylated microtubules. However, the researchers involved also had no preconceived ideas as to what the results should look like.
The Kolmogorov–Smirnov test was performed to determine whether the data fit a normal distribution for >4 data points and the Shapiro Wilk test was used for 3–4 data points. If data were determined not to fit a normal distribution, a two-tailed Mann–Whitney U-test was used to test for significance between treatment and control groups. Data on acetylated and non-acetylated GEF-H1 microtubule-to-cytoplasmic ratio were also determined not to follow a normal distribution. In this case, a two-tailed Wilcoxon matched-pairs signed rank test was used, as GEF-H1 binding on both acetylated and un-acetylated microtubules was quantified in each cell. If data were determined to follow a normal distribution, a two-tailed Welch’s t-test that does not assume equal variance was used to test for significance between treatment and control groups. A P value below 0.05 was determined to be significant for all of the above-mentioned tests.
Reporting Summary
Further information on research design is available in the Nature Portfolio Reporting Summary linked to this Article.
