


Coding and non-coding drivers in GC
We analyzed the whole genome (mean coverages 29.6 and 47.0 for normal and tumor samples, respectively) and transcriptome (mean coverage 114.3 and 188.7 for normal and tumor samples, respectively) of 100 GCs, with a median follow-up of 103.5 months in surviving patients (range 3.0–230.4). Median tumor purity was estimated as 40%.
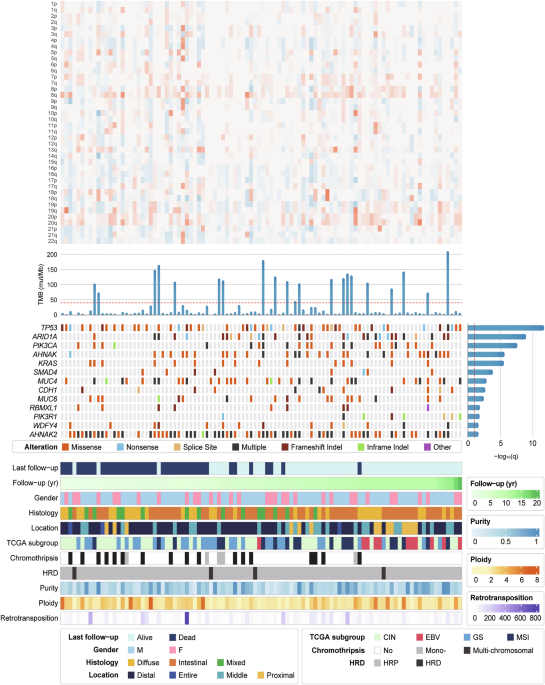
We identified 4,086,218 single nucleotide variations (SNVs) and 5,168,210 indels, and the median tumor mutation burden (TMB) of GC genomes was 7.6 mutations per megabase (mut/Mb) (range 0.4–194.5). When 79 non-hypermutated (TMB ≤ 40 mut/Mb) GCs were subjected to MutSig2CV v3.1113, 13 genes were significantly mutated with q < 0.05 (Fig. 1 and Supplementary Tables 2 and 3), and the recurrent somatic SNVs were similar to a list of recurrent mutations reported in The Cancer Genome Atlas Stomach Adenocarcinoma (TCGA–STAD) paper14. TP53 mutation was observed in 48 patients (Supplementary Fig. 2). Hyperdiploidy (ploidy ≥ 3; n = 28) was poorly prognostic (P for log-rank = 0.002).
Fig. 1: Significant somatic alterations in the genome of 100 gastric cancers (GCs).
Top panel, Heatmap for arm-level copy number gains (red) and losses (blue) of 22 autosomes. Each column represents a GC, and each row represents a chromosome arm. All samples are ordered according to increasing follow-up duration from left to right. Top histogram, Tumor mutation burden (TMB) per sample. Hypermutated GCs (n = 21) were defined as TMB > 40 mut/Mb (cutoff shown as a red, dotted, horizontal line). All hypermutated GCs, except for two, exhibited high microsatellite instability (MSI). Middle panel, Heatmap for mutation events. Recurrent (q < 0.05) somatic mutations with evidence of protein expression according to global proteomic profiling are listed vertically by q value. Right histogram, Significance level of mutations as determined by log10 transformation of MutSig2CV q value. Red line, q = 0.05. CIN chromosomal instability, EBV Epstein–Barr virus, GS genomically stable, HRD homologous recombination deficiency, HRP homologous recombination proficient.
As our MutSig2CV analysis of non-coding mutations revealed no significantly recurrent mutations, we searched for non-coding mutations previously reported in other types of cancer5. Consequently, we found TERT promoter mutation (chr5:1,295,459 G > A) in a GC with transcriptional activation of TERT15 (Supplementary Fig. 4).
In our 100 GCs, we identified a total of 39,316 somatic structural variants (SVs) (15,526 deletions, 12,156 translocations, 6027 duplications, 5319 inversions, and 288 insertions; Fig. 1). The median number of SVs was 231 per tumor (range 2–3,196), and the number of SVs was not significantly associated with prognosis (HR = 1.000 (95% CI 1.000–1.001); P = 0.32). Several potentially oncogenic SVs were identified. A GC revealed a translocation between chrX:108,150,467–108,150,468, which is similar to SVs involving the topologically associating domain (chrX:107,720,001–108,600,000) boundary near IRS4 gene that leads to transcriptional activation in lung squamous cell carcinoma and other tumor types16. This SV was associated with IRS4 mRNA overexpression in the corresponding GC tissue (Supplementary Fig. 5a). Another enhancer hijacking event involving IGF2 gene (chr11:2,138,686–2,265,093), which was previously reported in colorectal cancer16 and GC17, was observed in a GC with mRNA overexpression of the cognate gene (Supplementary Fig. 5b). According to mutational signature analyses, SBS1 signature exposure estimated by SigProfilerAssignment18, which correlated with TMB (R = 0.85; P = 2 × 10-29), was associated with favorable prognosis (Fig. 2 and Supplementary Table 4b).
Fig. 2: Mutational signatures correlated with overall survival.
Gastric cancers are ordered according to decreasing overall survival from left to right. Top panel, follow-up duration of patient, survival status, tumor mutation burden (TMB), and extrachromosomal DNA (ecDNA) status. Bottom panels, log-transformed activity (log10 (activity + 1)) of mutational signatures as calculated by SigProfilerAssignment, after excluding mismatch repair and homologous recombination deficiency signatures from microsatellite-stable and homologous recombination proficient samples, respectively. Mutational signatures are sorted according to increasing hazard ratio (HR). Left panel, HR for overall survival. SBS1 (HR = 0.54 (95% CI 0.30–0.98); P = 0.041) and DBS14 (HR = 0.62 (95% CI 0.41–0.96); P = 0.032) were associated with favorable prognosis, whereas SBS41 (HR = 1.33 (95% CI 1.07–1.66); P = 0.009) and SBS7a (HR = 1.69 (95% CI 1.17–2.45); P = 0.005) with poor prognosis. *P < 0.05; **P < 0.01. SBS single-base substitution, DBS doublet-base substitution.
According to GISTIC somatic copy number (CN) alteration analyses, there were 20 significantly (q < 0.05) recurrent amplified and 21 deleted regions14 (Fig. 3a and Supplementary Table 5a and 5b). We then sought to identify novel driver genes located within the 20 recurrent amplicons. By correlating somatic CN alteration data with transcripts per million (TPM) data, we identified 38 genes with significant cis- and trans-transcriptional activation (P < 0.001 and number of significant genes > 500, respectively; Supplementary Table 6a). We next selected four genes—XPO5, BYSL, POLR1C, and CNPY3—that were expressed at the protein level in all GCs tested for liquid chromatography–tandem mass spectrometry (LC–MS/MS) analyses and with tumor/normal protein ratio (> 1.2) out of the 29 transcriptionally activated genes in the 6p21 (chr6:41,662,844–43,681,645) locus (Supplementary Table 6b). CRISPR/Cas9 silencing of BYSL, which encodes the bystin protein, led to suppression of in vitro GC cell proliferation (Fig. 3b, c). BYSL silencing suppressed the in vivo tumorigenicity of these two cell lines when each was injected into the flank subcutaneous tissue of five Balb/c nude mice (P for chi-square = 0.01 and 0.11 for MKN-45 and SNU-638, respectively; Fig. 3d). These data are consistent with data in the literature of glioblastoma19 and hepatocellular carcinoma20. Our 6p21-amplified GCs (n = 8) exhibited poorer prognosis than those without (HR = 4.16 (95% CI 1.82–9.50); P = 0.0007). Thus, the current study unveiled a previously unrecognized role of 6p21 amplifications in the development and progression of GC and identified BYSL as a putative oncogene candidate located in this amplicon for the first time in GC.
Fig. 3: BYSL as a novel oncogene candidate in gastric cancer.
a Amplifications and deletions according to GISTIC analyses. b MTT assays after BYSL silencing. Significant (P < 0.01) suppression of monolayer proliferation of MKN-45 and SNU-638 gastric cancer cells after CRISPR/Cas9 knockout (KO) of BYSL. Bottom, Western blot. c MTT assays in SNU-638 showing no significant growth inhibition after silencing the other three genes in 6p21 (chr6:41,662,844–43,681,645) locus—XPO5, POLR1C, and CNPY3—with significant cis- and trans-transcriptional activation and protein overexpression in the tumor. d In vivo validation. BYSL-targeting gRNA-transduced gastric cancer cells showed reduced in vivo tumorigenicity.
Chromothripsis is a poor prognostic factor in GC
We evaluated different types of chromosomal instability in GC, starting with chromothripsis, a catastrophic event leading to chromosomal instability (Supplementary Table 7). Detection of chromothripsis was primarily based on high-confidence calling per ShatterSeek5,6, but we also visually inspected the data to exclude multistep genomic rearrangements. After filtering out three high-confidence ShatterSeek calls by manual curation, we identified a total of 38 chromothripsis events across the 100 GC genomes.
Twenty-two GCs harbored at least one chromothripsis event, and the chromothripsis rate was similar to that of GCs included in the PCAWG consortium study6. Age, gender, histology subtype, and primary tumor location were not different between GCs with chromothripsis (n = 22) and those without (n = 78). Chromothripsis was more frequent in hyperdiploid tumors (39.3%) than in diploid tumors (15.3%; P for chi-square = 0.009). The chromothripsis rate was higher in TP53 mutant tumors (28.2%) than in wild-type tumors (16.7%), but the difference was not significant (P for chi-square = 0.16).
Notably, the number of chromothripsis events in the tumor was associated with poor prognosis (hazard ratio (HR) for death of 1.22 (95% CI 1.00–1.48); P = 0.047). Consistent with this finding, 22 GCs that harbored at least one chromothripsis event had worse prognosis than those without chromothripsis (P for log-rank = 0.041; Fig. 4a). Median survival times were 4.6 years (95% CI 2.2–not reached) and not reached in those with chromothripsis and those without, respectively.
Fig. 4: Chromothripsis, extrachromosomal DNA (ecDNA) and in-frame gene fusions.
a Kaplan–Meier curves for overall survival according to the presence (n = 22) or absence (n = 78) of chromothripsis (P for log-rank test = 0.041). b Circos plot of the entire genome for multichromosomal chromothripsis events. c Overlap between chromothripsis and circular ecDNA formation among 100 gastric cancers (GCs). d Kaplan–Meier curves for overall survival according to the presence (n = 31) or absence (n = 69) of ecDNA (P for log-rank test = 0.050). e mRNA expression levels of amplified genes located in ecDNA genomic loci compared with genes not located in ecDNA loci (P for t-test < 0.001). f Example of focal amplification of CCNE1 localized to a genomic locus that harbored both ecDNA (chr19:29,956,167–30,336,096) and chromothripsis (chr19:28,420,071–56,841,113). g Circos plot of in-frame gene fusions (n = 25). h In-frame gene fusions with overexpression of 3’ partner genes (n = 16). Left panel, gene name and chromosomal end of the 5’ partner gene. Right panel, chromosomal start, gene name, and log2 (TPM + 1) of the 3’ partner gene of each fusion-positive GC (red circle). Box plot, the remaining fusion-negative GCs (n = 99); Vertical red line, z = 1.96. CN copy number, TPM transcript per million.
In 17 patients, 21 of 38 (55.3%) chromothripsis events involved multiple chromosomes. Of the 21 multichromosomal chromothripsis events, 14 (66.7%) involved three chromosomes and 7 (33.3%) involved two chromosomes (Fig. 4b). No predilection of chromothripsis events for a specific chromosome was observed. The risk of death increased by 2.8-fold per multichromosomal chromothripsis event in the tumor (HR = 2.75 (95% CI 1.40–5.42); P = 0.003; Supplementary Fig. 18).
We then evaluated if circular extrachromosomal DNA (ecDNA) might be a possible mechanistic link to the poor prognosis associated with chromothripsis, which is a major driver of ecDNA8,21. Indeed, GCs with ecDNA tended to exhibit more frequent chromothripsis than GCs without ecDNA (32.3% vs. 17.4%; P for chi-square = 0.12; Fig. 4c). Furthermore, ecDNA positivity showed a borderline association with poor prognosis (HR = 1.85 (95% CI 0.99–3.44); P for log-rank test = 0.05; Fig. 4d). Focal amplifications localized to the ecDNA loci were transcriptionally activated compared with those not localized to the ecDNA loci (P for t-test < 0.001; Fig. 4e). Fig. 4f shows an example of focal amplification and mRNA overexpression of CCNE1 localized to genomic locus involving both chromothripsis and ecDNA. These data suggest that chromothripsis may be poorly prognostic, at least partially, via ecDNA formation.
To evaluate the possible contribution of in-frame fusion to the poor prognosis associated with chromothripsis, we also searched for in-frame fusions in our whole transcriptomic data. A total of 25 in-frame gene fusions that were not previously identified in our own study for diffuse-type GCs3 were identified (Fig. 4g and Supplementary Table 12). None of these in-frame gene fusions were recurrent among 100 GCs. Sixteen of 25 in-frame fusions were associated with mRNA overexpression of 3’ partner genes (Fig. 4h). Included among these 16 partner genes were SLC1A2, which has been previously reported as a 3’ partner for CD44–SLC1A2 fusion22, and CREB3L1 that promotes the growth of anaplastic thyroid carcinoma23. However, no breakpoints of these 16 fusions were localized to genomic loci harboring chromothripsis.
Copy number signatures are also associated with prognosis in GC
We then evaluated the performance of simpler methods analyzing chromosomal instability in GC. CN signature, defined by a 48 context CN classification scheme, is based on characteristic patterns of CN changes24. No studies have been conducted to test the potential clinical utility of CN signatures in GC. According to the k-means clustering of CN signature attributions, 100 GC genomes were divided into two distinct groups (Fig. 5a). One group (n = 61) was attributed the CN9 signature, whereas the remaining group (n = 39) was attributed CN3, CN4, CN5, CN6, CN7, CN8, CN19, CN20, and CN21 mutational signatures (non-CN9). The two groups differed in the distribution of molecular subtype (P for Fisher’s exact test < 0.0001; Supplementary Table 14). CN4, CN5, CN6, and CN20 signatures were more active in chromothripsis-positive tumors than in chromothripsis-negative tumors (Supplementary Table 13).
Fig. 5: Copy number (CN) signatures.
a The k-means clustering of CN attributions of 100 gastric cancers (GCs). b Kaplan–Meier curves for overall survival for CN9 and non-CN9 groups (P for log-rank test = 0.003). c Top heatmap, Attribution of CN signatures in 100 GCs. Case ordering according to increasing follow-up duration from left to right. d The k-means clustering of CN attributions of the independent ICGC dataset (n = 81). e Trend for more favorable overall survival of ICGC dataset (d) associated with CN9 signature (HR = 0.58 (95% CI 0.18–1.90); P for log-rank test = 0.36). ICGC International Cancer Genome Consortium.
Notably, the CN9 group (n = 61) showed significantly better prognosis than the non-CN9 group (n = 39; P for log-rank test = 0.003), with an HR for death of 0.41 (95% CI, 0.22-0.75) (Fig. 5b, c). Median survival time was not reached and 5.5 years (95% CI, 1.8-not reached), in the CN9 and non-CN9 groups, respectively. We also observed a trend for better prognosis with CN9 signature in an independent International Cancer Genome Consortium (ICGC) dataset (n = 81; HR = 0.58 (95% CI 0.18–1.90); P for log-rank test = 0.36; Fig. 5d, e). These results collectively indicate that CN signature might be used as a simple method to evaluate the prognostic implications of chromosomal instability in GC.
HRD, present in 4% of GCs, is associated with overexpression of immune-related genes
The exact incidence and genomic causes of HRD have not been fully characterized for GC. Therefore, we evaluated the HRD status of 100 GCs using a random forest-based method—Classifier of HOmologous Recombination Deficiency (CHORD)—which analyzes specific SNV, indel, and SV types identified by WGS25, and using HRDetect26. When PHRD and HRDetect scores ≥ 0.4 were used to distinguish HRD tumors from homologous recombination proficient (HRP) tumors, 4 of 100 GCs (4%) were defined as HRD.
A tumor with the highest PHRD score (0.89) showed RAD51D duplication with LOH, BRCA2 SNV (p.T325Lfs*21), and BRCA1 LOH. The other three HRD GCs harbored homozygous deletion of BRCA1/RAD51C/RAD51D, BRCA1 promoter methylation, and PALB2 duplication with LOH combined with RAD51D inversion with LOH (Fig. 6a). HRD in the current dataset was attributed entirely by somatic alterations, without any germline mutations in homologous recombination pathways (Supplementary Table 8a).
Fig. 6: Homologous recombination deficiency (HRD) and 12-chemokine expression.
a Genomic alterations underlying HRD. Middle panel, CHORD PHRD and HRDetect scores of 100 gastric cancers (GCs). Dotted horizontal red lines indicate cutoffs for defining the HRD tumor (PHRD and HRDetect scores ≥ 0.4, upper-left inset). Case ordering according to decreasing PHRD from left to right, for HRD (left of vertical red line) and HRP (right) GCs, respectively. Upper-left inset. HRD GCs (n = 4; expanded from the middle panel). The biallelic status of BRCA1, BRCA2, PALB2, RAD51C, and RAD51D are shown. b KEGG pathways significantly enriched in mRNAs that were more highly expressed in HRD GCs (n = 4) than in HRP GCs (n = 96) (X-axis, FDR in -log10 scale). c Log10-transformed sum of the 12-chemokine expression signature for HRD (n = 4) versus non-EBV/non-MSI HRP (n = 66) groups in 70 non-EBV/non-MSI GCs (P for t-test = 0.029). d Validation in the TCGA dataset. Log10-transformed sum of the 12-chemokine expression signature for BRCA1/2-mutant (n = 7) versus BRCA1/2-wild type (WT), non-EBV/non-MSI TCGA–STAD (n = 306) GCs (P for t-test = 0.15). CHORD Classifier of HOmologous Recombination Deficiency, EBV Epstein–Barr virus, HRP homologous recombination proficient, KEGG Kyoto Encyclopedia of Genes and Genomes, MSI microsatellite instability, TCGA–STAD The Cancer Genome Atlas Stomach Adenocarcinoma.
The anatomic location of all four HRD tumors was the distal third of the stomach (P for chi-square = 0.37; Supplementary Table 8a). Age, gender, histology, ploidy, and TP53 mutation status were not different according to HRD status, and all of the four HRD GCs were negative for Epstein–Barr virus (EBV) and microsatellite instability (MSI). We observed a trend for better prognosis with HRD positivity, but the small number of HRD GCs precluded meaningful survival assessment (Supplementary Fig. 20).
We then compared RNA sequencing data between HRD (n = 4) and HRP (n = 96) tumors to identify potential therapeutic targets for GC with HRD (Supplementary Table 9). Unexpectedly, the most significantly enriched KEGG pathway in HRD GCs was chemokine signaling (CCL22/PTK2B/CCL23/CCL11/ADCY8/CCR6/CCL19/TIAM1/ITK/CCL5/GNGT1/CXCR3/CCR7/CX3CR1/DOCK2/CCR2/ADCY5/RASGRP2/PLCG2/WAS/GNG7), followed by NK (NCR2/PTK2B/CD247/ARAF/CD48/ITGAL/PTPN6/KLRC4-KLRK1/KLRC3/ZAP70/NCR3/SH2D1A/PLCG2/KLRK1) and B cell receptor signaling (CD79A/BANK1/PTPN6/CD79B/BLK/INPP5D/FCGR2B/PLCG2/BTK) pathways (Fig. 6b)27.
When HRD and non-EBV/non-MSI HRP GCs were compared for the sum of 12 chemokines, which reflects intratumoral immune reaction28 (Supplementary Fig. 21), the sum was significantly higher in HRD GCs (n = 4) than in non-EBV/non-MSI HRP GCs (n = 66; P for t-test = 0.029; Fig. 6c). The sum of 12 chemokines also significantly correlated with the PHRD of 70 non-EBV/non-MSI GCs (R = 0.35, P = 0.003). Other than PHRD, only the coding indel/SNV ratio significantly correlated with the summed RNA expression levels of the 12 chemokines (R = 0.44, P = 0.0001). To obtain possible mechanistic insights into the chemokine overexpression, we compared TMB and neoantigen load between our HRD (n = 4) and HRP, non-EBV/non-MSI GCs (n = 66). There was no difference in TMB and neoantigen load between the two groups (Supplementary Table 18). Therefore, overexpression of 12 chemokines in HRD GCs is unlikely to be due to the overproduction of HRD-induced neoantigens. These data collectively propose a hypothesis that unrepaired DNA lesions might have activated innate immunity of HRD GCs without forming neoantigen29,30,31,32,33. When our finding of chemokine overexpression in HRD GCs was tested in an independent dataset, the sum of 12 chemokines tended to be higher in BRCA1/2-mutant TCGA–STAD GCs than in wild-type GCs (P for t-test = 0.15; Fig. 6d).
Somatic retrotransposition events are most strongly associated with global hypomethylation in the tumor
Given that immune checkpoint blockade is efficacious only in GC with immune activation34, we further explored gene expression correlates of genomic instability beyond HRD. Retrotransposition can generate DNA double-strand breaks that may contribute to chromosome fragmentation35,36. We therefore evaluated retrotransposition-associated expression profiles in our GCs using ORF1p protein expression level as a surrogate biomarker for its activity. According to LC–MS/MS global proteomic profiling analyses of a subset of our non-EBV/non-MSI GCs (n = 23), protein expression level of ORF1p positively correlated with those of 701 proteins (R > 0.413; P < 0.05) (Fig. 7a and Supplementary Table 10a). Supplementary Table 27 summarizes KEGG pathways enriched in 701 proteins significantly (FDR < 0.05) correlating with ORF1p in protein expression profiles. In addition to the spliceosome pathway, nucleocytoplasmic transport, mRNA surveillance, DNA replication, and repair, and antigen processing and presentation pathways were enriched in 701 proteins whose protein expression levels correlated with that of ORF1p. Included in antigen processing and presentation pathway were HSPA2, HSP90AA1, HLA-A, HSPA1L, HSPA4, HLA-DRB4, HSPA5, HSPA8, CREB1, HSPA6, PSME3, TAP2, and HSP90AB1 (Fig. 7a). cGAS protein expression level also tended to positively correlate with ORF1p expression level (R = 0.34; P = 0.11). These data could raise a hypothesis that ORF1p-activated immunogenic cytosolic nucleic acids eventually contributed to the overexpression of antigen processing and presentation pathway proteins.
Fig. 7: Retrotransposition.
a Liquid chromatography–tandem mass spectroemetry global proteomic profiling data of a subset of 23 non-EBV/non-MSI gastric cancers (GCs) of the 100 patients in the main study population. Top panel, Heatmap for expression levels of antigen processing and presentation pathway proteins across 23 non-EBV/non-MSI GCs. Red and blue colors representing high and low protein expression levels, respectively. Data after median protein centering. Bottom panel, ORF1p protein expression level in the tumor. Case ordering according to decreasing ORF1p protein expression. b, c Proteome data in an independent set of 70 early-onset GCs. b T cell receptor KEGG pathway enriched in ORF1p-correlated proteins (shown as red stars) among an independent set of 70 early-onset GCs. c Heatmap for ORF1p-correlated KEGG pathways among an independent set of 70 early-onset GCs. Upper panel, Natural killer cell-mediated cytotoxicity. Middle panel, Fc gamma R-mediated phagocytosis. Bottom panel, B cell receptor pathways. d, e Whole genome sequencing data (n = 100). d Retrotransposition events were best modeled by hypomethylation (> 20%), older age (> 62 years), and the presence of chromothripsis. Dots, coefficients of linear regression (whiskers, 95% CI) (adjusted P values = 0.008, 0.09, and 0.28, respectively). e Correlation between the number of coverage-adjusted genomic retrotransposition events and the degree of hypomethylation in the tumor (R = 0.27; P = 0.008). f Correlation with patient age (R = 0.15; P = 0.14). EBV Epstein–Barr virus, KEGG Kyoto Encyclopedia of Genes and Genomes, MSI microsatellite instability.
We wished to validate this interesting finding in independent datasets, but there were no publicly available proteomic datasets for GC tissue samples other than our prior study37. Therefore, we had to reanalyze our own prior published data for validation. In 70 early-onset GCs that were negative for EBV and MSI, the nucleocytoplasmic transport and DNA replication and repair pathways were again enriched among 3,140 proteins correlated with ORF1p in protein expression ratio between tumor and adjacent normal tissue of the same patient (R > 0.2355; P < 0.05; Supplementary Table 28). Notably, T cell receptor pathway was also enriched in these ORF1p-correlated proteins (Fig. 7b). When we focused on 476 proteins with the most significant ORF1p correlations (R > 0.405; P < 0.005) among the same set of 70 non-EBV/non-MSI early-onset GCs, natural killer cell-mediated cytotoxicity, Fc gamma R-mediated phagocytosis, Fc epsilon RI signaling, and B cell receptor pathways were included in 15 significant KEGG pathways (Fig. 7c).
Global hypomethylation is associated with genomic retrotransposition events
Across our 100 paired genomes, a total of 3,965 somatic retrotransposition events occurred (median 16 per tumor; range 0–773), with LINE-1 representing the majority of somatic retrotranspositions (87%), according to TraFiC-mem analyses38. The number of somatic retrotransposition events was not associated with the overall survival of our cohort of 100 patients with GC. Genomic retrotransposition events were more frequent in GCs with global hypomethylation (n = 21), which was defined by ≥ 20% CpGs being hypomethylated in the tumor compared with normal (Δβ < −0.2), than in GCs without hypomethylation (n = 79; Fig. 7d,e). According to the Elastic Net algorithm39, the number of coverage-normalized retrotransposition events was best modeled as follows:
$${\mathrm{Retrotransposition}}\,=\,61.63\,\left({\mathrm{global}}\,{\mathrm{hypomethylation}}\right)\,+\,32.18\,\left({\mathrm{age}}\, > \,62\right)\,+\,20.37\,\left({\mathrm{chromothripsis}}\right)\,+\,3.71$$
where each variable was coded as 1 if present and 0 otherwise.
Although patient age and global hypomethylation in the tumor are associated with retrotransposition40,41, to our knowledge, the current paper is the first to present a comprehensive regression model for retrotransposition in GC (Fig. 7d). Moreover, these results provide additional evidence for a possible contribution of retrotransposition to chromothripsis in solid tumors.
Finally, these results led us to explore clinicopathological and genomic correlates of global hypomethylation in our GCs (Fig. 8). Unlike retrotransposition, global hypomethylation itself showed no tendency to be associated with patient age (Figs. 7f and 8a). As previously reported42, hypomethylation was more prominent in intestinal-type GC. Helicobacter pylori status was not associated with the degree of hypomethylation. Notably, global hypomethylation was more prominent in GCs with higher burden of SVs, chromothripsis, ecDNA, hyperdiploidy, and TP53 mutation. Thus, our study is the first comprehensive, quantitative analysis of global hypomethylation in relation to specific types of chromosomal instability in GC.
Fig. 8: Global hypomethylation.
Percentage of hypomethylated (βtumor − βnormal (Δβ) < −0.2) CpGs in the tumor according to: a Age (P for Pearson = 0.48); b Histology (P for t-test = 0.03); c Gender (P = 0.51); d TNM stage (P = 0.94); e Microsatellite instability (MSI; P = 0.86); f Epstein–Barr virus (EBV; P = 0.005); g Chromosomal instability (CIN; P = 0.001); h Helicobacter pylori (H. pylori; P = 0.78); i Structural variant (SV) count (P for Pearson = 0.008); j Chromothripsis (P = 0.04); k Extrachromosomal DNA (ecDNA; P = 0.003); l Ploidy (P < 0.001); m TP53 mutation (P = 0.01); n Homologous recombination deficiency (HRD; P = 0.02); o CpG island methylator phenotype (CIMP; P = 0.08). Box, interquartile range (IQR). Bar, median; *P < 0.05; **P < 0.01; ***P < 0.001. NS not significant.
