


Spatial transcriptomics identifies two functionally distinct macrophage programs in ENKTL
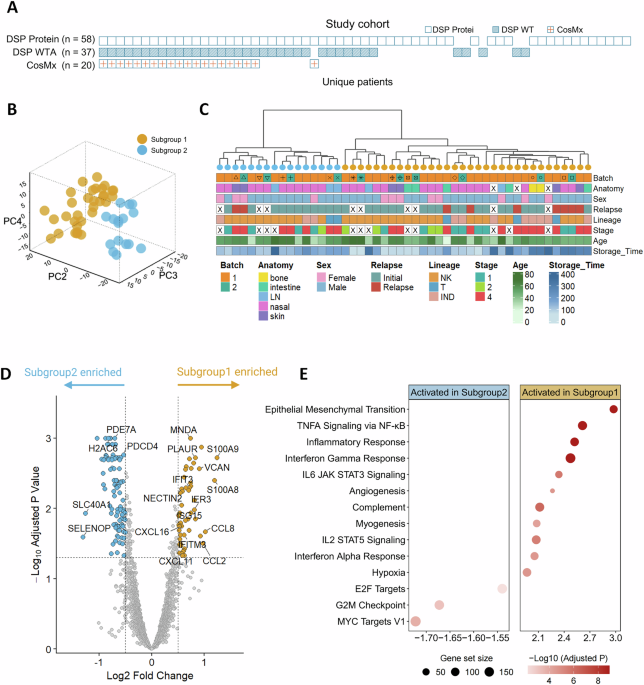
To obtain region-resolved tumor and macrophage programs in ENKTL, we integrated spatial transcriptomic and proteomic profiling of formalin-fixed, paraffin-embedded (FFPE) patient tissues using the GeoMx DSP whole transcriptome atlas and immuno-oncology protein panel, with additional single-cell spatial profiling by CosMx SMI (Supplementary Fig. 2A). In the GeoMx workflow, immunofluorescence-guided segmentation was used to define CD68+ and CD3+ areas of interest (AOIs) (Supplementary Fig. 3A), corresponding to macrophage/myeloid and tumor compartments, whereas CosMx enabled single-cell spatial profiling without predefined masking [15, 16]. After quality control, 58 samples were included for DSP proteomics, 40 samples from 37 patients for DSP transcriptomics, and 20 samples for CosMx analysis, with 19 patients represented across all three platforms (Fig. 1A). Principal component analysis (PCA) indicated that sample storage time was a technical source of variation in the WTA data, and accordingly, PC1 was excluded from clustering analyses and FFPE storage time was adjusted for in differential expression analysis using a generalized linear model (Supplementary Fig. 3B and Supplementary Methods).
Fig. 1: Spatial transcriptomics identifies two functionally distinct macrophage programs in ENKTL.
A Cohort overview across spatial omics platforms. Unique patient numbers for DSP Protein (n = 58), DSP WTA (n = 37) and CosMx SMI (n = 20) are indicated above, with overlapping samples (n = 19) shown in the dashed box. B Unsupervised clustering of ROI-level transcriptomic profiles from CD68+ segments identified two patient subgroups. C Clinical and technical metadata were assessed across the two patient subgroups. Replicate ROIs from the same patient clustered closely together, as indicated by the symbols in the Batch row, suggesting reproducible macrophage signatures at the patient level despite local sampling variation. D Differential expression analysis identified a pro-inflammatory program in Subgroup 1 (S100A8/A9, VCAN, CCL2/8) contrasting with a homeostasis program in Subgroup 2 (SLC40A1, SELENOP). E GSEA revealed that Subgroup 1 was characterized by inflammatory responses and interferon signaling pathways, while Subgroup 2 exhibited enrichment in pathways related to cellular proliferation. DSP digital spatial profiling, WTA whole transcriptome atlas, SMI spatial molecular imaging, ROI region of interest, GSEA gene set enrichment analysis.
We first verified the AOI-masking strategy using curated tumor and macrophage-associated signatures as previously described [17]. In the WTA data, macrophage and malignant cell gene signatures were strongly (p < 0.001) enriched in the CD68+ and CD3+ segments, respectively, consistent with the IF-defined compartments (Supplementary Fig. 3C). Differential expression analysis between the two segments further confirmed enrichment of lineage-specific genes in each compartment (Supplementary Fig. 3D), supporting the specificity of the segmentation approaches and reliability of the GeoMx platform.
We next focused on the CD68+ macrophage-enriched segments to investigate macrophage-associated transcriptional heterogeneity in ENKTL. Unsupervised clustering of region of interest (ROI)-level CD68+ transcriptomes resolved two major subgroups of ENKTL samples (Fig. 1B). These groups were principally separated by myeloid-associated programs and did not show obvious correlation with the major technical or clinicopathological variables (Fig. 1C, Supplementary Fig. 3E, F). In addition, replicate samples from the same patient clustered closely together, indicating that the macrophage signatures were reproducible at the patient level despite local sampling variation (Fig. 1C).
Differential expression analysis indicated that Subgroup 1 was enriched for genes associated with myeloid activation (S100A8/A9, CCL2/8) and interferon (IFN)-related responses (IFIT3/IFITM3), while Subgroup 2 showed elevated expression of SLC40A1 and SELENOP, suggesting a distinct macrophage program involved in iron and selenium metabolism (Fig. 1D) [18, 19]. Consistent with this, gene set enrichment analysis (GSEA) showed that Subgroup 1 was strongly associated with inflammatory and immune response pathways, including TNFα signaling via NF-κB, and interferon-α/γ responses, whereas Subgroup 2 was characterized by cell cycle/proliferative signatures (Fig. 1E). Similar findings were observed when the samples were analyzed according to nasal and non-nasal sites (Supplementary Fig. 4A, B).
To determine whether these macrophage-defined subgroups were accompanied by corresponding differences in the tumor compartment, we analyzed the matched CD3+ tumor segments. Notably, Subgroup 1 tumors showed increased expression of immune checkpoint-related genes (CD274), whereas Subgroup 2 showed relative enrichment of KLRB1 (CD161), and ZFP36L2, which encodes an RNA-binding protein implicated in restraining IFN-γ production (Supplementary Fig. 5A) [20]. In line with these findings, deconvolution of the CD3+ segment transcriptomics using the tumor subgroup annotations from an independent ENKTL scRNA-seq reference further revealed enrichment of a previously reported CXCL13+ tumor subset in Subgroup 1, which was also characterized by elevated CD274 expression (Supplementary Fig. 5B, C) [10].
Together, these spatial transcriptomic analyses uncovered two functionally distinct macrophage-defined patient subgroups, with corresponding differences across the macrophage and tumor compartments, highlighting macrophage heterogeneity as a key axis of TME diversity in ENKTL.
Proteomic profiling confirms immune-activated and immune-quiescent ENKTL subgroups
We next asked whether these subgroup differences were preserved at the protein level. To this end, we performed spatial proteomic profiling of the CD68+ macrophage and CD3+ tumor segments. After correction for FFPE storage time and removal of low-abundance proteins (Supplementary Fig. 6A, B and Supplementary Methods), the retained markers displayed clear segment-specific expression patterns (Supplementary Fig. 6C). In samples profiled by both GeoMx WTA and proteomics, the RNA and protein expression levels showed overall positive correlation across platforms (Supplementary Fig. 6D).
In the CD68+ macrophage-enriched segments (Supplementary Fig. 7A), Subgroup 1 exhibited enrichment of the co-stimulatory molecule CD40 (p = 0.0094) and STING (p = 0.011), an innate immune signaling mediator (Fig. 2A) [21, 22]. In addition, Subgroup 1 showed higher expression of immune-regulatory molecules, including VISTA (p = 0.047), IDO1 (p = 0.0014), and PD-L1 (p = 0.002) (Fig. 2A), supporting a myeloid compartment characterized by simultaneous immune activation and immune-regulatory features [23]. Similar findings were observed when the samples were analyzed according to nasal and non-nasal sites (Supplementary Fig. 7C). By contrast, the more subdued protein expression landscape in the macrophage segment in Subgroup 2 mirrors its immune-quiescent transcriptomic profile (Supplementary Fig. 7A).
Fig. 2: Proteomic profiling confirms distinct immune-activated and immune-quiescent ENKTL patient subgroups.
A DSP protein profiling of CD68+ segments identified significant differences in protein expression between the two patient subgroups. Higher expression of CD40, STING, VISTA, IDO1, PD-L1, and CD68 was observed in Subgroup 1 than in Subgroup 2, consistent with the DSP WTA findings (two-sided Wilcoxon rank-sum test). B Multiplex immunofluorescence (mIF) analysis quantified CD68 + , IDO1 + , and STING+ cells as a proportion of total cells in each sample. The proportions of CD68 + , IDO1 + , and STING+ cells were significantly higher in Subgroup 1 than in Subgroup 2, further validating the DSP protein findings (two-sided Wilcoxon rank-sum test). The higher proportion of CD68+ cells in Subgroup 1 suggested denser macrophage infiltration. C Representative mIF images of CD68, IDO1 and STING expression in a Subgroup 1 case (top) and Subgroup 2 case (bottom). The first row shows original mIF staining, and the second row displays the corresponding cell segmentation and quantification results, with colored dots indicating marker-positive cells (IDO1+ cells or STING+ cells) and blue shading denoting macrophages (CD68+ cells). D Boxplots of protein expression in the CD3+ (tumor) segment from DSP protein profiling, comparing the two patient subgroups, showed elevated expression of immune checkpoint markers (PD-L1 and TIM3), co-stimulatory molecules (OX40L and CD137), MHC-II molecules (HLA-DR) and GZMB in Subgroup 1 relative to Subgroup 2 (two-sided Wilcoxon rank-sum test). Box plots in A, B, D show medians (lines), interquartile ranges (IQR) (boxes), and ±1.5 × IQR (whiskers), with each dot representing one patient sample. DSP digital spatial profiling, WTA whole transcriptome atlas, mIF multiplex immunofluorescence, IQR interquartile range.
We further validated these protein-level differences by multiplex immunofluorescence (mIF). Subgroup 1 showed significantly denser CD68+ macrophage infiltration than Subgroup 2 (p < 0.001), together with increased abundance of total IDO1+ and STING+ cells (Fig. 2B), further supporting a macrophage-rich and immune-active microenvironment. Representative mIF images illustrated these differences (Fig. 2C). Within the macrophage compartment, both IDO1 + CD68+ and STING + CD68+ double-positive macrophages were significantly enriched in Subgroup 1 (Supplementary Fig. 7B), indicating polarization towards a more activated state with immune-regulatory features. Collectively, these mIF findings are concordant with the GeoMx DSP protein data and support a macrophage-enriched, immune-active yet immune-regulated myeloid state in Subgroup 1.
Protein-level differences were also evident in the matched CD3+ tumor-rich segment (Supplementary Fig. 8A, C). Subgroup 1 showed higher expression of the immune-regulatory molecules PD-L1 (p < 0.001) and TIM3 (HAVCR2) (p < 0.001), as well as the co-stimulatory markers OX40L (TNFSF4) (p = 0.0094) and CD137 (TNFRSF9) (p = 0.0028), pointing to a tumor compartment with both suppressive and stimulatory immune features (Fig. 2D). Increased HLA-DR expression (p < 0.001) within the tumor compartment suggested enhanced antigen presentation capacity in the tumor compartment (Fig. 2D). Consistent with these findings, mIF validation demonstrated that Subgroup 1 samples harbored a higher proportion of PD-L1-expressing tumor cells than Subgroup 2 (p = 0.029) (Supplementary Fig. 8B). Notably, this combination of immune-regulatory, co-stimulatory, and antigen presentation-associated features closely resembled the profile of the previously reported CXCL13+ tumor subset (Supplementary Fig. 5C), suggesting that the macrophage-defined subgrouping may reflect broader underlying biological differences across the tumor microenvironment [10].
Single-cell spatial profiling refines subgroup-associated inflammatory and immune-regulatory monocyte/macrophage subsets
To assign subgroup-associated macrophage programs to specific myeloid populations, we next performed CosMx SMI on an overlapping subset of ENKTL samples (n = 19). After quality control and data integration [24], the resulting single-cell spatial dataset resolved the ENKTL microenvironment into five major cellular lineages (Supplementary Fig. 9A–F, 10A–E and Supplementary Methods) with 37 annotated cell subtypes, defined by canonical marker gene expression (Supplementary Fig. 11A–C and Supplementary Table S5) [24].
Subgroup 1 exhibited a significantly higher monocyte/macrophage-to-total cell ratio than Subgroup 2 (p < 0.01, Fig. 3A), consistent with denser CD68+ cell infiltration observed by mIF (Fig. 2B). No significant differences were detected in the proportions of the other major cell lineages.
Fig. 3: Single-cell spatial profiling refines subgroup-associated inflammatory and immune-regulatory monocyte/macrophage subsets.
A Stacked bar plots showing the proportions of major cell subsets among total cells in Subgroup 1 and Subgroup 2, with whiskers indicating the standard error of the mean across patient samples. Monocytes/macrophages were enriched in Subgroup 1 (two-sided Wilcoxon rank-sum test). B UMAP visualization of the myeloid compartment. Five monocyte/macrophage subsets were identified, including APOE_C1q_Mac, STAB1_Mac, Monocyte, IL1B_Mac, and MT_Mac, together with cDC and LAMP3_DC dendritic cell populations. C Dot plot showing the expression of key marker genes across myeloid cell subsets. Dot size indicates the proportion of cells expressing each gene and color denotes the relative scaled expression level. D Heatmap showing selected gene programs across monocyte/macrophage subsets. Monocytes, MT_Mac and IL1B_Mac exhibited higher IFN-α, IFN-γ and damage-associated molecular pattern (DAMP)-related signatures, together with increased immune checkpoint features, particularly in IL1B_Mac. In contrast, STAB1_Mac and APOE_C1q_Mac were enriched for scavenger receptor-associated programs. E Stacked bar plots showing the proportions of monocyte/macrophage subsets relative to total cells in the two patient subgroups, with whiskers indicating the standard error of the mean across patient samples. All five subsets were enriched in Subgroup 1 relative to Subgroup 2, with the most significant increases observed in monocytes, MT_Mac, and IL1B_Mac (two-sided Wilcoxon rank-sum test). F Donut charts depicting the distribution of monocyte/macrophage subsets in Subgroup 1 and Subgroup 2. Proportions were calculated relative to the total monocyte/macrophage compartment. Subgroup 1 was enriched for inflammatory IL1B_Mac, MT_Mac, and monocyte subsets, whereas Subgroup 2 was skewed toward the STAB1_Mac subset. Arrows indicate increase (▲) or decrease (▼) in Subgroup 1 relative to Subgroup 2. *p < 0.05, **p < 0.01, ***p < 0.001. UMAP, uniform manifold approximation and projection, Mac macrophage, cDC conventional dendritic cell, DC dendritic cell, MT metallothionein, IFN interferon.
We next subclustered the myeloid compartment in the CosMx dataset and identified five monocyte/macrophage populations together with conventional dendritic cells (DCs) and LAMP3 DCs based on their unique gene signatures (Fig. 3B, C, Supplementary Table S6) [25]. Functionally, these monocyte/macrophage states segregated along two broad axes (Fig. 3B). One axis comprised STAB1_Mac and APOE_C1q_Mac, which were enriched for scavenger (MRC1/STAB1) and lipid-handling programs (APOE/APOC1) (Fig. 3C, D) with homeostasis-related features (SLC40A1/SELENOP) (Supplementary Fig. 12A, B) [26,27,28]. Specifically, APOE_C1q_Mac additionally displayed enhanced antigen presentation features, including higher expression of MHC class II molecules and lysosomal programs involved in antigen processing (Supplementary Fig. 12C, D). By contrast, monocytes, IL1B_Mac and metallothionein macrophages (MT_Mac) formed a second axis characterized by an inflammatory profile with upregulation of chemokine secretion (CCL2/8, CXCL9/10/11), interferon responses and increased expression of immune-regulatory molecules (CD274/IDO1) (Fig. 3D, Supplementary Fig. 12C). Within this inflammatory axis, IL1B_Mac showed the strongest immune-regulatory and IFN-γ response features, while monocytes were more prominently associated with innate immune activation, including STING pathway and IFN-α responses (Fig. 3D, Supplementary Fig. 12C, D), suggesting that GeoMx-derived macrophage signatures reflect cooperative yet different contributions from multiple myeloid subsets.
Quantification of subset abundance relative to total cells showed overall enrichment of all five subsets in Subgroup 1 compared with Subgroup 2, with the most marked increases observed in monocytes, MT_Mac and IL1B_Mac (p < 0.01, Fig. 3E, Supplementary Fig. 12E). By contrast, when normalized to the total monocyte/macrophage compartment, Subgroup 1 remained enriched for inflammatory and immune-regulatory states, including monocytes, IL1B_Mac and MT_Mac, whereas Subgroup 2 was skewed towards STAB1_Mac, suggesting that the lower myeloid infiltration is associated with a more scavenger-biased macrophage phenotype (Fig. 3F). Similar findings were observed when the samples were analyzed according to nasal and non-nasal sites (Supplementary Fig. 12F, G), indicating that the biological differences identified between Subgroup 1 and Subgroup 2 are not primarily driven by tissue origin.
Collectively, our results showed that higher myeloid infiltration in Subgroup 1 is coupled to inflammatory and immune-regulatory monocyte/macrophage states, whereas the myeloid-sparse Subgroup 2 is polarized towards a scavenger-like STAB1_Mac phenotype.
Coordinated tumor and myeloid cell subsets define an inflammatory tumor-myeloid module in ENKTL
We next examined the malignant compartment in the CosMx dataset to determine how tumor subsets relate to the subgroup-associated myeloid programs.
Malignant cell subclustering resolved four tumor states, including two proliferative populations, G2M_tumor and Proliferating_tumor, and two non-proliferative states, NF-κB_tumor and NEAT1_tumor (Fig. 4A, Supplementary Fig. 13A, B). Among the top marker genes, NF-κB_tumor showed expression of CXCL13, IFNG and NFKB2 (Supplementary Fig. 13A), consistent with the previously reported CXCL13+ tumor subset [10]. In parallel, this tumor state displayed enhanced expression of MHC class II molecules (HLA-DR/DP/DQ/DM/DO genes), NF-κB pathway components (NFKB1/2), immune checkpoint molecules (CD274/ENTPD1/HAVCR2/CTLA4) and co-stimulatory genes (TNFRSF9/TNFSF4), together with increased NFKB2(+) regulon activity (Fig. 4B, C). Collectively, these features aligned not only with the previously reported CXCL13+ tumor subset, but also with our GeoMx protein profiling data, which had similarly indicated a tumor compartment with both immune activation and immune-regulatory properties.
Fig. 4: Coordinated tumor and myeloid cell subsets define an inflammatory tumor-myeloid module in ENKTL.
A UMAP visualization of tumor cells from ENKTL CosMx reference dataset. Four distinct tumor subsets were identified, including NEAT1_tumor, NF-κB_tumor, G2M_tumor and Proliferating_tumor. B Heatmap showing the expression of selected gene modules across tumor cell subsets. Compared with other tumor subsets, NF-κB_tumor exhibited increased expression of APC-related genes, NF-κB signaling components, immune checkpoint markers, and co-stimulatory molecules. C NFKB2(+) regulon activity and imputed LMP1 expression in tumor cells. NF-κB_tumor was associated with elevated imputed LMP1 expression and enhanced NFKB2(+) regulon activity, consistent with a previously described LMP1+ tumor state in ENKTL. D Stacked bar plots showing the composition of tumor cell subsets in the two patient subgroups, with whiskers indicating the standard error of the mean across patient samples. Subgroup 1 showed a higher proportion of NF-κB_tumor cells than Subgroup 2 (two-sided Wilcoxon rank-sum test). E Heatmap showing pairwise Spearman correlations of cell type proportions across samples, with hierarchical clustering identifying putative functionally coordinated cell populations. Color indicates the correlation coefficient and dot size represents the false discovery rate (FDR). NF-κB_tumor cells clustered closely with inflammatory myeloid cell subsets, including monocytes, IL1B_Mac and MT_Mac, suggesting coordinated organization within an immune-active microenvironment. F Correlation analysis in independent bulk RNA-seq cohorts. In both the Xiong and NCCS cohorts, LMP1 expression and IL1B_Mac and monocyte signature scores were positively correlated with the NF-κB_tumor signature score, linking an LMP1-related NF-κB_tumor subset to inflammatory myeloid programs. Arrows indicate increase (▲) or decrease (▼) in Subgroup 1 relative to Subgroup 2. *p < 0.05, **p < 0.01, ***p < 0.001. UMAP uniform manifold approximation and projection, NF-κB nuclear factor kappa B, LMP1 latent membrane protein 1, FDR false discovery rate, Mac macrophage, MT metallothionein, RNA-seq RNA sequencing, NCCS National Cancer Centre Singapore.
To assess EBV-associated viral activity across tumor subsets, we computationally inferred EBV gene expression in our CosMx dataset using an EBV transcript-annotated scRNA-seq dataset [10] (Supplementary Methods). Among the imputed EBV transcripts, LMP1 showed enrichment in NF-κB_tumor cells (Fig. 4C), consistent with the higher KEGG pathway enrichment for EBV infection and viral carcinogenesis (Supplementary Fig. 13D). These results are consistent with LMP1-mediated NF-κB activation and its enrichment in the previously reported CXCL13+ tumor subset [10].
We then compared the tumor subset abundances between GeoMx-defined subgroups and discovered significant enrichment of NF-κB_tumor in Subgroup 1 (p < 0.001, Fig. 4D) with similar patterns observed by nasal versus non-nasal site analysis (Supplementary Fig. 13E). In the context of our earlier finding that Subgroup 1 was also enriched for inflammatory and immune-regulatory myeloid subsets, we next sought to determine whether this co-enrichment reflected a coordinated tumor-myeloid composition pattern. Sample-level correlation analysis of cell subset proportions across samples showed that NF-κB_tumor clustered closely with monocytes, IL1B_Mac and MT_Mac in hierarchical clustering (Fig. 4E, Supplementary Fig. 14A), defining a coordinated inflammatory tumor-myeloid module, in line with recent evidence that LMP1-associated malignant cells can drive myeloid propagation through IFN-γ signaling [29].
To further assess whether this NF-κB_tumor-related program could be reproduced in independent datasets, we projected CosMx-derived subset signatures onto two independent ENKTL cohorts (Xiong et al., n = 127; NCCS cohort (unpublished), n = 36) [30]. In both cohorts, LMP1 expression correlated strongly with the NF-κB_tumor signature (p < 0.001; Fig. 4F), reinforcing the link between this tumor subset and EBV-associated transcriptional activity. In parallel, NF-κB_tumor signatures showed significant positive correlations with IL1B_Mac (p = 0.0022) and monocyte signatures (p < 0.001), recapitulating the tumor-myeloid co-enrichment patterns observed in our discovery cohort (Fig. 4F). Together, these findings support a reproducible coordinated tumor-myeloid module in ENKTL, characterized by coupled immune activation and immune-regulatory transcriptional features.
Spatial architecture mapping resolves the ENKTL tumor-myeloid module into an inflammatory niche
To define the spatial organization of this tumor-myeloid module, we performed neighborhood analysis on the CosMx data using the cellular composition within a 200-pixel radius (~24 µm) around each cell (Supplementary Fig. 15A–C). We identified six cross-patient conserved spatial niches, supported by both cellular composition and GO enrichment of niche-specific genes (Supplementary Fig. 16A and Supplementary Table S7). Among these, the inflammation niche was enriched for NF-κB_tumor cells together with monocytes, IL1B_Mac and MT_Mac, providing direct spatial validation of the coordinated tumor-myeloid module defined above (Fig. 5A).
Fig. 5: Spatial architecture mapping resolves the ENKTL tumor-myeloid module into an inflammatory niche with distinct cell-cell communication patterns.
A Representative spatial maps of niche architecture in a Subgroup 1 case (left) and Subgroup 2 case (right). B Stacked bar plots showing the composition of spatial niches in the two patient subgroups, with whiskers indicating the standard error of the mean across patient samples. Subgroup 1 showed higher proportions of the inflammation_niche and LAM_niche than Subgroup 2 (two-sided Wilcoxon rank-sum test). C Distance-based cell proximity analysis centered on NF-κB_tumor cells. Radial co-occurrence analysis showed short-range enrichment of IL1B_Mac, Monocyte, MT_Mac, and NF-κB_tumor cells around NF-κB_tumor cells. D Differential cell-cell communication between selected myeloid and tumor subsets in Subgroup 1 and Subgroup 2. CCL-, CSF-, and IL1-mediated pathways involved in monocyte/macrophage recruitment and activation are shown. Subgroup 1 exhibited enhanced NF-κB_tumor-to-myeloid and myeloid-to-myeloid communication. E Spatial visualization of niche architecture and selected cytokines involved in monocyte/macrophage recruitment. CCL3 and CCL8 were enriched in the inflammation_niche, whereas CCR1 showed spatial co-localization with these regions. F Differential immune-modulatory cell-cell communication between myeloid/tumor subsets and T cells in Subgroup 1 and Subgroup 2. Subgroup 1 displayed increased checkpoint-related interactions with T cells. Arrows indicate increase (▲) or decrease (▼) in Subgroup 1 relative to Subgroup 2. * p < 0.05, ** p < 0.01, *** p < 0.001. NF-κB nuclear factor kappa B, Mac macrophage, MT metallothionein, CCL C-C motif chemokine ligand, CSF colony-stimulating factor, IL interleukin, CCR C-C motif chemokine receptor.
We next compared niche abundance between the two subgroups. Consistent with the higher overall myeloid infiltration in Subgroup 1, both the inflammation niche (p < 0.001) and the LAM niche (p < 0.01) were more abundant in Subgroup 1 than in Subgroup 2, with similar patterns observed by nasal versus non-nasal site analysis (Fig. 5A, B, Supplementary Fig. 16B). While APOE_C1q_Mac and STAB1_Mac were also more abundant in Subgroup 1, they did not co-localize with the inflammatory niche, but instead formed a separate LAM niche, indicating spatial compartmentalization of the transcriptomically distinct myeloid axes.
To further characterize the short-range spatial relationships associated with the inflammatory niche, we performed distance-based co-occurrence analysis centered on NF-κB_tumor cells and quantified the co-occurrence gradient (Fig. 5C) [12]. APOE_C1q_Mac and STAB1_Mac showed lower co-occurrence with NF-κB_tumor cells across increasing radii. In contrast, the IFN-γ-activated macrophage subsets IL1B_Mac and MT_Mac showed the strongest enrichment in close proximity to NF-κB_tumor cells but not NEAT1_tumor, G2M_tumor and Proliferating_tumor cells (Supplementary Fig. 17A, B), whereas monocytes were also enriched but with a less pronounced gradient, suggesting IFN-γ signaling as a possible key pathway underlying myeloid propagation in ENKTL [29].
Cell-cell communication networks implicate sustained myeloid accumulation and T-cell inhibitory signaling in the ENKTL microenvironment
To further define signaling pathways driving myeloid accumulation in ENKTL, we performed spatially-informed cell-cell communication analysis using CellChat v2 between subgroups (Supplementary Fig. 18A) [13]. Communication strength was increased in Subgroup 1, both between NF-κB-tumor cells and inflammatory myeloid populations and within the inflammatory monocyte/macrophage compartment (Supplementary Fig. 18B). The TME in Subgroup 1 showed enhanced CSF, CCL and IL1 signaling in tumor-myeloid and myeloid-myeloid interactions, particularly within the inflammation niche (Fig. 5D, Supplementary Fig. 18C). In line with these findings, spatial mapping of representative chemokines and receptors, including CCL3, CCL8 and CCR1, showed enrichment within the inflammation_niche (Fig. 5E), supporting the presence of a functionally active and chemokine-enriched local environment. Together, these results suggest that tumor-associated myeloid recruitment may be followed by a phase of myeloid self-reinforcement, in which recruited and polarized inflammatory myeloid cells further amplify myeloid accumulation through CCL and IL1 signaling pathways.
In parallel, our earlier analyses suggested that the inflammation_niche-enriched TME was also associated with immune-regulatory features. Ligand-receptor analysis centering on T cells revealed broader and stronger inhibitory signaling in Subgroup 1 towards CD8 effector T cells and naïve T cells through PD-L1/PD-L2-PD-1, PVR/NECTIN2-TIGIT and LGALS9-HAVCR2 interactions, which mainly derived from the inflammation niche (Fig. 5F, Supplementary Fig. 18D). Together, these findings indicate that checkpoint-associated inhibition in ENKTL is not only restricted to the previously reported CXCL13+ tumor program [10], but also involves checkpoint-expressing inflammatory myeloid cells within the inflammation_niche.
Inflammation niche abundance is associated with favorable clinical outcome in ENKTL
To further characterize the biologic significance of the WTA-derived subgroups, we examined their clinicopathological features and analysed their relation to previously reported molecular subtypes of ENKTL. Subgroup 2 was associated with higher International Prognostic Index (IPI) scores than Subgroup 1 (Supplementary Fig. 19A). Interestingly, when we correlated the transcriptomic signatures of the molecular subtypes described by Xiong et al. [30], we observed a significant enrichment of the TSIM signature in Subgroup 1 (Supplementary Fig. 19B), in line with the association of the TSIM subtype with an inflamed (hot) tumor microenvironment described previously [31]. We further evaluated the prognostic relevance of inflammation_niche abundance in our CosMx cohort but did not observe any difference in survival between high vs. low inflammatory niche abundance in our small cohort using limited amounts of tissue on the TMAs (Supplementary Fig. 19C). Subsequently, we performed deconvolution of the inflammation_niche signature on two larger and independent ENKTL cohorts with bulk RNA-seq data (Xiong [30] and NCCS cohorts [unpublished]). Kaplan-Meier analysis (Supplementary Methods and Supplementary Table S7) showed that higher estimated inflammation_niche abundance was associated with improved overall survival (Fig. 6A) in both the NCCS cohort (p = 0.008) and the Xiong cohort (p = 0.041). This association was similarly observed for progression-free survival in both cohorts (NCCS cohort: p = 0.013; Xiong cohort: p = 0.037). These findings support an association between higher inflammation_niche abundance and favorable clinical outcome in ENKTL, in line with previous reports [10, 31].
Fig. 6: Inflammation niche abundance is associated with favorable clinical outcome in ENKTL.
A Kaplan-Meier analysis of the prognostic relevance of the spatial niches in independent bulk RNA-seq cohorts. Higher inflammation niche scores were associated with better overall survival and progression-free survival in both Xiong et al. and NCCS cohorts (univariable Cox regression and log-rank test). B Schematic diagram of the distinct niche archetypes and myeloid-centered interactions among tumor cells, myeloid cells, and T cells in the two ENKTL subgroups. Subgroup 1 is enriched for an inflammation niche in which myeloid subsets, encompassing immune-activating and immunosuppressive programs, are intermingled with the NF-κB–associated tumor subset. This tumor subset may contribute to myeloid recruitment through IFNG-related signaling and promote monocyte/macrophage activation. Additional myeloid recruitment may be reinforced by monocyte/macrophage-derived cytokines through CCL and IL1 signaling, resulting in a locally inflamed yet immunosuppressive tumor microenvironment. These features suggest that Subgroup 1 may be more amenable to T-cell reactivation by anti-PD-1/PD-L1 therapy. In contrast, Subgroup 2 displays an immune-quiescent tumor microenvironment with limited myeloid infiltration. Myeloid subsets in this subgroup skew towards a scavenging phenotype, characterized by elevated expression of membrane scavenger molecules, including STAB1 and MRC1, together with enhanced iron-related metabolic programs, potentially contributing to suppression of anti-tumor immunity by shaping a metabolically restrictive microenvironment (created with BioRender.com). RNA-seq, RNA sequencing; NCCS, National Cancer Centre Singapore; NF-κB, nuclear factor kappa B; IFNG, interferon gamma; CCL, C-C motif chemokine ligand; IL, interleukin.
