


MALT1 is constitutively active in a subset of EBV-transformed B-cell lines
Constitutive NF-κB activation is a characteristic of lymphoid tumors induced by oncogenic viruses such as EBV or KSHV. We recently showed that the KSHV latent proteins K13 and K15 activate NF-κB through the protease MALT1 [40]. Since K15 is homologous to EBV’s LMP2A, we hypothesized a similar mechanism in EBV-induced B-cell transformation. Therefore, we screened for MALT1 activity in various EBV- and EBV+ B-cell lines (see color code used throughout this study, depicted in Fig. 1A), by assessing the cleavage status of the MALT1 substrate CYLD [44]. As positive controls, we used OCI-Ly3, U2932 or TMD8 cell lines, which are derived from the ABC subtype of DLBCL (ABC DLBCL, labeled in red), characterized by constitutive BCR signaling and MALT1 activity, and as a negative control, we used BJAB, a cell line derived from the germinal center B cell (GCB) subtype of DLBCL (GCB DLBCL, labeled in orange), in which MALT1 is inactive [45, 46]. MALT1 activity was detectable in multiple lymphoblastoid cell lines (LCL) derived from EBV-transduced primary human B cells (labeled in dark blue), but not in the marmoset LCL B95.8 cell line that is used for EBV virus production (Fig. 1B). MALT1 activity was also detectable in one out of two EBV+ DLBCL cell lines (Farage, but not VAL, labelled in turquoise blue), and in the splenic marginal zone lymphoma (SMZL) cell line VL51 (labelled in pale violet) (Fig. 1C), despite consistently observing that higher proportions of CYLD were cleaved in the ABC DLBCL models used as a positive control [45, 46] (Fig. 1B, C). Whilst CYLD cleavage was most easily picked up, cleavage of other MALT1 substrates such as BCL10 and RelB were also detectable in the lymphoblastoid cell line KDW and in VL51 cells (Supplementary Fig. 1A). In contrast, MALT1 activity was absent in EBV+ Burkitt lymphoma models (Raji, Ramos, Jijoye, BL41 and Namalwa, labeled in green), and the GCB DLBCL cell line BJAB, used as negative control [45, 46] (Fig. 1D). Substrate cleavage was MALT1-dependent, as it could be inhibited with the allosteric MALT1 inhibitor MLT-748 (ref. [47]) (Fig. 1E, F, Supplementary Fig. 1A) or the competitive MALT1 inhibitor z-LVSR [48] (Supplementary Fig. 1B and 1C), or by inducible silencing of MALT1 expression (Supplementary Fig. 1D). Thus, MALT1 is constitutively active in a subset of EBV+ B-cell lines.
Fig. 1: MALT1 is constitutively active in a subset of EBV-positive lymphoma cell lines.
A Color code for the different EBV-negative (orange: GCB DLBCL, red: ABC DLBCL) and EBV-positive cell lines (dark blue: LCL, pale violet: SMZL, turquoise blue: EBV+ DLBCL, green: Burkitt lymphoma). B–F Immunoblot for CYLD was used to monitor MALT1 activity in lysates of ABC DLBCL (OCI-Ly3, U2932 and TMD8), GCB DLBCL (BJAB), B98.8 (an EBV-producing marmoset B-lymphoblastoid cell line), EBV-positive LCL (ADZ, ADW, HEL, NDW, POO, KDW, WWT, WWT1-3, CB33), EBV-positive SMZL (VL51) and EBV-positive Burkitt lymphoma (Raji, Ramos, Jijoye and BL41) cell lines. Black and open arrowheads indicate noncleaved and cleaved forms of CYLD, respectively. E, F Indicated cell lines were incubated for 24 h with or without the MALT1 inhibitor MLT-748. B–F Tubulin served as loading control throughout, and an asterisk indicates a non-specific band. Positions of molecular weight markers are indicated in kDa. Data are representative of three independent experiments.
Constitutive MALT1 activation in EBV+ cells is independent of the BCR-proximal signaling pathway
To explore molecular requirements of MALT1 protease activation in specific EBV+ cell lines, we examined whether BCR-proximal signaling components such as BTK, PKCβ and its substrate CARMA1 were involved, in light of their known requirement for BCR-induced MALT1 activation. Using the BTK inhibitor Ibrutinib or Gö6976, an inhibitor of PKCα, PKCβ, and PKCγ, we found little or no effect on MALT1 activity in EBV+ cell lines with constitutive MALT1 activity (Farage and ADW), whilst Ibrutinib and Gö6976 inhibited MALT1 activity in the ABC DLBCL cell line OCI-Ly3, as expected [49] (Fig. 2A, B). All three cell lines responded to the MALT1 inhibitor MLT-748, which efficiently inhibited CYLD cleavage (Fig. 2A, B). Finally, we assessed the effect of inducible CARMA1 silencing, which in contrast to MALT1 silencing had no effect on CYLD cleavage (Supplementary Fig. 1D–E).
Fig. 2: Btk and PKC activities are not required for MALT1 activation in EBV-positive lymphoma cell lines.
A, B Immunoblot analysis of CYLD cleavage as a readout of MALT1 activity in lysates of ABC DLBCL (TMD8, OCI-Ly3), DLBCL (Farage) and LCL (ADW) cells treated with (A) the BTK inhibitor Ibrutinib, (B) the PKC inhibitor Gö6976 or (A-B) the MALT1 inhibitor MLT-748. C Immunoblot analysis of CARMA1, MALT1 and Bcl10 expression in lysates of ABC DLBCL (OCI-Ly3), GCB DLBCL (BJAB), EBV+ DLBCL (VAL, Farage), LCL (ADZ, ADW, HEL, NDW, POO, KDW, WWT1, WWT2), SMZL (VL51) and Burkitt lymphoma (Ramos, BL41, Raji, Jijoye) cell lines. A–D Tubulin served as loading control throughout. Black and open arrowheads indicate noncleaved and cleaved forms of CYLD, respectively. Positions of molecular weight markers are indicated in kDa. Data in all panels are representative of two independent experiments.
Subsequently, we selected a panel of 54 genes that are frequently mutated in B-cell lymphomas and used for diagnostic purposes, to assess potential presence of gain-of-function mutations in the EBV+ cell lines with constitutive MALT1 activity (Supplementary Table 1) [50]. These include genes with roles in BCR-proximal signaling and formation of the CBM complex, such as CD79A/B and CARMA1, which are recurrently mutated in lymphomas [51, 52]. Genomic DNA from Farage, VL51, and CB33 cells was sequenced using Hybrid Capture-Based Next Generation Sequencing. No gain-of-function mutations in CD79, CARMA1, or other CBM complex regulators were found in these cells (Supplementary Table 1).
Finally, we assessed for potential alterations in the expression and/or modification (e.g., altered migration pattern) of CBM components by Western blot. No consistent differences in expression or modification of MALT1, CARMA1, or BCL10 were observed between cell lines with MALT1 activity, including OCI-Ly3, LCL lines, Farage, VL51, and EBV+ cell lines that lack MALT1 activity (VAL, Raji and Jijoye) (Fig. 2C, D).
Thus, a subset of EBV+ B-cell lymphoma lines show constitutive MALT1 activity without evidence for chronic BCR-induced signaling.
MALT1 activity is driven by EBV latent membrane proteins
Having excluded a role for altered BCR signaling, we examined the possibility that latent proteins associated with EBV malignancies could drive MALT1 activation. EBV-infected cells express four latency programs linked to different forms of EBV-driven malignancies [1]. The MALT1-active cell lines identified here should express latency programs II or III, while inactive cell lines (mainly Burkitt lymphomas) are known to express latency program I. We monitored viral latent gene expression and proteins in cell lines that are EBV- (BJAB) or EBV+ (all others) by RT-PCR and western blot. Within the group of EBV+ cell lines, higher mRNA expression of LMP2A and LMP2B was found in MALT1-active cell lines (Farage, VL51 and LCLs) compared to MALT1-inactive cell lines (VAL and Burkitt’s lymphoma), while no such correlation was observed for other latent genes such as EBNA2 or EBNA LP (Fig. 3A). Analysis of protein levels showed that co-expression of LMP1 with LMP2A/B correlated with MALT1 activity in VL51, Farage, and LCL lines (Fig. 3B, compare with Fig. 1B, C and F). Comparison of the two EBV-positive DLBCL cell lines Farage and VAL revealed that Farage, but not VAL cells expressed LMP2, which correlates with MALT1 activity detectable in Farage but not VAL cells (Fig. 1C). Consistent with an important role for LMP2 expression in MALT1 activation, inducible silencing of LMP2A/B reduced MALT1 activity, monitored by assessing CYLD cleavage, in the EBV+ DLBCL cell line Farage and the SMZL cell line VL51 (Fig. 3C).
Fig. 3: LMP proteins promote MALT1 activation.
A RT-PCR analysis of the expression of indicated viral latent genes in GCB DLBCL (BJAB), EBV+ DLBCL (VAL, Farage), LCL (HEL, NDW, KDW, WWT2), SMZL (VL51) and Burkitt lymphoma (Raji, Jijoye) cell lines. Relative mRNA levels (normalized to GAPDH) are shown. B Immunoblot analysis of LMP2A/B and LMP1 expression in lysates of EBV+ DLBCL (VAL, Farage), LCL (HEL, NDW, KDW, WWT2), SMZL (VL51) and Burkitt lymphoma (Raji, Jijoye) cell lines. C EBV+ GCB DLBCL cell line (Farage) and SMZL VL51 were transduced with two different Dox-inducible shRNAs for LMP2 or a scrambled control shRNA and analyzed 3 days after induction by immunoblot, as indicated. CYLD was used to monitor MALT1 activity. D LCL (ADZ, KDW) or an EBV+ DLBCL cell line (Farage) were transduced with indicated, Dox-inducible shRNAs and analyzed 3 days after induction by immunoblot, as indicated. CYLD was used to monitor MALT1 activity. B–D Tubulin served as loading control throughout. Black and open arrowheads indicate noncleaved and cleaved forms of CYLD, respectively. Positions of molecular weight markers are indicated in kDa. Data in all panels are representative of two independent experiments.
Finally, we assessed whether the major EBV latent protein, LMP1, is required for MALT1 activity. No significant differences in LMP1 expression were found between MALT1-active and inactive cell lines, all of which expressed LMP1 (Fig. 3D). However, inducible silencing of LMP1 in the EBV+ DLBCL cell line Farage and in the LCL lines ADZ and KDW led to a clear decrease in MALT1 activity, as evidenced from reduced CYLD cleavage in LMP1-silenced cells (Fig. 3D). Thus, co-expression of LMP1 and LMP2A/B is likely necessary for MALT1 activation and could explain why MALT1 is active only in a subset of EBV+ B-cell lines corresponding to latency stages II and III.
LMP1 and LMP2A/B synergistically activate MALT1 and NF-κB
To test whether individual LMP proteins alone can activate MALT1, we assessed their effects using a FRET-based MALT1 protease activity reporter in 293T cells [43]. Co-expression of low levels of MALT1 and BCL10 with increasing doses of LMPs revealed that LMP1 strongly activated MALT1, while LMP2A and LMP2B had weak effects (Fig. 4A). LMP1-induced MALT1 activation was significantly reduced by mutation of the CTAR1 or CTAR2 motifs of LMP1 (Fig. 4B), which are important for NF-κB2 and NF-κB1 activation, respectively [8,9,10]. Mutation of both, CTAR1 and CTAR2 motifs further reduced MALT1 activation (Fig. 4C). To determine if LMP1 could synergize with LMP2A or LMP2B, we then investigated the effect of their co-expression on the activation of endogenous MALT1, by titrating down LMP protein levels to have minimal MALT1 activation when expressed alone. Under these conditions, we observed a clear synergy between LMP1 and LMP2A or LMP2B (Fig. 4D). Unexpectedly, the synergy was even stronger with LMP2B, which lacks the N-terminal cytoplasmic tail present in LMP2A.
Fig. 4: MALT1 and NF-κB activation are driven by EBV latent membrane proteins in a synergistic manner.
A–D 293T cells were transfected with an eYFP-LVSR-eCFP MALT1 activity reporter plasmid and the indicated combinations of expression constructs for MALT1, BCL10, LMP1, LMP2A and LMP2B. LMP1 mutations of CTAR1, CTAR2 or both were additionally used in panels B and C. The proportion of cells with MALT1-dependent reporter cleavage was assessed by flow cytometry, and protein expression was assessed by western blot. E 293T cells stably transduced with silencing constructs for MALT1 (MALT1 KO) or a control vector were transfected with an NF-κB reporter construct, together with the indicated combinations of LMP1, LMP2A and LMP2B constructs. NF-κB activation was monitored by luciferase assay. Expression of transfected constructs and silencing efficiency was monitored by western blot. F LCL (ADZ, NDW), DLBCL (Farage) and SMZL (VL51) cell lines were stained for LMP1 (in green) and LMP2 (in red) and their endogenous colocalization (in yellow) was analyzed by fluorescence microscopy. Colocalization was quantified using Pearson’s coefficient. Bars indicate 5 μm. A–E Tubulin blot served as a loading control. Data in all panels are representative of two independent experiments.
We subsequently tested whether LMP-mediated NF-κB transcription depended on MALT1, using an NF-κB luciferase reporter assay. Silencing of MALT1 strongly reduced NF-κB activation by all three LMP proteins in 293T cells (Fig. 4E), suggesting that LMP-dependent NF-κB activation requires MALT1. Furthermore, a MALT1-dependent synergy between LMP1 and LMP2B, but not between LMP1 and LMP2A, was observed in activating NF-κB (Fig. 4E). To explore the mechanism behind this synergy, we examined the subcellular localization of LMP1 and LMP2 proteins in LCL (ADZ, NDW), EBV+ DLBCL (Farage), and SMZL (VL51) cell lines using confocal microscopy. This revealed partial colocalization of LMP1 and LMP2 proteins in a perinuclear region (Fig. 4F). Thus, LMP1 and LMP2 proteins co-localize and activate MALT1, and consequently NF-κB, in a synergistic manner.
LMP1 recruits BCL10, via its CTAR1 domain, and LMP2A recruits MALT1
Based on our microscopy findings, we hypothesized that LMPs promote NF-κB and MALT1 activation by physically recruiting components of the CBM complex to a common location. We, therefore, tested whether LMP1 interacts with CARMA1, MALT1, or BCL10 in 293T cells, using the known LMP1 binding partner TRAF3 as a positive control [53]. We observed a strong association between LMP1 and BCL10, and weaker interactions with CARMA1 and MALT1, possibly mediated by endogenous BCL10 (Fig. 5A). Mutation of the CTAR1 motif reduced BCL10 binding to background levels, while CTAR2 mutation had no effect (Fig. 5B). Since both CTAR mutations affect MALT1 activation (Fig. 4B), factors other than BCL10 binding must contribute to LMP2-driven MALT1 activation. Physical interaction of LMP1 with BCL10 was confirmed at the endogenous level, by co-immunoprecipitation of the two proteins in VAL and VL51 cell lines (Fig. 5C). BCL10 binding to LMP1 was detectable in both MALT1-active and -inactive cell lines (Fig. 5C), suggesting that LMP1-mediated recruitment of BCL10 was not sufficient for MALT1 activation. Endogenous BCL10 could not be reliably detected by microscopy, but endogenous MALT1 and LMP1 showed partial co-localization by microscopy (Fig. 5D).
Fig. 5: LMP1, LMP2A and LMP2B physically interact with CBM components.
293T cells were co-transfected with the indicated combinations of FLAG-tagged expression constructs for MALT1, BCL10 and CARMA1 together with (A) LMP1, or (B) LMP1 CTAR1 or CTAR2 mutants. Protein expression and binding of LMP1 constructs to precipitated CARMA1, MALT1 or BCL10 was monitored by western blot. C EBV+ cell lines without (VAL) or with constitutive MALT1 activity (VL51) were lysed, and proteins were precipitated using anti-BCL10 or a mouse control antibody (Ctrl). Proteins in lysates and co-immunoprecipitating proteins were analyzed by western blot using anti-LMP1 or anti-BCL10. Black arrowhead indicates the differently migrating LMP1 species present in the two cell lines. D VAL and VL51 cells were stained for endogenous LMP1 (green) and MALT1 (red) and their colocalization (yellow) was analyzed by fluorescence microscopy. Colocalization was quantified using the Pearson’s coefficient. BJAB cells were used as a negative control for LMP1 staining. Bars indicate 5 μm. E 293T cells were co-transfected with the indicated combinations of STREP-tagged expression constructs. Protein expression and binding of LMP2A and LMP2B to precipitated CARMA1, MALT1 or BCL10 was monitored by western blot. Data in all panels are representative of two independent experiments.
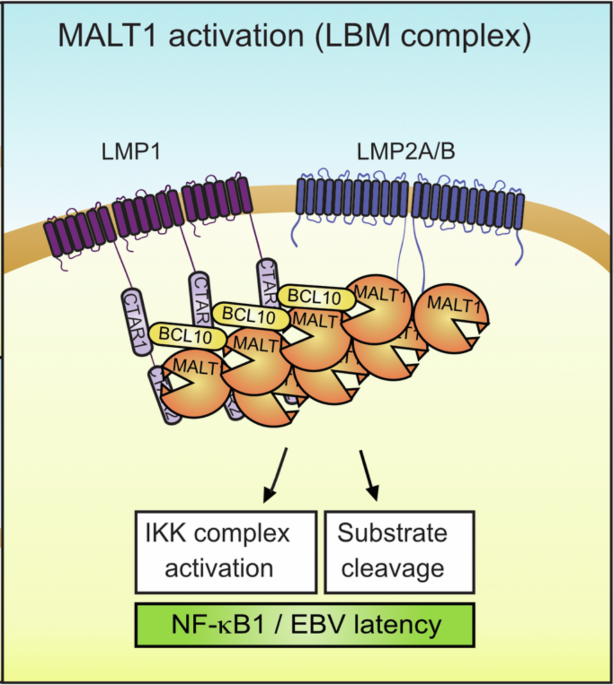
Finally, we tested whether LMP2 proteins can interact with CBM components upon co-expression in 293T cells. In lysates of transfected cells, LMP2A and LMP2B proteins were detectable as monomers and SDS-resistant oligomers by SDS-PAGE and western blot. Despite weaker expression of LMP2B compared to LMP2A, co-immunoprecipitation experiments revealed a strong interaction of both LMP2 isoforms with MALT1, including both monomeric and higher molecular weight forms of LMP2A/B (Fig. 5E). These findings suggest that LMP1 and LMP2 recruit BCL10 and MALT1, respectively, and most likely activate MALT1 through formation of oligomeric LMP1-BCL10-MALT1 (LBM) complexes.
MALT1 inhibition impairs NF-κB-driven gene expression in EBV-transformed cells lines
Having established a role for MALT1 in LMP1- and LMP2-driven NF-κB activation, we proceeded to assess the effect of MALT1 inhibition on expression of known NF-κB target genes and, more generally, on the gene expression pattern of EBV-transformed cell lines. As cytokines are crucial for B-cell growth and survival, we first monitored their secretion in EBV-transformed cell lines (Supplementary Fig. 2A–D). IL-12, a known NF-κB target, was secreted in most EBV+ cell lines (ADW, ADZ, HEL, KDW, WWT2, VL51) (Supplementary Fig. 2A), and we therefore assessed the effect of MALT1 inhibition on IL-12 secretion in these lines. The MALT1 inhibitor MLT-748 showed a strong reduction in the production of IL-12 (Fig. 6A). To obtain a broader picture of MALT1-driven gene expression in EBV-transformed cell lines, we then treated the splenic marginal zone B-cell lymphoma cell line VL51 with the MALT1 inhibitor MLT-748 for 24 h and analyzed the resulting effects on gene expression by an RNA-Seq approach. This analysis revealed changes in gene expression in a total of 5’204 genes (Supplementary Fig. 3A). GSEA Hallmark analysis performed on the full list of differentially expressed genes identified ‘TNF signaling via NF-κB’ and ‘inflammatory response’ as negatively enriched pathways (Supplementary Fig. 3B). Amongst the most significantly downregulated genes were several previously identified NF-κB target genes (Fig. 6B), including ICAM1, BCL2L1 and c-Jun, which we validated by RT-PCR (data not depicted). Further GSEA analysis and gene expression profiling using previously described NF-κB gene expression signatures [54] revealed a clear negative enrichment score for these signatures, as well as for signatures describing EBV LMP1 signaling (MSigDB accession M39410; systematic name WP262) and LMP1 early responses (MSigDB accession M13941) [55] (Fig. 6C–F, Supplementary Fig. 3C–F). Collectively, these findings suggest that MALT1 protease activity controls expression of LMP1- and NF-κB-driven genes in EBV-transformed cells lines.
Fig. 6: Effect of MALT1 inhibition on gene expression in EBV+ lymphoma models.
A The indicated lymphoma cell lines were treated for 48 h with the MALT1 inhibitor MLT-748 or solvent (DMSO), and levels of IL-12 in the culture supernatant were assessed by ELISA. B Volcano plot showing differentially expressed genes that are significantly upregulated (red) or downregulated (blue) upon treatment of VL51 cells for 24 h with the MALT1 inhibitor MLT-748. C, D Gene set enrichment analysis (GSEA) using previously curated gene lists related to NF-κB signaling (“NFkB_Up_all_OCILy3_Ly10”) [54] and EBV LMP1 signaling (MSigDB accession M39410; WP262). E, F Heatmaps for individual genes of the gene signatures in (C), for 55/65 genes, and (D), for 19/23 genes. A right-hand annotation bar indicates the direction of differential expression for the MLT-748-treated versus control contrast (red, up-regulated; blue, down-regulated; white, not significant at FDR < 0.05).
MALT1 inhibition impairs growth of EBV-transformed, LMP1+LMP2+ B cell lines in vitro and in vivo
To determine if MALT1 activity is essential for the survival of EBV-infected lymphoma cell lines with LMP1 and LMP2 expression, we treated various EBV-transformed cell lines with the allosteric MALT1 inhibitor, MLT-748. MALT1 inhibitor treatment led to a clear decrease of cell viability in EBV-transformed LCLs, such as ADZ, ADW, HEL, KDW, POO and WWT2 (Fig. 7A) and in the EBV+ lymphoma cell lines Farage and VL51 (Fig. 7B), which are characterized by concomitant LMP1 and LMP2 expression (Fig. 3A, B). Similar effects were observed when cells were treated with the irreversible MALT1 inhibitor z-LVSR-fmk [48] or the clinically advanced MALT1 inhibitor compound Safimaltib [56] (Supplementary Fig. 4A–B). The ABC DLBCL cell lines OCI-Ly3, TMD8 or HBL1, used as a positive control, also showed impaired growth with MALT1 inhibition (Fig. 7B, Supplementary Fig. 4). In contrast, MALT1 inhibition did not affect the viability of EBV+ lymphoma cell lines that were LMP2-negative and lacked constitutive MALT1 activity (Fig. 7B, Supplementary Fig. 4A–B), such as the DLBCL cell line VAL and the Burkitt’s lymphoma cell line Jijoye, or the EBV-negative DLBCL line BJAB (see Fig. 3A, B). Thus, MALT1 protease activity is crucial for the growth of LMP1+LMP2+ lymphoma cell lines, but not for LMP1+LMP2- cell lines including Burkitt lymphoma cell lines and the DLBCL cell line VAL.
Fig. 7: MALT1 inhibition impairs growth of EBV+ lymphoma models in vitro and in vivo.
A, B The indicated B-cell lymphoma cell lines were treated with the allosteric MALT1 inhibitor MLT-748 or solvent alone (DMSO). Cell viability was assessed using MTS/PMS assay 7 days after treatment. Data in (A, B) are representative of two independent experiments. C Overview of the time course of the Farage xenograft model. Farage cells were injected into the flanks of mice on day 0. Arrowheads indicate time points at which mice were treated with the MALT1 inhibitor Thioridazine or solvent alone, and when tumor size was monitored using a caliper. D Analysis of the overall tumor size of Farage-injected animals under conditions of treatment with vehicle (PBS) or the MALT1 inhibitor Thioridazine. Data pooled results from two independent experiments using 10 mice per condition. E Hypothetical model for LMP1- and LMP2-mediated MALT1 activation by LMP1-mediated BCL10 oligomerization, LMP2A/B-mediated MALT1 dimerization and formation of an LMP-BCL10-MALT1 (LBM) complex.
Finally, to evaluate MALT1 inhibition as a treatment option for EBV+ B cell lymphomas with LMP1 and LMP2 co-expression, we tested the effect of the MALT1 inhibitor Thioridazine on the growth of the EBV+ DLBCL cell line Farage in a xenograft model. Farage cells were injected into the flanks of NOD/SCID mice, and after 24 h, mice were treated with Thioridazine (10 mg/kg) or vehicle every 48 h for 23 days (Fig. 7C). Tumor outgrowth was significantly delayed in Thioridazine-treated mice compared to controls (Fig. 7D). This suggests that MALT1 inhibition by Thioridazine effectively delays the growth of EBV+ lymphoma cells in vivo.
