


EGFR (epidermal growth factor receptor)-targeted therapies, which utilize small molecule inhibitors such as erlotinib and osimertinib to inhibit aberrantly activated EGF receptors caused by oncogenic mutations such as L858R and exon 19 deletion occurring primarily in the region coding its kinase domain, have demonstrated significant clinical efficacy in various cancers, particularly non-small cell lung cancer (NSCLC).1 Nevertheless, a substantial challenge to the long-term effectiveness of these therapies is the inevitable development of drug resistance. Resistance typically arises through secondary EGFR mutations (e.g., T790M, C797S), activation of bypass pathways such as MET or ERBB2 amplification, or phenotypic transformations including small-cell conversion or EMT.1
Extrachromosomal DNA (ecDNA), a circular acentric DNA driving oncogene amplification, promotes heterogeneity and resistance.2 Due to its uneven segregation during mitosis, ecDNA contributes to intratumoral heterogeneity and therapy resistance.2 Furthermore, a recent study showed that ecDNA has been linked to entrectinib therapeutic failure by driving MET amplification in ROS1-rearranged NSCLC.3 Building on this observation, we hypothesize that ecDNA-mediated oncogenic activation and consequent induction of bypass signaling pathways represent a potential key novel mechanism of targeted drug resistance in various cancers, including EGFR-mutated NSCLC.
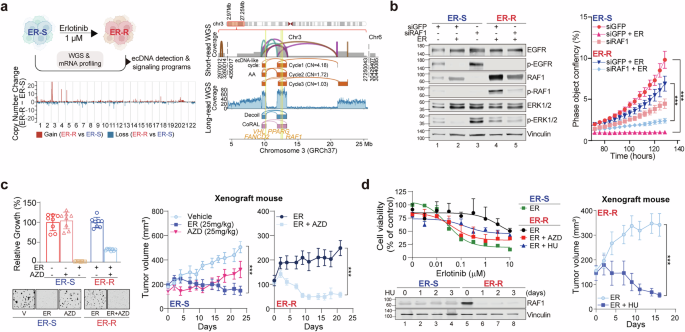
To explore the potential involvement of ecDNA in acquired resistance in EGFR-mutated NSCLC, we generated erlotinib-resistant cells (ER-R) by treating PC9 cells (ER-S), which are highly sensitive to erlotinib due to an EGFR exon 19 deletion, with the drug for approximately 200 days. We then performed whole-genome sequencing (WGS) and mRNA sequencing (RNA-seq) on both cell lines to elucidate the molecular basis of resistance (Fig. 1a). The EGFR exon 19 deletion persisted (VAF > 0.9) without new functional EGFR mutations or EGFR amplification, indicating an EGFR-independent resistance mechanism (Fig. S1). Notably, a prominent focal amplification was identified on chromosome 3 in ER-R, representing a copy number gain of over 24 copies relative to the ER-S baseline and the rest of the genome (Fig. 1a). This region exhibited high-density structural variant clustering and preferential allelic amplification—genomic hallmarks strongly suggestive of ecDNA formation (Fig. S1).
Fig. 1
Characterization of ecDNA-associated RAF1 amplification and its role in erlotinib resistance. a Schematic overview of the experimental workflow used to detect ecDNA in erlotinib-resistant cell models. ER-S represents parental PC9 cells, and ER-R denotes erlotinib-resistant derivatives established from PC9 cells. Created in BioRender. (Kim, S. (2026) https://BioRender.com/x35roge). Integrated short-read WGS and nanopore long-read reconstruction of ecDNA in ER-R. Concordant circular amplicons on chromosome 3 harbor VHL, FANCD2, PPARG, and RAF1. b ER-S and ER-R cells transfected with RAF1-targeting siRNA or control siRNA (siGFP) for 72 hours were subjected to immunoblotting analysis with antibodies against total EGFR, p-EGFR (Y1068), total ERK, p-ERK (T202/Y204), RAF1, and p-RAF1 (S289/296/301), with vinculin as a loading control. Cells transfected with siRNA targeting RAF1 or a nontargeting control siRNA (siGFP) were imaged every 4 hours for a total of 148 hours using the IncuCyte live-cell imaging system. Image series were analyzed with IncuCyte integrated software to calculate cell confluence over time. Growth curves were generated to depict proliferation dynamics, and data are presented as the mean ± SEM from eight independent replicates. c Cells were treated with drugs for 6 days and then stained with Hoechst 33342. Nuclei were imaged using the Cytation 5 system, and viable cell numbers were quantified. Values were normalized to untreated controls, plotted as bar graphs, and are shown as the mean ± SD. Cells were subjected to soft agar colony formation assays in the presence of erlotinib (1 µM), AZD6244 (1 µM), or their combination during incubation for 2-3 weeks. Representative images of colonies formed in soft agar are shown. A total of 5 × 10⁶ cells per mouse were mixed 1:1 with Matrigel and subcutaneously injected. For ER-S xenografted mouse models, treatment was initiated when tumors reached an average volume of ~150 mm³. Mice were treated with vehicle, erlotinib (ER, 25 mg/kg) or AZD6244 (AZD, 25 mg/kg). For ER-R xenograft mouse models, erlotinib treatment was initiated immediately after injection. Combination treatments (ER + AZD) were initiated when tumors reached ~100–150 mm³, at which point tumor measurements were also initiated. All treatments were administered daily by oral gavage. Tumor volume was measured three times per week using calipers and calculated as (length × width²)/2. (n = 6–7 mice per group). Statistical significance was determined using an unpaired two-tailed Welch’s t test (***P < 0.001). d Cell viability assays in ER-S and ER-R cells. ER-S cells were treated with erlotinib across a full dose range. ER-R cells were treated with erlotinib alone or in combination with AZD6244 (AZD, 1 μM) or hydroxyurea (HU, 250 μM). RAF1 expression following HU treatment (250 μM) with erlotinib added for 1, 2, or 3 days, assessed by Western blot. For ER-R xenografted mouse models, mice received daily oral gavage of erlotinib (ER, 25 mg/kg) or combination treatment (hydroxyurea (HU, 25 mg/kg) with ER). Tumor size was measured three times per week using calipers, and tumor volume was calculated with the formula: (length × width²)/2 (n = 6–7 for each group). Statistical significance was determined using an unpaired, two-tailed Welch’s t test (***P < 0.001)
To resolve the structure of this amplification, we applied AmpliconArchitect (AA) to the short-read WGS data, which reconstructed an oncogene-carrying ecDNA localized on chromosome 3 (Fig. 1a). Nanopore long-read sequencing, analyzed through Decoil and CoRAL, yielded a highly concordant circular topology that precisely aligned with the AA-reconstructed ecDNA harboring VHL, FANCD2, PPARG, and RAF1 (Fig. 1a). This consistency validates the circular architecture of the amplicon and confirms the extrachromosomal coamplification of those oncogenes. These oncogenes carried on ecDNA exhibited marked copy number gains (~24–25 copies) with corresponding transcriptional upregulation, underscoring their functional relevance (Figs. S1, S2). Furthermore, gene set enrichment analysis (GSEA) further revealed activation of MAPK signaling in ER-R (Fig. S2). This transcriptional program, driven by RAF1 overexpression, suggests that ecDNA-mediated RAF1 amplification may promote EGFR-independent MAPK pathway activation.
Immunoblotting analysis confirmed elevated RAF1 and ERK phosphorylation in ER-R, indicating EGFR-independent MAPK activation, as supported by GSEA (Fig. S3). To further examine whether erlotinib resistance in ER-R is induced by aberrant RAF1 activity, we assessed the functional impact of ablating RAF1-mediated downstream signaling by either directly reducing RAF1 expression via RNAi or pharmacologically inhibiting sustained MAPK pathway activation. In both ER-S and ER-R, siRNA-mediated RAF1 knockdown led to a significant decrease in both phosphorylated and total RAF1 (Fig. 1b). Consistent with this result, si-RAF1-treated ER-R cells exhibited a dramatic reduction in both cell proliferation and foci formation compared to si-GFP cells when treated with erlotinib (Fig. 1b, Fig.e S3). Treatment with AZD6244 (selumetinib), a selective MEK1/2 inhibitor, in combination with erlotinib in ER-R cells also resulted in an increase in cleaved PARP and decreased ERK1/2 phosphorylation in ER-R cells (Fig. S4). The impaired MAPK signaling caused by AZD6244 aligns with its ability to resensitize ER-R to erlotinib, as evidenced by the results from cell proliferation and colony formation assays (Fig. 1c). These in vitro findings were further corroborated in vivo, as xenograft mouse models demonstrated that the combination of AZD6244 with erlotinib significantly decreased tumor growth in ER-R-driven models but not with erlotinib alone (Fig. 1c). Notably, the biological effect of AZD6244 alone was not pronounced in ER-S, highlighting the specific role of MAPK signaling activation in ER-R (Fig. 1c). Collectively, these biochemical and functional results demonstrate that enhanced RAF1 activity, likely driven by RAF1 amplification within ecDNA and subsequent MAPK pathway activation, plays a pivotal role in mediating erlotinib resistance in ER-R.
To further confirm that RAF1 acts as a driver of erlotinib resistance, we ectopically overexpressed RAF1 in the ER-S via retroviral infection. RAF1-overexpressing ER-S (RAF1-OE) cells acquired complete erlotinib resistance within ~30 days, as evidenced by significantly enhanced proliferation compared to vector control cells (Fig. S4). This resistance was RAF1 dependent, as cotreatment with AZD6244 and erlotinib dose-dependently reduced cell viability in RAF1-OE cells (Fig. S4). These results independently establish that RAF1 overexpression — phenocopying the consequence of ecDNA-derived RAF1 amplification — is sufficient to confer erlotinib resistance.
To determine whether elevated RAF1 expression in ER-R cells is ecDNA-derived, both ER-S and ER-R cells were treated with hydroxyurea (HU), an agent known to deplete ecDNA.4 Combined erlotinib and HU treatment selectively suppressed proliferation in ER-R but not ER-S cells (Fig. S5) and partially restored drug sensitivity — an effect comparable to that of AZD6244 — consistent with reduced RAF1 protein levels confirmed by immunoblotting analysis (Fig. 1d). In line with these findings, HU combination treatment similarly attenuated tumor progression in ER-R xenograft mouse models compared to erlotinib monotherapy (Fig. 1d), collectively supporting that increased RAF1 expression, which underlies EGFR-TKI resistance in ER-R, indeed originates from ecDNA.
In summary, our findings demonstrate that RAF1 overexpression, driven by ecDNA containing RAF1 amplification, reactivates MAPK signaling independently of EGFR. This represents a novel evolutionary pathway contributing to erlotinib resistance, consistent with observations in a recent report.5 Furthermore, our pancancer analysis indicates a potential structural vulnerability at the RAF1 locus for ecDNA formation across diverse tumors, which could be exploited by cancer cells under therapeutic stress (Fig. S6). Future research should prioritize a detailed investigation into the molecular mechanisms underlying ecDNA formation to develop novel strategies against acquired resistance.
