


Patient sample processing and patient-derived cell model development
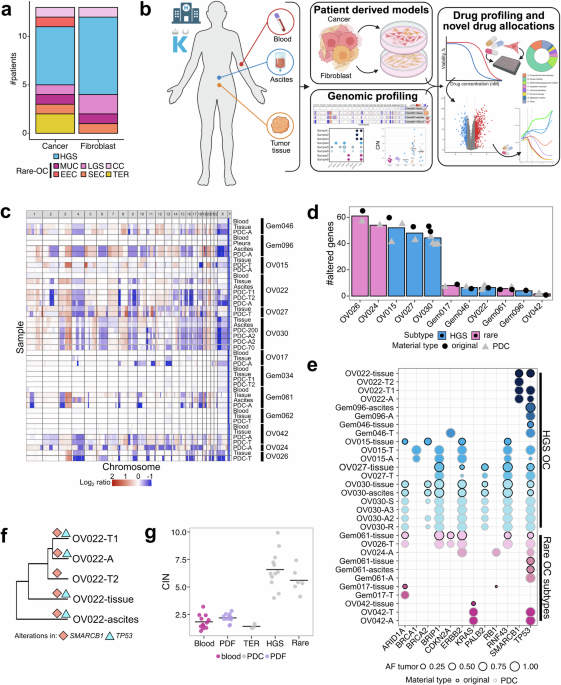
Patient-derived models representing cancer and fibroblast cell populations were derived from OC patient tumor tissue or ascites. Patient samples were obtained from Karolinska University Hospital (KUH) in Stockholm. The study has been performed in accordance with the Declaration of Helsinki (ethical approvals from Etikprövningsmyndigheten (Swedish Ethical Review Authority): 2016/1197–31/1, nr.2018/2642-32, nr.2018/118-32, 2020-05830). All patients have signed informed consent prior to the inclusion and material collection. Samples were processed as described by Åkerlund et al.30 using gentleMACS tissue dissociation kit for tumor tissue (Miltenyi) and centrifugation for ascites. After sample dissociation, cells were plated into cell culture flasks. Once the flask reached 70-80% confluency, differential trypsinization was performed. Specifically, after 3 min incubation with TrypLE (Gibco), the dissociated cell fraction was collected, resuspended in Fibroblast culture media, and spun down. The remaining cells were washed with PBS and additionally incubated with TrypLE until detached. When cancer and/or fibroblast models were proliferating consistently, cells were biobanked, collected as a 1 × 10⁶ cell pellets for further characterization and plated for DST. Overall PDC generation success rate from tissue and ascites was ~30%, while for PDFs it was ~57% with most of the PDF models derived from tissue samples rather than ascites. Clinical information describing the characteristics of the patient material is provided in Supplementary Table 2.
Cell culture
PDCs were maintained in Rockit media as previously described by Åkerlund et al.30, while PDFs were cultured in Fibroblast media as stated by Gudoityte et al.26. A panel of CCLs representing OC was designed including the following cells and media conditions—A2780, EFO21 (DSMZ), KURAMOCHI, MH, OVCAR3, OVCAR4, OVCAR8, ONCODG1, OVSAHO, OVTOKO—were maintained in RPMI (BioWest) medium. CAOV3 (ATCC), COV362 (Sigma-Aldrich), NCI-ADR-RES, OAW28 (Merck), TYKNU were cultured in DMEM (Sigma-Aldrich). CCLs media were supplemented with 10% fetal bovine serum (FBS) (Gibco), 1X antibiotics (streptomycin/penicillin) (Gibco) and 1X L-glutamine (Gibco), unless otherwise specified. OAW28 cell media was additionally supplemented with 5 µg/mL insulin (Merck). FUOV1 cells (DSMZ) were cultured in DMEM-F12 culture media supplemented with 20% FBS and 1X antibiotics. T-lymphoblast cell line MOLT-4 was maintained in RPMI supplemented with 10% FBS and 1X antibiotics. All cells were maintained at 37 °C in a humidified incubator with 5% CO2 and passaged at ~70% confluency. All CCLs were obtained from the Institute Molecular Medicine Finland (FIMM) and kindly provided by Dr. Astrid Muramägi, unless stated otherwise. CCL identity was confirmed by short-tandem repeat (STR) profiling and routinely screened for mycoplasma contamination using MycoAlert (Lonza).
Drug sensitivity testing
PDCs, PDFs, CCLs, and healthy bone marrow aspirates (n = 2, VWR) were profiled for DST using a drug library containing up to 528 approved and investigational compounds, as previously described92, custom drug plates used for follow-up validation. Black, clear bottom 384-well plates (Corning) were pre-spotted with drugs using an Echo 550 acoustic dispenser (Beckman/Labcyte). Cells from unprocessed healthy bone marrow were isolated as described by Struyf et al.28 and used directly in the DST assay with Rockit media. On the day of the assay, pre-spotted drugs were dissolved in respective culture media, and cell suspension was subsequently added using a Multidrop Combi Dispenser (Thermo Fisher Scientific). Plates were incubated for 72 h in a humidified chamber at 37 °C. Cell viability was assessed using the CellTiter-Glo 2.0 Cell Viability Assay (Promega), luminescence was measured using the EnSight multimode plate reader (Revvity). Models were drug tested and molecularly characterized at the same passage, when sufficient cell number was achieved to perform these assays. This information is provided in Supplementary Table 8.
Model validation and mutation characterization
Snap-frozen tumor tissues, isolated cells from ascites, and cell pellets from PDMs were used for targeted sequencing to compare mutational profiles. Sample preparation and sequencing were performed as previously described by Gudoityte et al.26.
MS-based proteomics and sample preparation
OV030 patient models: OV030-R and OV030-S, were plated into 6-well plate at a density of 0.5 × 10⁶ cells per well, two wells per condition, with three technical replicates for each. A-1331852 (1000 nM in DMSO, MedChemExpress) or DMSO (0.01%, Sigma-Aldrich) were added at the time of plating. Cells were incubated for 12 and 24 h before protein extraction. Further cells were harvested and prepared for proteomic analysis as reported earlier93. Specifically, 30 μg of peptides from each digested sample were labeled with TMT 18plex reagent according to the manufacturer’s protocol. After a label check, the samples were pooled and pre-fractionated on pH 3–10 strips using the HiRIEF protocol as previously described40. The extracted peptide fractions were separated using an Ultimate 3000 RSLCnano system coupled to a Q Exactive HF (Thermo Fisher Scientific) as previously described93. Peptide and protein identification was performed as published previously93,94. The following pipeline and software versions were used: MSGF+ v2020.03.14, Percolator v3.04.0, Nextflow v2.16, lehtiolab/ddamsproteomics v2.16. All searches were done against the human protein database Ensembl 110. Fixed modifications were TMT-18plex on lysines and peptide N-termini, and carbamidomethylation on cysteine residues. A variable modification was used for oxidation on methionine residues. Peptide spectrum matches (PSM) found at 1% false discovery rate (FDR) were used to infer gene identities. The raw files and the final output represented as log2 expression normalized to sample median are provided in ProteomeXchange Consortium via the PRIDE partner repository with the dataset identifier PXD065781.
General chemistry methods used for synthesis of Bcl-xL targeted-protein degrader and inactive control compound
1H NMR were recorded on a Bruker DRX-400 NMR spectrometer. Analytical HPLC-MS was performed on an Agilent MSD mass spectrometer connected to an Agilent 1100 system using two different methods. The first method (acidic pH) used column ACE 3 C8 (50 × 3.0 mm), and H2O ( + 0.1% trifluoroacetic acid) and acetonitrile as mobile phases. The second method (basic pH) used column X-Terra MSC18 (50 × 3.0 mm), with H2O (containing 10 mM NH4HCO3; pH = 10) and acetonitrile as mobile phases. Both methods were performed at a flow rate of 1 mL/min, with a gradient time of 3.0 min. HPLC-MS detection was performed in the UV in the 305 + /-90 nm wavelength range and by MS (ESI + ). All final compounds were assessed to be >95% pure by HPLC-MS UV analysis and provided in Supplementary Fig. 1a.
Navitoclax-piperazine synthesis
Navitoclax-piperazine (1) was made as described95 except for one reaction described below.
2,2,2-trichloroethyl (R)-4-(3-((tert-butoxycarbonyl)amino)-4-(phenylthio)butyl)-piperazine-1-carboxylate Sodium triacetoxyborohydride (73 mg, 0.34 mmol) was added to a solution of tert-butyl (R)-(4-oxo-1-(phenylthio)butan-2-yl)carbamate (72 mg, 0.25 mmol), 2,2,2-trichloroethyl piperazine-1-carboxylate (86 mg, 0.29 mmol) and acetic acid (21 µL, 0.37 mmol) in tetrahydrofuran (10 mL). The mixture was stirred for 5 h and then water (15 mL) was added, and the product was extracted with dichloromethane (3 × 20 mL). The combined organic phases were washed with brine (30 mL), dried (MgSO4), filtered, and evaporated to dryness to obtain a brown oil. Yield 133 mg. MS (ESI)+: calculated for C22H33Cl3N3O4S 540.12 [M + H]+; found 540.1. 1H NMR (400 MHz, CDCl3) δ ppm 7.39 (d, J = 7.6 Hz, 2H), 7.29 (t, J = 7.6 Hz, 2H), 7.19 (t, J = 7.2 Hz, 1H), 5.41 (br s, 1H), 4.75 (s, 2H), 3.96 –3.82 (m, 1H), 3.73 –3.56 (m, 4H), 3.22 (dd, J = 17.6, 7.4 Hz, 1H), 3.02 (s, 1H), 2.77 –2.22 (m, 6H), 2.03 –1.87 (m, 2H), 1.42 (s, 9H).
The active and inactive form of the VHL ligands were made with known methods96,97 and the linker molecules used for coupling described below.
Synthesis of active VHL-linker
6-{[(2S)-1-[(2S,4 R)-4-hydroxy-2-({[4-(4-methyl-1,3-thiazol-5-yl)phenyl]methyl}-carbamoyl)pyrrolidin-1-yl]-3,3-dimethyl-1-oxobutan-2-yl]carbamoyl}hexanoic acid (2) Heptanedioic acid monoethyl ester (0.52 g, 2.8 mmol) was added to a solution of (2S,4 R)-1-[(2S)-2-amino-3,3-dimethylbutanoyl]-4-hydroxy-N-{[4-(4-methyl-1,3-thiazol-5-yl)phenyl]-methyl}pyrrolidine-2-carboxamide (1.2 g, 2.8 mmol), diisopropylethyhylamine (1.4 mL, 8.4 mmol) and TBTU (2-(1H-Benzotriazole-1-yl)-1,1,3,3-tetramethylaminium tetrafluoroborate) (0.98 g, 3.1 mmol) in dimethylformamide (10 mL) and stirred on at room temperature (RT). Sodium hydrogen carbonate (sat.) was added and the mixture was extracted with dichloromethane (×3). The organic phase was dried (Na2SO4) and evaporated. The product was treated with lithium hydroxide (0.2 g, 8.4 mmol) in tetrahydrofuran/H2O 1:1 (4 mL) over night, neutralized with acid resin (Dowex 50×8, H+ form; 20-50 mesh). The mixture was filtered and evaporated and redissolved in a small amount of dimethylformamide, then purified by chromatography on a short silica gel column in reverse phase, eluting with acetonitrile/H2O. Pure fractions were freeze dried to give the title compound as a solid. Yield 0.88 g. LC-MS: calculated for C29H41N4O6S 572.72; found 573.0[M + H]+. 1H NMR (400 MHz, d6-dimethyl sulfoxide) δ 8.98 (s, 1H), 8.56 (t, J = 6.0 Hz, 1H), 7.85 (d, J = 9.3 Hz, 1H), 7.40 (q, J = 8.4 Hz, 4H), 4.53 (d, J = 9.3 Hz, 1H), 4.49 –4.39 (m, 3H), 4.35 (s, 1H), 4.28 –3.53 (m, 2H), 2.44 (s, 3H), 2.15 (dd, J = 14.1, 6.8 Hz, 2H), 2.30 –1.83 (m, 2H), 2.11 –1.98 (m, 2H), 1.56 –1.38 (m, 4H), 1.21 (ddd, J = 19.8, 14.8, 7.4 Hz, 2H), 0.93 (s, 9H).
Synthesis of inactive VHL-linker
6-{[(2S)-1-[(2S,4S)-4-hydroxy-2-({[4-(4-methyl-1,3-thiazol-5yl)phenyl]-methyl}-carbamoyl)pyrrolidin-1-yl]-3,3-dimethyl-1-oxobutan-2-yl]carbamoyl}hexanoic acid (3) The procedure was the same as for compound 2 using (2S,4S)-1-[(2S)-2-amino-3,3-dimethyl-butanoyl]-4-hydroxy-N-[[4-(4-methylthiazol-5-yl)phenyl]methyl]pyrrolidine-2-carboxamide. LC-MS: calculated for C29H41N4O6S 573.72; found 573.2 [M + H]+.
Synthesis of active targeted-protein degrader CBK603803
(2S,4 R)-1-[(2S)-2-(7-{4-[(3 R)-3-{[4-({[4-(4-{[2-(4-chlorophenyl)-5,5-dimethylcyclohex-1-en-1-yl]methyl}piperazin-1-yl)phenyl]formamido}sulfonyl)-2-trifluoromethane-sulfonylphenyl]amino}-4-(phenylsulfanyl)butyl]piperazin-1-yl}-7-oxoheptanamido)-3,3-dimethylbutanoyl]-4-hydroxy-N-{[4-(4-methyl-1,3-thiazol-5-yl)phenyl]methyl}-pyrrolidine-2-carboxamide (CBK603803, further referred as CBK03).
HBTU (5 mg, 13 µmol) was added to a solution of (1) (8 mg, 8 µmol), (2) (5 mg, 10 µmol) and triethylamine (12 µL, 86 µmol) in dichloromethane (2 mL) and stirred on. The solvent was evaporated, and the residue was purified by basic preparative reversed phase HPLC to yield 4 mg (32%). Calculated for C76H95ClF3N10O10S4 1527,567, Found 1527.2 (M + 1). 1H NMR (400 MHz, chloroform-d) d ppm 0.93 (s, 9 H) 0.97–1.02 (m, 6 H) 1.23–1.38 (m, 3 H) 1.47 (t, J = 6.25 Hz, 3 H) 1.51–1.64 (m, 5 H) 1.71 (br. s., 3 H) 2.02–2.31 (m, 13 H) 2.42 (br. s., 6 H) 2.50 (s, 3 H) 3.02 (dd, J = 13.70, 6.57 Hz, 2 H) 3.11 (dd, J = 13.57, 5.19 Hz, 2 H) 3.35 (br. s., 6 H) 3.56 – 3.62 (m, 1 H) 3.66 (br. s., 1 H) 3.92 (br. s., 1 H) 4.10 (d, J = 11.38 Hz, 1 H) 4.34 (dd, J = 15.01, 5.25 Hz, 1 H) 4.49 – 4.61 (m, 3 H) 4.74 (t, J = 7.94 Hz, 1 H) 6.25 (d, J = 9.01 Hz, 1 H) 6.64 (d, J = 9.51 Hz, 1 H) 6.77 (d, J = 8.88 Hz, 2 H) 6.99 (d, J = 8.25 Hz, 2 H) 7.11 (d, J = 8.25 Hz, 1 H) 7.27 – 7.40 (m, 10 H) 7.53 (br. s., 1 H) 7.68 (d, J = 8.75 Hz, 1 H) 8.09 (d, J = 9.26 Hz, 1 H) 8.36 (s, 1 H) 8.68 (s, 1 H).
Synthesis of inactive targeted protein-degrader CBK603804
(2S,4S)-1-[(2S)-2-(7-{4-[(3 R)-3-{[4-({[4-(4-{[2-(4-chlorophenyl)-5,5-dimethylcyclohex-1-en-1-yl]methyl}piperazin-1-yl)phenyl]formamido}sulfonyl)-2-trifluoromethane-sulfonylphenyl]amino}-4-(phenylsulfanyl)butyl]piperazin-1-yl}-7-oxoheptanamido)-3,3-dimethylbutanoyl]-4-hydroxy-N-{[4-(4-methyl-1,3-thiazol-5-yl)phenyl]methyl}-pyrrolidine-2-carboxamide (CBK603804, further referred as CBK04-NC).
HBTU (Hexafluorophosphate benzotriazole tetramethyl uranium) (4 mg, 10 µmol) was added to a solution of 1 (7 mg, 7 µmol), 3 (5 mg, 9 µmol) and triethylamine (10 µL, 72 µmol) in dichloromethane (2 mL) and stirred for 2 h. The solvent was evaporated, and the residue was purified by basic preparative reversed phase HPLC to yield 4 mg (36%). Calculated for C76H94ClF3N10O10S4 1527,57, Found 1527.2 (M + 1). 1H NMR (400 MHz, chloroform-d) d ppm 0.92 (s, 9 H) 1.01 (s, 6 H) 1.20–1.84 (m, 21 H) 2.02 (s, 1 H) 2.05–2.52 (m, 26 H) 2.92–3.18 (m, 4 H) 3.42 (br. s., 5 H) 3.57–3.74 (m, 2 H) 3.82 (d, J = 11.13 Hz, 1 H) 3.92 (d, J = 4.00 Hz, 2 H) 4.22–4.35 (m, 1 H) 4.42–4.49 (m, 1 H) 4.53 (d, J = 9.01 Hz, 1 H) 4.59–4.69 (m, 1 H) 4.73 (d, J = 8.76 Hz, 1 H) 5.47–5.57 (m, 1 H) 6.02–6.10 (m, 1 H) 6.63 (s, 1 H) 6.78 (d, J = 8.88 Hz, 2 H) 7.00 (d, J = 8.25 Hz, 2 H) 7.08–7.17 (m, 1 H) 7.28–7.41 (m, 10 H) 7.43–7.63 (m, 2 H) 7.68 (d, J = 8.38 Hz, 2 H) 8.07 – 8.13 (m, 1 H) 8.37 (d, J = 2.13 Hz, 1 H) 8.69 (s, 1 H).
Immunoblotting
PDCs from OV030 patient were seeded in T25 flasks at a density of 1.3 × 10⁶ cells and treated with A-1331852 (1,000 nM) or a range of CBK03 concentrations (14 to 1100 nM, synthesized as described above). Cells were lysed after 12 or 24 h of treatment using 1X Pierce RIPA buffer (Thermo Fisher Scientific) supplemented with Halt Protease and Phosphatase inhibitor cocktail (Thermo Fisher Scientific). Protein concentrations were determined using the Pierce BCA Protein Assay Kit (Thermo Fisher Scientific), and lysates were stored at −80 °C until further use. For Western Blotting, equal amount of proteins were separated on NuPAGE 4-12% Bis-Tris protein gels (Invitrogen) and transferred to PDVF membranes (Thermo Fisher Scientific) using Power Blotter system (Invitrogen). SeeBlue (Invitrogen) and Magic Marker XP (Invitrogen) were used as protein standards. Membranes were then blocked in 5% nonfat dry milk (Cell Signaling Technologies) for 1 h at RT, followed by overnight incubation at 4 °C with primary antibodies against Bcl-xL (#2764, Cell Signaling Technologies) and Vinculin (700062, Invitrogen) or beta-tubulin (#86298, Cell Signaling), used as loading control. After washing, membranes were incubated for 1 h at RT with species-appropriate horseradish peroxidase (HRP) conjugated secondary antibodies (donkey anti-rabbit or anti-mouse). Protein detection was performed using SuperSignal chemiluminescent substrate (Thermo Fisher Scientific); images were acquired using the Amersham Imager 600 (GE Healthcare). Band intensities were quantified using ImageJ (v1.53) software. Details of the antibodies used and corresponding experimental conditions are provided in Supplementary Table 9, full gels are provided in Supplementary Fig. 9.
Immunofluorescent staining
Immunofluorescent (IF) staining was used to assess target protein expression in OV030 models. Cells were seeded into 384-well plates (Revvity) containing pre-spotted drugs when applicable. Sample preparation, staining, and imaging were performed as described earlier26. Antibodies and their respective concentrations used in the IF assay are listed in Supplementary Table 9. In addition, cells were stained with phalloidin-647 (1:300, Invitrogen) to enable acquisition of cytoskeleton of all cells.
Ex vivo drug testing
Biobanked patient materials were used to validate effects of chosen drugs and their combinations. Cell processing and spheroid treatment were performed as indicated before26,30. Clinical information describing the characteristics of the patient material is provided in Supplementary Table 2.
Model characterization using flow cytometry
OV030 patient models: OV030-R and OV030-S, were used for surface marker characterization by flow cytometry assay. Cells were plated in 6-well plates at density of 0.62 × 10⁶ cells per well with 0.01% DMSO. After three days in culture, cells were detached and dissociated with TrypLE. Further, samples were blocked, stained, and acquired as previously described26.
Drug synergy assays
For two or three drug combinations in 2D assays, a selection of PDCs and CCLs was used following DST protocol as described above. In two-drug combinations, A-1331852 was tested at five concentrations ranging from 0.1 to 1,000 nM (10-fold dilution). γ-secretase inhibitors: MK-0752 (MedchemExpress), Nirogacestat (MedchemExpress), and PROTAC CBK03 were tested at concentrations of 0.1, 1, 10, 100, 1000, 10,000, 20,000 nM. For three-drug combinations, A-1331852 was tested at 1000, 100 nM concentrations, Nirogacestat and CBK03 at 10,000 and 20,000 nM and Carboplatin (Sigma-Aldrich) at 10,000 nM.
Long-term treatment recovery assay
Cells OV030-R, OV030-S and OV039-PDF were seeded into black ULA U-bottom 384-well plate (Corning) to allow spheroid formation. After two days, spheroids were treated with a single (A-1331852, CBK03, Nirogacestat, and Carboplatin) and combination drug treatment. Concentrations for each drug used in assays: for A-1331852: 1,000, 100, 10 nM, for CBK03: 20, 10, 1 mM, for Nirogacestat: 20, 10 mM, for Carboplatin: 10 mM. Drugs were pre-spotted into 384-well plates (Greiner) and dissolved in Rockit media containing live-cell dyes: TMRM (Thermo Fisher Scientific) and Sytox-Green (Invitrogen). The drug containing media was then transferred to the spheroid plates. Spheroids were treated for five days with addition of drugs after three days. At the end of the 5-day treatment period, spheroids were washed three times with the corresponding culture media. Media changes were performed every 2-3 days throughout a 15-day assay. All liquid handling steps, including drug addition, media changes, and washes were carried out using the Apricot® S3 (SPT LabTech) liquid handling system.
Imaging and image analysis
All imaging was performed using the OperaPhenix high-content screening system (Revvity). Live-dead images of long-term treatment recovery and ex vivo cultures were acquired at 10X, capturing one field of view (FOV) with up to 20 z-stack planes at 0 and 72 h after treatment. IF stained cells were imaged at 20X using 9 FOV with 3% overlap at 24 or 72 h of culture. For HES1 staining, images were acquired using a 40X water immersion objective, capturing 49 FOV with 3% overlap at both 24 and 72 h.
Image analysis was conducted using Harmony software v5.2 (Revvity). Analysis of long-term recovery treatment and ex vivo spheroids followed analysis pipeline described previously26, using spheroid volume as the primary output and additional parameters for morphological comparison. For IF images stained for ALDH1A1, CD44, CK8/18, FSP1, MUC16, VIM, and α-SMA, all channels were first pre-processed using Gaussian smoothing. Nuclei were identified using detection method “B”; cytoplasm and cell masks were segmented using methods “D” and “P”, respectively. Marker positivity was quantified as the proportion of marker-positive cells relative to total cells identified by phalloidin staining. For nuclear markers, PAX8, HES1 the percentage of marker-positive nuclei were calculated relative to the total number of Hoechst-stained (Invitrogen) nuclei.
Data analysis and statistics
All data analysis and visualizations were performed using R v4.5.0. DSS from single drugs and combination screens were calculated using Breeze web-based tool (FIMM, Finland), applying DSS2 method and four-parametric (4-PL) curve fitting98,99. Assay quality was assessed using Z’ factor calculations for each experiment (Supplementary Table 10). Drug synergy was quantified using the “synergyfinder” v3.16.0 R package. Growth rate correction was calculated based on previously published methods36. Flow cytometry data was analyzed using FlowJo v10.6.0 software (BD Biosciences). Fluorescent minus one (FMO) controls were used to correct for spectral overlap, while isotype controls were included to assess nonspecific binding. Differential proteomics abundance analysis from MS-based proteomics data was conducted using the “DEqMS” v1.26.0 R package. Fold change values derived from comparison between two untreated OV030 models, or between untreated and A-1331852 treated, were used for gene set enrichment analysis (GSEA) using the “clusterProfiler” v4.16.0 R package. Visualizations of the CNV were done with “GenVisR” v.1.39.0 R package. Statistical tests used for comparison between two or more groups are detailed in the figure legends. Statistical significance was defined as p < 0.05 and is indicated in the text where applicable.
