


Establishment of prostate-specific human SKP2-KI mouse lines by a CRISPR/Cas9 method
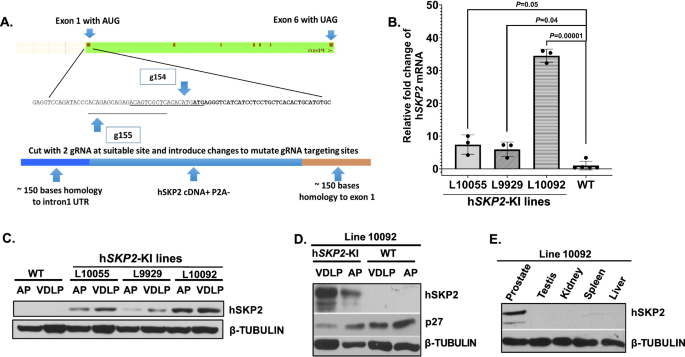
The P2A-hSKP2 coding sequence was introduced into the guide RNA-generated DNA break by a CRISPR/Cas9 method in the endogenous mouse probasin at exon 1 locus (Fig. 1A) for expression of hSKP2 under control of the mouse probasin promoter. Probasin-hSKP2-KI mouse lines were screened using specific PCR of genomic DNA extracted from mouse tail biopsy and confirmed the correct sequencing of the genomic insert by the Sanger sequencing. Nineteen of 43 (44.2%) KI founder mice were genotyped positive. Three probasin-hSKP2-KI mouse lines (L9929, L10055 and L10092) show 5, 7-to-35-fold overexpression of hSKP2 in the prostate compared to that in the prostate of wild-type mice (Fig.1B). Western blotting analysis using human specific anti-SKP2 antibody reveals that human SKP2 protein is expressed in the microdissected prostate lobes (anterior, dorsal, lateral, and ventral lobes) of three probasin-hSKP2-KI mouse lines but not in the prostate of wild-type mice (Fig. 1C). The expression level of hSKP2 protein is lower in the anterior lobe compared to other prostate lobes (Fig. 1C). Consistently, p27Kip1 protein, a putative substrate of SKP2 is down-regulated in the prostate of probasin-hSKP2-KI line L10092 (Fig. 1D). There is no detectable hSKP2 protein in other organs of the L10092 line, including testis, kidney, spleen, and liver (Fig. 1E). These results indicate that SKP2 overexpression is prostate-specific in the probasin-hSKP2-KI lines.
SKP2 overexpression induces hyperplasia, mPIN and low-grade carcinoma associated with increased SKP2 expression and cell proliferation and decreased expression of p27Kip1
Histological evaluation shows that H&E-stained prostate lobes (anterior, dorsal, lateral, and ventral lobes) of probasin-hSKP2-KI mice at different ages (4, 9, and 14 months of age) exhibit different grades and proportions of marked enlargement and variation in the duct size, thicker and disoriented epithelial layers, primitive cribriform patterns, filled duct lumens, vacuolated cytoplasm, prominent round to oval nuclei with one or more nucleoli, and multiple mitotic figures, while similar lesions were not found in the prostate of wild type mice at the same ages (Fig. 2A, B). At 4 months of age, 64% (7 out of 11) of probasin-hSKP2-KI mice were observed with hyperplasia and low-grade mPIN; 50% (6/12), 42% (5/12), and 8% (1/12) of probasin-hSKP2-KI mice with low-grade PIN, high-grade PIN, and hyperplasia, respectively, at 9 months of age; 7% (1/15), 80% (12/15) and 13% (2/15) of probasin-hSKP2-KI mice with low grade PIN, high grade PIN and low-grade carcinoma at 14 months of age, respectively (Fig. 2C). The mean prostate weights of probasin-hSKP2-KI mice were significantly increased compared to those of wild-type mice (P < 0.05) at 14 months of age (Fig. 2D).
Fig. 2: Histopathological evaluation of the prostate of hSKP2-KI and WT mice.
A, B Representative images of H&E-stained sections from ventral and lateral prostate (VLP) and dorsal and anterior prostate (DAP) glands of WT and hKP2-KI mice are shown. Overexpression of human SKP2 in the prostate of mice results in hyperplasia at 4 months of age. Increased layers of epithelial cells were observed (arrow) in prostate lobes of hSKP2-KI mice, whereas the prostate epithelium of WT mice is in flat layer and maintains normal columnar and cuboidal shape. Mouse prostatic intraepithelial neoplasia lesions were observed in hSKP2-KI mice at age of 4, 9 and 14 months, featured by nuclear stratification, enlargement and hyperchromasia. Low-grade carcinoma was detected in the prostate of hSKP2 mice at 14 months of age. Atypical epithelial cells proliferate and partially fill the duct. Enlarged nuclei and prominent macronucleoli present in the nests of cells indicate low-grade carcinoma. Scale bar: 100 µm. C The distribution of prostatic lesions in hSKP2-KI mice at age of 4 (n = 11), 9 (n = 12) and 14 (n = 15) months. D Prostate weights of hSKP2-KI and WT mice were measured at 4 (n = 15 and 10), 9 (n = 12 and 12), and 14 (n = 14 and 11) months of age, respectively. A significant increase in the mean prostate weights was observed in hSKP2-KI mice at 14 months of age compared to that of WT mice (“*” detonates P < 0.05, Student’s t test).
IHC analysis reveals that strong SKP2 positive staining was mainly observed at the sites of prostatic lesions (i.e. hyperplasia, PINs and low-grade carcinoma), accompanied by decreased staining intensities of p27Kip1 in probasin-hSKP2-KI mice compared to those from wild-type mice (Fig. 3A). In addition, cell proliferation was significantly enhanced in the prostates of probasin-hSKP2-KI mice as indicated by increased Ki67 positive staining cells by ~26 folds compared to those from wild-type mice (P < 0.01) (Fig. 3B, D), while there was no significant difference in AR expression in the prostates between probasin-hSKP2-KI mice and wild-type mice (Fig. 3C, E).
Fig. 3: Examination of hSKP2, p27Kip1, and AR expression by immunohistochemistry analysis of WT and hSKP2-KI mouse prostates.
A–C Immunohistochemistry staining reveals robust expression of human SKP2 protein in the prostate of hSKP2-KI mice accompanied by a reduction in p27Kip1 expression. Representative images of hSKP2, P27Kip1, Ki67, and AR staining on the prostate of WT and hSKP2-KI mice. Scale bar: 100 µm for hSKP2 and p27Kip1 and 50 µm for Ki67 and AR staining images. D, E Ki67 and AR positively stained cells were counted in 12 arbitrary fields under microscope. The mean percentage of Ki67-positive cells was significantly elevated in hSKP2-KI mouse prostates compared to WT mouse prostates. The mean percentages of AR-positive cells are not significantly different between WT and hSKP2-KI mice prostates. “**” denotes P < 0.01. Mice used for the immunohistochemistry study were 12–14 months old and n = 4.
Gene expression profiling reveals differentially expressed genes and significant enrichment of EMT and interferon pathways in SKP2 overexpressing mouse prostates
We performed bulk RNA sequencing to determine the effect of SKP2 overexpression on global gene expression alterations in the prostate of probasin-hSKP2-KI mice and wild-type mice. A total of 1753 differentially expressed genes (DEGs) were identified with a false discovery rate (FDR) p-value < 0.05. Among them, 678 genes demonstrated more than a two-fold change in expression, including 498 genes being up-regulated and 180 genes downregulated (Fig. 4A, B). The top DEGs include Fcgbp, Krt4, Slc6a2, Mme, Egf, Adh6a, Clu, Lrrc31, Sim2, Mmp12, Ly6k, Ly6d, Ly6a, etc. Androgen responsive genes (Ccnd1, Hmgcr, Tmprss2, Insig1, Dhcr24, and Bmpr1b), G2M related genes (Slc7a1, Egf, and Cul4a) and apoptosis related genes (Clu, Bcl2, and Sc5d) are also on the top list of DEGs. The Gene Ontology (GO) gene set enrichment analysis (GSEA) highlights the activation of extracellular matrix components, leukocytes migration, and mesenchymal cell proliferation pathways in SKP2 overexpressing mouse prostates (Fig. 4C). In addition, GSEA of hallmark genes revealed upregulation of EMT, interferon alpha and gamma, angiogenesis, and inflammatory response pathways and down-regulation of cholesterol homeostasis, mTORC1, and androgen response pathways, which are significantly enriched in SKP2 overexpressing mouse prostates (Fig. 4D and Supplementary Fig. 1).
Fig. 4: DEGs and significantly altered pathways in the prostate of hSKP2-KI mice were unveiled by bulk RNA sequencing analysis.
A Hierarchical clustering heatmap of differential gene expressions between WT and hSKP2-KI mouse ventral prostates (n = 4). B Volcano plot was used to visualize the distribution of significantly upregulated and downregulated genes in hSKP2-KI versus WT mouse prostates with an FDR < 0.05. C Significantly upregulated components and pathways in hSKP2-KI mouse prostates compared to WT mouse prostates by GSEA enrichment of Gene Ontology (GO). D GSEA of hallmark pathways identified marked elevations and down-regulations in pathways associated with EMT and interferon responses and with cholesterol homeostasis, mTORC1, and androgen response, respectively, in hSKP2-KI mouse prostates.
The list of enriched gene expression alterations in EMT and interferon pathways is shown as enrichment profiles and heatmaps in Fig. 5A, B, D, E. The increased gene expression levels of selected EMT pathway genes, including Fmod, Thy1, Wnt5a, and Vim, and interferon gamma pathway genes, such as Tnfaip2, Cd38, Pfkp, Il15, Lats2 were verified by quantitative PCR method (Fig. 5C, F and Supplementary Fig. 2).
Fig. 5: The alterations of EMT and interferon response pathways were highly enriched in hSKP2-KI compared to WT mouse prostates.
A EMT GSEA enrichment plot. B The heatmap of top enriched genes in the EMT pathway. C Quantitative PCR was performed to verify the expression of EMT-associated genes in mouse prostates, including Fmod, Thy1, Wnt5a, and Vim. D GSEA enrichment plot of interferon gamma response. E The heatmap of top enriched genes in the interferon gamma response pathway. F Quantitative PCR was used to validate the expression of interferon-responsive genes in mouse prostates, including Cd38, Tnfaip2, pfkp, Il15, and Lats2. N = 4, “*” and “**” denote P < 0.05 or 0.01, respectively.
Cell deconvolution analysis reveals an increase in fibroblasts and a decrease in infiltrating T and B cells in SKP2-overexpressing mouse prostates
Given the profound alterations in gene expression of EMT, extracellular matrix and interferon pathways in SKP2 overexpressing mouse prostates, we have deconvoluted the probasin-hSKP2-KI and WT bulk RNA-seq data using the R package CIBERSORTx. The cell deconvolution analysis revealed significant differences in the proportional compositions of various immune and stromal cell types in the prostate of the hSKP2-KI versus WT mice (Fig. 6A). The hSKP2-KI mice exhibit a significantly higher proportion of fibroblasts in the prostate compared to that of WT mice (P = 0.0122, Student’s t test) (Fig. 6B). A reduction in lymphoid lineage cells and an expansion of myeloid lineage cells have also been observed in the prostate of hSKP2-KI mice compared to that of WT mice. Notably, hSKP2-KI mouse prostate glands demonstrate a significantly lower proportion of CD8+ T cells, B cells, and myeloid dendritic type I cells compared to WT mouse prostate glands (Ps = 0.0435–0.0012, Student’s t test). Proliferating classical monocytes that have the potential to differentiate to tumor-associated macrophages, which suppress T cell function [25]. were found to infiltrate into the prostate of hSKP2-KI mice more than that of WT mice (P = 0.008, Student’s t test).
Fig. 6: Single-cell deconvolution of bulk RNA sequencing data and examination of extracellular matrix by Masson’s trichrome staining analysis in WT and hSKP2-KI mouse prostates.
A, B Cell lineage proportions and fractions of different cell types were derived by deconvoluting bulk RNA sequencing data that were generated from WT and hSKP2-KI mice prostates. C Masson’s trichrome staining highlights significantly increased collagen deposition in the prostate lobes of hSKP2-KI mice compared to those of WT mice, as indicated by stronger blue staining. Scale bar: 50 µm. D Expression of many collagen-related genes is significantly upregulated in the prostates of hSKP2-KI mice compared to those of WT mice.
We have further evaluated the extracellular (i.e. collagen) components of hSKP2-KI and WT mouse prostates using Masson’s Trichrome staining and expression of collagen-related genes. Figure 6C, D shows a markedly enhanced collagen staining and upregulation of numerous collagen-related genes in the prostate of hSKP2-KI mice versus WT mice. Taken together, these results suggest that SKP2 overexpress induces the remodeling of ECM and creates an immune suppressive prostatic microenvironment to support tumor initiation and development.
SKP2 is sparsely overexpressed in human prostate hyperplasia, PIN and prostate adenocarcinoma compared to prostate normal tissues; Higher levels of SKP2 mRNA in prostate tumor tissues are associated with poorer survival of prostate cancer patients
Next, we examined the expression status of SKP2 on TMAs of prostate tissues with different pathology including hyperplasia, tumor adjacent tissue, PIN, adenocarcinoma, and normal prostate tissues. SKP2 is sparsely overexpressed in hyperplasia, tumor adjacent tissues, PIN and adenocarcinoma with average percentage of positive SKP2 staining cells per core of 0.34%, 0.46%, 1.16%, and 2.43%, respectively, compared to that of normal prostate tissues (0.12%) (Fig. 7A, B) (Ps < 0.05). 10% (1/10) of prostate normal tissue cores, 68.6% (33/49) of hyperplasia, 60% (3/5) of tumor adjacent tissues, 97.6% (41/42) of PIN, and 81% (113/138) prostate adenocarcinoma tissue cores were positive for SKP2 (Table 1). There is no significant difference in SKP2 expression among prostate adenocarcinoma tissue cores with different Gleason scores (Fig. 7C). The vast majority of positive SKP2 staining are localized in nucleus and a few cores of prostate adenocarcinoma exhibit cytoplasmic staining (Fig. 7A). The staining patterns of SKP2 in different prostate pathology in humans are consistent with the results from the probasin-SKP2-KI mice (Fig. 3A). Our results suggest SKP2 overexpression is an early event in prostate carcinogenesis.
Fig. 7: The expression status of SKP2 in different human prostate pathology; SKP2 is amplified in multiple cancers, and its overexpression predicts overall survival of prostate cancer patients.
A IHC analysis of SKP2 expressions in human prostate tissue microarrays including normal prostate tissues, prostatic hyperplasia, PIN, prostate adenocarcinoma, and prostate tumor adjacent tissues with mainly nuclear but some cytoplasmic staining. Scale bar: 100 µm. B, C SKP2 IHC staining in human prostate TMAs was quantified using HALO software. Percentage (%) SKP2 positive cells were graphed either by diagnosis or by Gleason score for adenocarcinoma cases. Each dot represents one tissue core. D Human SKP2 gene is frequently amplified in multiple cancers in cBioportal datasets. E Higher SKP2 mRNA expression levels in prostate tumor tissues are significantly associated with poorer survival of prostate cancer patients with metastatic disease (Log-rank test, P < 0.05, data were from SU2C/PCF Dream Team, PNAS 2019).
Table 1 The summary of SKP2 staining results in different histological diagnoses on prostate TMAs.
In addition, we explored the cBioportal dataset for the frequencies of SKP2 genetic alterations (i.e. amplification, deep deletion, and mutation) in cancers. We observed that amplification of SKP2 frequently occurs in various cancers, including sarcoma, urothelial or bladder cancer, lung cancer, gastric cancer, metastatic prostate cancer, and prostate adenocarcinoma with a range from about 12% to 6% (Fig. 7D). Analysis of RNA expression levels with available survival data in the SU2C/PCF Dream Team, PNAS 2019 study shows that higher levels of mRNA levels in prostate tumor tissues are significantly associated with poorer survival of prostate cancer patients (P < 0.05, Log-rank test) (Fig. 7E). These results suggest that SKP2 overexpression is an unfavorable prognostic factor associated with disease aggressiveness.
SKP2 overexpression promotes cell migration and invasion, and regulates the expression of EMT, and genes related to interferon signaling
To further evaluate the association of SKP2 overexpression with aggressiveness of prostate cancer, we have performed cell migration and invasion experiments, as well as quantitative PCR analysis of the expression of EMT and interferon pathways related genes using prostate cancer cell lines C4-2B (AR positive) or PC3 (AR negative) with or without SKP2 overexpression. Figure 8A–C shows that SKP2 overexpression increases cell migration of C4-2B and PC3 cells by 6.9 and 1.8 folds, respectively, and invasion of C4-2B and PC3 cells by 3.7 and 4.5 folds, respectively, compared to C4-2B or PC3 cells expression vector control pcDNA3.1 (Ps < 0.01–0.001, n = 3, Student’s t test). In addition, SKP2 overexpression in PC3 cells increases the expression of EMT and interferon gamma pathway related genes as described above in the hSKP2-KI mouse model, including FMOD, THY1, TNFAIP, IL15, PFKP, USP18, and LATS2 (Ps < 0.05 to 0.001, n = 4, Student’s t test, Fig. 8D). Taken together, data from the hSKP2-KI mouse model, human prostate cancer clinical data and in vitro human prostate cancer cell culture studies are consistent, at least in part, to support the critical role of SKP2 overexpression promote aggressiveness of prostate cancer by regulating the EMT and interferon pathways. Our data suggest that the humanized mouse model recapitulates human prostate cancer.
Fig. 8: SKP2 overexpression promotes cell migration and invasion and regulates EMT and interferon signaling.
A, B Prostate cancer PC3 and C4-2B cells overexpressing SKP2 exhibit significantly enhanced migratory and invasive capabilities compared to PC3 and C4-2B cells expressing vector control. Scale bar: 100 µm. C Quantification of migrated and invaded C4-2B and PC3 cells overexpressing SKP2 v.s. vector control. Data are presented as mean ± SD, n = 3, two tailed Student’s t test. “**” and “***” denote P < 0.01 and 0.001, respectively. D The overexpression of SKP2 in PC3 cells led to the up regulation of genes involved in EMT and interferon responses related genes. Data are presented as mean ± SD, n = 4, two tailed Student’s t test. “*”, “**”, and “***” denote P < 0.05, 0.01, and 0.001, respectively.
The effects of FKA, a SKP2 degrader, and SKP2 C1 inhibitor on expression of EMT markers and interferon-related genes in SKP2-overexpressing prostate cancer cells
We have previously reported that FKA acts as a SKP2 degrader for selectively inhibiting the growth of prostate cancer PC3 cells overexpressing SKP2 [17]. In addition, SKP2 inhibitor C1 has been shown to specifically target the interaction between SKP2 and p27Kip1, preventing the binding and subsequent ubiquitination and degradation of p27Kip1 [26]. E-cadherin, N-cadherin, and Vimentin are hall markers for EMT and Twist is a master transcriptional factor of EMT [21]. Figure 9A, B shows that FKA and C1 treatments result in a dose-dependent up-regulation of E-cadherin and down-regulation of N-cadherin and Vimentin proteins accompanied by decreased protein levels of Twist in both 22Rv1 cells (with SKP2 gene amplification) and PC3 overexpressing SKP2. In addition, FKA treatment results in a dose-dependent decrease in mRNA expression of VIM, IFITM3, PFKP, and USP18 in both 22Rv1 and PC3/SKP2 cell lines, whereas C1 treatment only decreases the expression of VIM and IFITM3 (Fig. 9C, D). The results suggest that inhibition of SKP2 by FKA or C1 can reverse the EMT process and aggressiveness of prostate cancer cells.
Fig. 9: The effects of FKA and C1 inhibitor on expression of EMT markers and interferon-related genes in SKP2 overexpressing prostate cancer cells.
A, B Western blotting analysis of E-Cadherin, N-Cadherin, Vimentin and Twist1 protein levels after 22Rv1 cells and PC3 overexpressing SKP2 were treated with FKA and C1 at indicated concentrations for 24 h. β-ACTIN is used as a loading control. C, D Quantitative PCR analysis of mRNA levels after 22Rv1 cells and PC3 overexpressing SKP2 were treated with FKA and C1 at indicated concentrations for 24 h. Data are presented as mean ± SD, n = 4, one-way ANOVA was conducted and post-ad hoc comparisons using the Bonferroni test. “*”, “**”, and “***”, “****” denote P < 0.05, 0.01, and 0.001, 0.0001, respectively.
Generation and characterization of prostate organoids derived from hSKP2-KI mice for testing SKP2-targeting agents
Since in vivo studies of SKP2 targeting agents using mouse models are often time consuming and cost-prohibitive, we therefore established cultures of prostate organoids from the prostate of both hSKP2-KI and WT mice to facilitate screening of selective SKP2 targeting agents. H & E staining and histological analysis shows that the morphology of prostate organoids from WT mice is characterized by a branched, acinar-like structure and mimics the in vivo the epithelial architecture of mouse prostate tissue, while prostate organoids from hSKP2-KI mice display a morphology of a distorted acinar-like structure with multiple layers of cells and filled lumens (Fig. 10A). Prostate organoids from hSKP2-KI mice also show strong expression of SKP2 accompanied by negative staining of p27Kip1, whereas prostate organoids from WT mice exhibit the opposite expression status of SKP2 and p27Kip1. AR expression is also positive in prostate organoids derived from both SKP2-KI and WT mice (Fig. 10A).
Fig. 10: Characterization and validation of mouse prostate organoids derived from WT and hSKP2-KI mouse prostates as a tool to test SKP2 targeting agents.
A Mouse prostate lobes were dissected, digested into single cells, and seeded in Matrigel. Organoids formation was visualized by a brightfield microscope after seeding for 5–7 days. Prostatic organoids derived from WT and hSKP2-KI mice recapitulate prostate acinar architecture and express AR, as shown by H&E and immunohistochemistry staining, respectively. Scale bar: 20 µm. Human SKP2-KI organoids exhibit stronger SKP2 staining but weak p27Kip2 expression compared to WT organoids. Scale bar: 50 µm. B, C Representative images of WT and hSKP2-KI mouse prostate organoids that were treated with FKA and C1 at 20 µM for 8 days. D, E These organoids were imaged and recorded every two days, and the size of these organoids were measured by image J software, Scale bar: 100 µm. One way ANOVA test was used to compare the effects of FKA or C1 v.s. vehicle control on the growth of organoids over time, n = 15, “*” and “ns” denote P < 0.05 and no significance, respectively.
To validate our organoid model, we therefore tested the selectivity of these known SKP2 inhibitors on the growth of SKP2 overexpressing prostate organoids versus normal prostate organoids to establish a “proof of concept” tool for future screening with more SKP2 inhibitors. Figure 10B, C shows that control-treated hSKP2-KI organoids continuously increase their sizes until day 4 after seeding, whereas FKA- and C1-treated hSKP2-KI organoids exhibit a significantly slower growth in size (Ps <0.05). However, C1-treated hSKP2-KI organoids recovered from their growth inhibition on day 8, whereas the mean size of FKA-treated hSKP2-KI organoids continued to decrease (Fig. 10D, E). This result suggests that hSKP2-KI organoids could potentially develop resistance to C1. In addition, both C1 and FKA exhibit no significant growth inhibitory effects on wild-type prostate organoids. FKA at 12.5 μM completely reduced cell viabilities of hSKP2-KI organoids 3 days after the treatment but had no effect on the growth of wild-type organoids (Supplementary Fig. 3). FKA exhibited excellent selectivity to the growth of hSKP2-KI organoids over wild-type organoids.
FKA but not C1 treatment reduces the protein level of SKP2 in hSKP2-KI organoids (Supplementary Fig. 4). FKA treatment of hSKP2-KI organoids also leads to a dose-dependent downregulation of EMT (e.g. Vim and Fmod) and interferon (e.g. Ifitm3 and Cd38) related gene expression, whereas C1 only down-regulates the mRNA expression of Vim and Cd38 in hSKP2-KI organoids (Supplementary Fig. 5). These results support that the differential mechanisms of targeting SKP2 signaling by FKA (via protein degradation) and C1 (via blockading the interaction between SKP2 and Cks1/p27Kip1) affect different sets of gene expression related to EMT and interferon signaling.
