


KLF4 is critical in immune surveillance of esophageal cancer
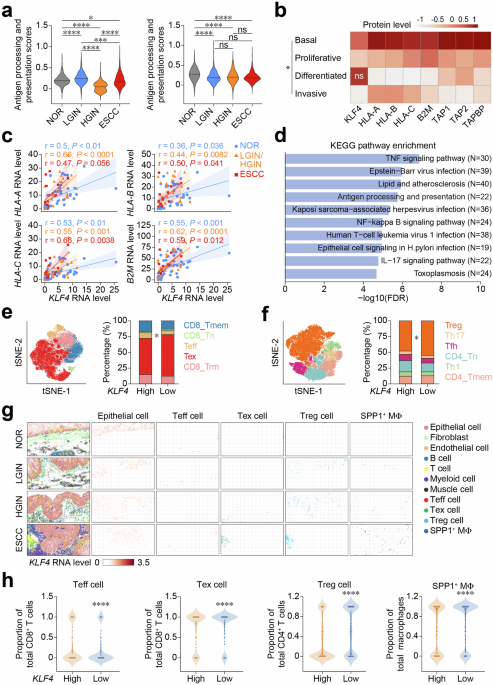
Our previous spatial transcriptomics data showed that the homeostasis of esophageal epithelium and T cells was progressively disrupted during ESCC development. Compared to normal epithelium (NOR) and low-grade intraepithelial neoplasia (LGIN), high-grade intraepithelial neoplasia (HGIN) and ESCC exhibited multiple shifted pathological structure hallmarks, including the depletion of basal cell populations, expansion of invasive cell populations and skewed T cell composition featuring depletion of effector T lymphocytes (Teff) alongside accumulation of exhausted T lymphocytes (Tex) and regulatory T lymphocytes (Tregs).45 These observations prompted us to investigate the underlying mechanisms. Our initial assessment of eight functional programs across epithelial cells44 revealed that the invasive cell subpopulation exhibited a markedly lower antigen-presenting score than the basal cell subpopulation (Supplementary Fig. 1a). Moreover, we found that epithelial cell-intrinsic antigen processing and presentation activity progressively declined from premalignant lesions to invasive carcinoma in the single-cell RNA sequencing data from multi-stage human and murine ESCC samples44,46 (Fig. 1a), suggesting that defective antigen presentation may drive immune evasion during ESCC development and progression.
Fig. 1
KLF4 is critical for immune surveillance against esophageal cancer. a Scores of antigen processing and presentation pathway across pathological stages in human (left) and mouse (right) esophageal samples. NOR, normal epithelium; LGIN, low-grade intraepithelial neoplasia; HGIN, high-grade intraepithelial neoplasia; and ESCC, esophageal squamous-cell carcinoma. b Heatmap depicting normalized KLF4 protein levels and the core antigen presentation components across basal, proliferative, differentiated and invasive epithelial cell subtypes. c Spearman correlation of KLF4 RNA levels with classical MHC class I genes (HLA-A, HLA-B, HLA-C, B2M) across NOR, LGIN, HGIN, and ESCC stages. Shaded areas represent 95% confidence interval. d Top 10 KEGG pathways significantly downregulated in KLF4-low epithelial cells versus KLF4-high epithelial cells. The differential distributions of CD8⁺ T cell (e) and CD4⁺ T cell (f) subsets between KLF4-high and KLF4-low samples. The left panel shows tSNE plots colored by T cell subtypes and the right panel shows frequencies of different T cell subsets between KLF4-high and KLF4-low ESCC samples from 60 individuals. g Spatial transcriptomic visualization of epithelial KLF4 RNA level and distributions of Teff cells, Tex cells, Treg cells and SPP1+ macrophages across the 4 disease stages. h Violin plots comparing KLF4 RNA levels and the proportions of Teff cells, Tex cells, Treg cells and SPP1+ macrophage populations between KLF4-high regions and KLF4-low regions in the spatial transcriptomic data of human multi-stage ESCC tumorigenesis. Data are mean ± SEM. P values in this figure were derived from Wilcoxon rank-sum test. *, P < 0.05, ****, P < 0.0001 and ns, not significant
Because antigen processing/presentation pathways are central to immune regulation, we performed proteomic analysis of human ESCC samples and found that compared with basal epithelial cells, invasive epithelial cells expressed significantly reduced levels of antigen-presentation pathway components (Fig. 1b). Subsequently, we aimed to identify key regulators responsible for the observed downregulation of the antigen presentation pathway. By integrating scRNA-seq data with proteomic profiles, we identified KLF4 as the most significantly altered regulator (Supplementary Fig. 1b). In the previous studies, we have identified KLF4 as a tumor suppressor that maintains mucosal defense mechanism in the esophagus, with its RNA levels being significantly decreased during development and progression of ESCC in human and mouse models44,46 (Supplementary Fig. 1c). KLF4 RNA levels showed a strong positive correlation with the RNA levels of classical MHC class I molecules HLA-A, HLA-B and HLA-C (Fig. 1c), indicating its potential role in regulating antigen presentation. These results implicate basal epithelial cells with high KLF4 expression as key mediators of antigen presentation capacity, potentially sustaining immune surveillance. By further analysis of these scRNA-seq data, we observed that effector CD8+ T cells decreased substantially while Tex and Treg cells expanded (Supplementary Fig. 1d, 1e). Notably, the KLF4 RNA levels in epithelial cells showed a positive association with effector T cell function and an inverse association with markers of exhausted T cells (Supplementary Fig. 1f, 1g). Analysis of cell-cell communications indicated that KLF4-high epithelial cells sustained a stronger interaction of their MHC class I with CD8+ T cells than KLF4-low epithelial cells (Supplementary Fig. 1h and 1i), suggesting a role for KLF4 in sustaining antigen-specific T cell response.
We thus validated these findings in our other published dataset from 60 ESCC samples47 and the results showed that KLF4-low ESCC had significantly suppressed expression levels of the antigen processing/presentation and MHC protein complex pathways compared with KLF4-high ESCC (Fig. 1d and Supplementary Fig. 1j). In addition, we found that KLF4-low ESCC displayed a more immunosuppressive microenvironment than KLF4-high ESCC, characterized by significantly reduced Teff cells but significantly increased Tex, Treg cells and SPP1+ macrophages (Figs. 1e, f and Supplementary Fig. 1k). We also examined the differences in spatial distributions of various CD8+ T cell subtypes between KLF4-high or -low ESCC samples in our previously reported spatial transcriptomic data45 and the results demonstrated that consistent with the KLF4 level decline from NOR, LGIN, HGIN to ESCC, the numbers of infiltrating Tex cells, Treg cells and SPP1+ macrophages gradually increased alongside a gradual decline of Teff cells (Fig. 1g). We partitioned 127 fields of view (FOVs) into square grids of 100 ×100 μm and classified them as high or low KLF4 level based on the mean KLF4 level across all grids. Low KLF4 grid regions, relative to high KLF4 ones, had significantly fewer Teff cells but significantly greater fractions of Tex cells, Treg cells and SPP1+ macrophages (Fig. 1h).
Since KLF4 is implicated in antigen presentation pathway, we next examined Teff cells by multiplex immunofluorescence. We observed that during ESCC progression, KLF4, MHC class I protein, and infiltrating GZMB+CD8+ T cells gradually and significantly declined (Supplementary Fig. 2a). Moreover, KLF4 levels positively correlated with the levels of MHC class I, the density of CD8+ T cells and the density of GZMB+ T cells (Supplementary Fig. 2b). Together, these results suggest that diminished KLF4 expression in basal cells of the esophageal epithelium may suppress cancer immune surveillance by disrupting the epithelial-T cell homeostasis.
KLF4-deficiency reduces MHC class I expression to promote immune evasion of ESCC
We next investigated whether KLF4 regulates MHC class I expression in ESCC cells from mice and human. Relative to control cells, KLF4/Klf4-KO cells had markedly reduced MHC class I levels (Figs. 2a–c), whereas KLF4-OE cells showed significantly increased MHC class I levels (Fig. 2d). In mouse allograft tumor models, tumors derived from Klf4-KO mEC25 cells had markedly accelerated growth and decreased MHC class I protein, diminished CD8⁺ and GZMB⁺CD8⁺ T cells infiltration compared with those derived from control mEC25 cells (Supplementary Fig. 3a–3c). To test whether these effects were dependent on impaired MHC class I related cytotoxicity, we established OVA-expressing mEC25 cell lines with or without Klf4 KO. The flow cytometry analysis showed that compared with Klf4-non-KO cells, Klf4-KO cells had significantly diminished expression levels of H-2Kb/D,b a mouse MHC class I molecule, and H-2Kb: OVA, an MHC class I and OVA complex (Fig. 2e, f). These OVA+ mEC25 cells were then cocultured with OT-I CD8⁺ T cells. When OT-I CD8⁺ T cells were present, Klf4-KO OVA+ mEC25 cells had significantly reduced cell death compared with Klf4-non-KO mEC25 cells. Moreover, OT-I CD8⁺ T cells cocultured with Klf4-KO OVA+ mEC25 cells produced significantly lower IFN-γ, GZMB and TNF-α compared with those cocultured with Klf4-non-KO OVA+ mEC25 cells (Figs. 2g–i). We then tested these KLF4 effects in the mouse allograft tumor model and found that the growth rate of tumors derived from Klf4-KO mEC25 cells was significantly faster than those from Klf4-non-KO mEC25 cells. However, when CD8⁺ T cells were depleted using anti-CD8β antibody, the growth rates of Klf4-KO and Klf4-non-KO tumors became similar and both grew much faster than tumors in mice without CD8+ T cell depletion (Fig. 2j, k). Flow cytometric analysis of allograft tumor tissues revealed that Klf4-KO tumors had significantly lower MHC class I and CD8+ T cell levels than Klf4-non-KO tumors, whereas the percentage of CD45+ cells and CD3+ T cells did not differ significantly between the two groups (Supplementary Fig. 3d–3f). Multiplex immunofluorescence analysis also indicated that Klf4-KO tumors had a significantly lower percentage of GZMB+CD8+ T cells among total CD8+ T cells compared to Klf4-non-KO tumors (Fig. 2l and Supplementary Fig. 3g). Thus, KLF4 appears necessary to maintain MHC class I level and CD8⁺ T cell-dependent immune pressure; its loss may promote immune evasion and ESCC progression.
Fig. 2
KLF4-deficiency reduces MHC class I expression to facilitate immune evasion in ESCC. KLF4/Klf4 knockout (KO) significantly suppressed surface MHC class I expression in human (a, b) and mouse (c) ESCC cell lines. Ctrl, KO control; MFI, mean fluorescence intensity. (d) KLF4 overexpression (OE) significantly enhanced surface MHC class I expression in human ESCC cells. Klf4 KO significantly suppressed surface MHC class I expression (e) and H-2Kb: OVA (f) in OVAL-expressing mEC25 cells. g Schematics of OT-I mouse naive CD8+ T cell activation by SIINFEKL peptide (5 μg/mL) and IL-2 (10 ng/mL) and cocultivation with OVA+ mEC25 cells labeled with green fluorescent protein (GFP). h Klf4 KO significantly prevented mEC25 cells from CD8+ T cell killing in vitro. i mEC25 cell Klf4 KO significantly inhibited the formation of IFN-γ,+ GZMB+ and TNF-α+ CD8+ T cells in the cocultured OT-I T cells in vitro. j Experimental design for examining the impact of CD8+ T cell depletion on murine allograft tumors growth. k Klf4 KO significantly enhanced mEC25-derived allograft tumor growth in mice without CD8+ T cell depletion, but it had no impact on tumor growth in CD8+ T cell depleted mice. Left: tumor growth curves; right: tumor images at the experiment end. αCD8β, anti-CD8β monoclonal antibody. l The results of multiplex immunofluorescence analysis of tumor tissues from mice without CD8+ T cell depletion (treated with IgG). Left: representative multiplex immunofluorescence images; right: significant differential levels of the interested molecules between Klf4-KO tumor and Klf4-non-KO tumor. HPF, high-power field. Scale bar, 250 μm. The left panels of (a−f) show flow cytometry images, and the right panels show quantitative statistics. Data in (a−f, h, i) are mean ± SEM from three independent experiments. Data in (k, l) are mean ± SEM from 5 allograft tumors. Statistical significance in this figure was determined by Student’s t test. *, P < 0.05, **, P < 0.01, ***, P < 0.001, ****, P < 0.0001 and ns, not significant
Since MHC class I is required and important in cancer immunity, we next wanted to explore whether the KLF4-MHC class I axis may also play a role in various tumor types other than ESCC. We knocked down KLF4 expression in multiple human cell lines, including NCI-H1299 (lung cancer), HepG2 (liver cancer) and JF-305 (pancreatic cancer). Interestingly, all these cancer cell lines with KLF4 silenced by small-interfering RNA (siRNA) had significantly reduced MHC class I expression levels compared with controls (Supplementary Fig. 4a–4c). Conversely, Klf4 overexpression in murine MC38 (colorectal cancer) and B16F10 (melanoma) cells significantly increased the level of MHC class I (Supplementary Fig. 4d, 4e). We then generated both Klf4 and OVAL overexpressing MC38 cells and B16F10 cells (Supplementary Fig. 4f–4i) and observed that upon coculture with OT-I CD8+ T cells, these double-overexpressing cancer cells were killed more efficiently than control cells (Supplementary Fig. 4j, 4k). Meanwhile, OT-I CD8+ T cells cocultured with both Klf4 and OVAL overexpressing cancer cells generated significantly higher frequencies of IFN-γ⁺, GZMB⁺ and TNF-α⁺ CD8⁺ T cells, relative to those cocultured with control cancer cells (Supplementary Fig. 4l, 4m).
We next turned to immunocompetent mouse allograft models using MC38 and B16F10 cells to examine the in vivo relevance of these findings in other cancer type models. Interestingly, overexpressing Klf4 markedly suppressed MC38- and B16F10-derived tumor growth in mice; however, this effect could be completely abrogated by depleting mouse CD8+ T cells (Supplementary Fig. 5a, 5b). Flow cytometric analysis of tumor tissues demonstrated that Klf4 overexpressed allograft tumors produced a coordinated immunogenic response, i.e., significantly elevated MHC class I expression on tumor cells, which in turn resulted in increased infiltration of CD8+ T cells relative to allograft tumors derived from Klf4 non-overexpressed cancer cells (Supplementary Fig. 5c–5f). The immunofluorescent analysis results of tumor tissues were consistent with the flow cytometric analysis results and further confirmed an expanded population of cytotoxic GZMB+CD8+ T cells in Klf4-overexpressed tumors compared to Klf4 non-overexpressed tumors (Supplementary Fig. 5g, 5h). Collectively, these experimental results from ESCC and other cancer models suggest that KLF4 may be a conserved regulator of MHC class I-mediated tumor immunity across multiple cancer types.
KLF4 is crucial in enhanceosome complex formation and MHC class I transcription activation
We next explored how KLF4 mediates MHC class I expression at the molecular level. We found that in all investigated human and mouse cell lines, KLF4/Klf4 KO or knockdown (KD) significantly reduced MHC class I expression at both transcript and total protein levels (Supplementary Fig. 6a–6e) but KLF4/Klf4 overexpression had opposite effects (Supplementary Fig. 6f–6h), suggesting that KLF4 regulates MHC class I expression at the transcriptional level. We analyzed the publicly available ChIP-seq and ATAC-seq data48 and the data indicated that KLF4 does not directly bind to the HLA-A/B/C promoter regions (Supplementary Fig. 6i) but KLF4 overexpression enhanced the chromatin accessibility at these loci (Supplementary Fig. 6j); however, KLF4 KD had the converse results (Supplementary Fig. 6k). Notably, these chromatin regions located within 300-bp upstream of the transcription start site, encompassing enhancer A (NF-κB-responsive) and the enhanceosome complex, both are critical for MHC class I transcription.49,50,51 Since KLF4 is known to interact with RELA to activate NF-κB signaling,52,53 which can regulate MHC class I expression,54,55 we focused particularly on the less-characterized enhanceosome complex for examining KLF4-mediated regulation of MHC class I.
Previous reports indicate that KLF4 can interact with CREB,56,57 a transcription factor that can form a heterodimer with ATF1 to perform its transcriptional activity.58,59,60,61 We first excluded the possibility that changes in KLF4 expression alter CREB and ATF1 protein levels (Supplementary Fig. 6l, 6m) and thus hypothesized that KLF4 might interact with CREB/ATF1, the core components of the complex. To test this, we performed reciprocal co-immunoprecipitation assays, and the results demonstrated physical interactions among these 3 proteins (Fig. 3a–c). We also conducted immunofluorescence staining and further confirmed that these 3 proteins co-localize in the nuclei of multiple cancer cells (Fig. 3d, e). More importantly, knockdown of CREB1 or ATF1 in KLF4-overexpressed KYSE410, MC38 and B16F10 cells, in which the KLF4 level was high, significantly diminished the levels of both total and surface MHC class I in these cells (Fig. 3f–k). Together, these findings imply that KLF4 may serve dual functions in regulating MHC class I transcription, i.e., maintaining chromatin accessibility at the promoter regions and facilitating the enhanceosome complex formation via recruitment of CREB/ATF1.
Fig. 3
KLF4 is crucial in enhanceosome complex formation and MHC class I transcription activation. Reciprocal co-immunoprecipitation (IP) products obtained with anti-KLF4 (a), anti-CREB (b) or anti-ATF1 (c) antibody in various cell lines were analyzed by immunoblot (IB) and showed the interactions among these three proteins. Immunofluorescence staining analysis showing nuclear co-localization of KLF4 with CREB (d) and ATF1 (e) in various cell lines. DAPI counterstaining was applied to visualize nuclei. Scale bar, 20 μm. Western blot (f, h, j) and flow cytometry (g, i, k) analyses show that KLF4/Klf4 overexpression (OE) significantly enhances expression levels of MHC class I, which can be suppressed via knockdown (KD) of CREB1/Creb1 or ATF1/Atf1. The left panels of (g, i, k) are images of flow cytometry, and the right panels show quantitative statistics. MFI, mean fluorescence intensity. Data in (g, i, k) are mean ± SEM from three independent experiments. Statistical significance in this figure was determined by Student’s t test. ****, P < 0.0001
Pharmacological Induction of KLF4 enhances antigen presentation and anticancer immunity
Based on the results described above, we examined whether pharmacologically inducing KLF4 may rescue KLF4 loss-caused antigen presentation and CD8+ T cell-mediated anticancer immunity. To do this, we utilized APTO-253, a small molecule KLF4 inducer that has completed Phase I clinical trials with a favorable safety profile.62 We found that APTO-253 treatment robustly upregulated KLF4 and MHC class I transcripts as well as protein levels in a range of human cancer cell lines, including ESCC (KYSE150 and KYSE450), lung adenocarcinoma (NCI-H1299), hepatocellular carcinoma (HepG2) and pancreatic cancer (JF-305). Notably, surface MHC class I expression was also significantly enhanced (Figs. 4a–c and Supplementary Fig. 7a–7l). Consistent effects were also observed in OVA-expressed mouse cancer cells such as mEC25, MC38 and B16F10 cells (Figs. 4d–f and Supplementary Fig. 7m–7r). Furthermore, coculture experiments showed that APTO-253-treated OVA+ cancer cells (mEC25, MC38 and B16F10) were killed more efficiently by OT-I CD8+ T cells as indicated by increased cancer cell death and higher percentages of IFN-γ,+ GZMB,+ and TNF-α+ CD8+ T cells among OT-I CD8+ T cells (Figs. 4g–i and Supplementary Fig. 7s–7v). Thus, our in vitro data suggest that APTO-253 may augment the tumor-killing functions of CD8+ T cells.
Fig. 4
APTO-253 activates KLF4/MHC class I axis to potentiate CD8+ T cell immunity in ESCC. RT-qPCR (a), western blot (b) and flow cytometry (c) analyses show that KLF4 activator APTO-253 (10 μM) significantly induces KLF4 and MHC class I expression in human ESCC cells. MFI, mean fluorescence intensity. Western blot (d) and flow cytometry (e, f) analyses show that APTO-253 (10 μM) significantly induces expression of KLF4 (d), MHC class I (d, e) and H-2Kb:OVA (f) in OVAL-expressing mEC25 cells. g Schematics of OT-I mouse naive CD8+ T cell activation by SIINFEKL peptide (5 μg/mL) and IL-2 (10 ng/mL) and cocultivation with green fluorescent protein (GFP) labeled OVA+ mEC25 cells that had been pre-treated with APTO-253 (10 μM) for 36 hours. h APTO-253 significantly enhanced CD8+ T cells-dependent killing of OVA+ mEC25 cells in vitro. i mEC25 cells pre-treated with APTO-253 significantly enhanced the formation of IFN-γ,+ GZMB+ and TNF-α+ CD8+ T cells among the cocultured OT-I T cells in vitro. j Experimental design for examining the effect of APTO-253 on allograft tumor growth in mice. k APTO-253 significantly inhibited the growth of mEC25-derived allograft tumor in mice. Left: tumor growth curves; right: tumor images at the experiment end. l The results of multiplex immunofluorescence analysis of tumor tissues from mice. Left: representative multiplex immunofluorescence images; right: significant differential levels of the interested molecules between vehicle and APTO-253-treated mEC25-derived allograft tumors. HPF, high-power field. Scale bar, 250 μm. The left panels of (c, e, f) show flow cytometry image, and the right panels show quantitative statistics. Data in (a, c, e, f, h, i) are mean ± SEM from three independent experiments. Data in (k, l) are mean ± SEM from 5 allograft tumors. Statistical significance in this figure was determined by Student’s t test. *, P < 0.05, **, P < 0.01, ***, P < 0.001 and ****, P < 0.0001
Using immunocompetent C57BL/6 J mice bearing allograft tumors, we found that APTO-253 administration markedly suppressed tumor growth compared with control (Figs. 4j, k and Supplementary Fig. 8a, 8b). Flow cytometric analysis of tumor tissues revealed that APTO-253 treated tumors, relative to controls, had significantly upregulated MHC class I on CD45⁻ cells and significantly enhanced intratumoral infiltration of CD8+ T cells (Supplementary Fig. 8c–8h). Multiplex immunofluorescence analysis also corroborated these findings. In APTO-253 treated tumors, we detected higher KLF4 and MHC class I levels on cancer cells, as well as increased numbers of CD8+ T cells and GZMB⁺ cytotoxic CD8+ T cells within the tumor microenvironment relative to controls (Fig. 4l and Supplementary Fig. 8i, 8j). These results suggest that KLF4 induction by APTO-253 improves MHC class I antigen presentation, which in turn triggers CD8+ T cell-dependent anticancer immunity.
KLF4 is a predictive biomarker and target for immune checkpoint blockade therapy
Since APTO-253 enhances CD8+ T cell-mediated anticancer immunity, we asked if APTO-253 might increase the treatment response to anti-PD-1 antibody (αPD-1). Immunocompetent mice bearing allografts from mEC25, MC38 or B16F10 cells received treatment of αPD-1 plus APTO-253. We found that both APTO-253 and αPD-1 significantly suppressed the tumor growth compared with control; however, APTO-253 and αPD-1 combination treatment had superior anticancer activity compared with APTO-253 or αPD-1 treatment alone (Figs. 5a, b, and Supplementary Fig. 9a, 9b). Flow cytometric analysis of allograft samples revealed that APTO-253 alone or in combination with αPD-1 robustly upregulated MHC class I expression levels on CD45− cells. Moreover, the allograft tumors treated with αPD-1 plus APTO-253 had substantially greater infiltration of CD8+ T cells compared to those treated with αPD-1 alone (Figs. 5c, d and Supplementary Fig. 9c–9f). Multiplex immunofluorescence analysis revealed that the combined treatment significantly increased the proportion of GZMB+CD8+ T cells within the tumor-infiltrating CD8+ T cell population relative to single drug treatments (Supplementary Fig. 9g, 10a and 10b). These results suggest that KLF4 inducer APTO-253 had a significantly synergistic effect on αPD-1 efficacy in treating allograft tumors in mice.
Fig. 5
Targeting KLF4 enhances anti-PD-1 efficacy and predicts treatment response in cancers. a Experimental design for examining the effect of APTO-253 and αPD-1 combination treatment on mEC25-derived allograft tumors growth in mice. b The combined administration of APTO-253 and αPD-1 demonstrated the most pronounced inhibition of mEC25 derived allograft tumor growth compared to APTO-253 or αPD-1 treatment alone. Left: tumor growth curves; right: tumor images at the experiment end. αPD-1, anti-PD-1 monoclonal antibody. c Flow cytometric analysis shows elevated surface expression of MHC class I on CD45 negative cells in mEC25 derived allograft tumor following treatment with APTO-253 alone or in combination with αPD-1. d Flow cytometric analysis shows significantly more CD8+ T-cell infiltration in mEC25 derived allograft tumor following APTO-253 and αPD-1 combination treatment. e, f Violin plots show esophageal squamous cell carcinoma (ESCC) samples responding to immunotherapy from two cohorts exhibit higher KLF4 RNA expression (left panel) and antigen processing/presentation pathway scores (right panel) compared with non-responders. g Spatial transcriptomic visualization of distribution of hepatocellular carcinoma cells, fibroblast/immune cells and cholangiocytes (left) and epithelial KLF4 RNA expression (right) in non-responder and responder. Violin plot shows hepatocellular carcinoma cells from samples responding to immunotherapy exhibit higher KLF4 RNA expression compared to non-responders. h Violin plots comparing KLF4 RNA levels between non-responders and responders in multiple cancer types, including non-small cell lung cancer (NSCLC), gastric cancer (GC), colorectal cancer (CRC), melanoma, and head and neck squamous cell carcinoma (HNSCC). i ROC curve analysis comparing predictive performance of KLF4/MHC I gene signature and PD-L1 for immunotherapy response prediction across multiple cancer types. Data in (b−d) are mean ± SEM from 5 allograft tumors. Statistical significance in this figure was determined by Wilcoxon rank-sum test, except for (b–d), where Student’s t test was applied. *, P < 0.05, **, P < 0.01, ***, P < 0.001, ****, P < 0.0001 and ns, not significant
Finally, we assessed how KLF4 levels in tumors correlate with clinical response of patients to immune checkpoint blockade (ICB) therapy. First, we examined two public scRNA-seq datasets of ESCC samples taken prior to ICB plus platin/paclitaxel neoadjuvant chemo-immunotherapy that meet our requirements63,64 and the results showed that responders (N = 3 and N = 8, respectively) had significantly higher KLF4 RNA levels and antigen processing/presentation scores within their cancer cells relative to non-responders (N = 4 and N = 4, respectively) (Figs. 5e, f). Beyond ESCC, we further explored whether the association between KLF4 and ICB response might also exist in other cancer types. Analysis of a spatial transcriptomic dataset of liver cancer samples obtained before ICB therapy65 showed that responders to the therapy had significantly higher KLF4 RNA levels in cancer cells than non-responders (Fig. 5g). We then extended our analysis to additional public scRNA-seq datasets from non-small cell lung cancer (N = 7),66 gastric cancer (N = 5),67 colorectal cancer (N = 10),68 melanoma (N = 20)69 and head and neck carcinoma (N = 20).70 In each case, cancer cells in responders had significantly higher KLF4 RNA expression levels compared with cancer cells in non-responders (Fig. 5h). Moreover, the KLF4/MHC class I expression signature showed predictive performance that was superior to the PD-L1 level for immunotherapy response across multiple cancer types (Fig. 5i), suggesting that KLF4 could serve as a pan-cancer biomarker to predict ICB response and as a potential therapeutic target.
KLF4 deficiency is caused by its promoter hypermethylation and copy number loss
We next explored why KLF4 is progressively downregulated during tumorigenesis and progression of ESCC, which was observed in both present and our previous studies.44 By reanalyzing the whole-genome sequencing data of multi-stage ESCC samples,71 we found that significant KLF4 copy number reduction occurred in HGIN samples, but the copy number reduction was significantly prevalent only in the status of TP53 biallelic loss but not in the status of TP53 mutations (Figs. 6a, b). These results suggest that during the ESCC development, TP53 biallelic loss may cause KLF4 copy number deletion but TP53 mutations have limited effect on KLF4 expression. We therefore asked if the gradual downregulation of KLF4 expression during ESCC progression results from epigenetic mechanisms, specifically, promoter DNA methylation. By analyzing our previously published dataset,44 we found that HGIN and ESCC samples had significantly increased methylation levels within the 1,000 base-pair regions upstream of the KLF4 transcription start site compared to NOR and LGIN samples (Fig. 6c). Meanwhile, we downloaded and analyzed the methylome and transcriptome data from The Cancer Genome Atlas (TCGA) for the common digestive system cancers, including esophageal (ESCA), gastric (STAD), colorectal (COAD and READ), biliary (CHOL), hepatic (LIHC) and pancreatic (PAAD).72 Specifically, we identified significantly higher KLF4 promoter methylation levels in colon cancer, cholangiocarcinoma and hepatocellular carcinoma relative to matched normal tissues (Fig. 6d) but not in the rest tumor types. However, across all investigated tumor types, KLF4 RNA levels showed a strong negative correlation with its promoter methylation levels (Fig. 6e). We then treated several cancer cell lines with the demethylase inhibitor Bobcat339. This treatment led to a time-dependent decrease in both KLF4 RNA and protein expression levels (Fig. 6f–k). Together, these results indicate that the downregulation of KLF4 in the digestive system cancers may be caused by both genetic and epigenetic alterations in the formation and development of the cancers.
Fig. 6
KLF4 downregulation in ESCC is associated with TP53 biallelic loss and KLF4 promoter hypermethylation. a Boxplots show KLF4 copy number of human esophageal samples across pathological stages, normal epithelium (NOR, n = 22), low-grade intraepithelial neoplasia (LGIN, n = 9), high-grade intraepithelial neoplasia (HGIN, n = 7) and esophageal squamous cell carcinoma (ESCC, n = 4). b Boxplots showing KLF4 copy number in human esophageal samples with TP53 wild type (WT, n = 35), single mutation (1, n = 24), multiple mutations (>1, n = 8) or loss of heterozygosity (LOH, n = 12). c Boxplots showing DNA methylation levels in the KLF4 promoter of human esophageal samples across the different pathological stages, including NOR (n = 86), LGIN (n = 14), HGIN (n = 21) and ESCC (n = 60). d KLF4 promoter CpG methylation levels between normal and tumor samples of digestive system cancers reported in the TCGA, including esophageal (ESCA, n = 16 and 185), gastric (STAD, n = 2 and 395), colon (COAD, n = 38 and 306), rectal (READ, n = 7 and 98), bile duct (CHOL, n = 9 and 36), liver (LIHC, n = 50 and 377) and pancreatic (PAAD, n = 10 and 184) cancers. e Spearman correlation of KLF4 RNA levels with KLF4 promoter CpG methylation levels in ESCA (n = 201), STAD (n = 397), COAD (n = 344), READ (n = 105), CHOL (n = 45), LIHC (n = 427) and PAAD (n = 194). Shade areas represent 95% confidence interval. (f−k) The demethylase inhibitor Bobcat339 (B.339, 70 μM) suppressed both KLF4 RNA and protein expression levels in multiple cancer cell lines detected by RT-qPCR (upper panel of each figure) and western blot (lower panel of each figure). Data in (f−k) are mean ± SEM from three independent experiments. Statistical significance in this figure was determined by Wilcoxon rank-sum test, except for (f–k), where Student’s t test was applied. *, P < 0.05, ***, P < 0.001 and ****, P < 0.0001
