


Biological profiling of PSMA expression reveals lipolytic metabolic reprogramming in prostate cancer
To investigate the biological role of PSMA in prostate cancer, we initially performed in silico analyses of publicly available TCGA-PRAD transcriptomics data [24], stratifying tumour samples (n = 497) based on the expression levels of FOLH1, encoding PSMA, into high and low groups (Supplementary Fig. S1a). Differential gene expression analysis revealed hierarchical clustering of FOLH1 high and low groups into two distinct entities (Supplementary Fig. S1b). Significant alterations in the transcriptome associated with high FOLH1 expression were identified for 652 differentially expressed genes (240 upregulated, 412 downregulated). Functional enrichment analysis of these genes uncovered significant gene set enrichment in a variety of pathways related to cell adhesion and signalling (Supplementary Fig. S1c). Notably, “Fatty Acid Oxidation” exhibited the highest enrichment ratio, suggesting a potential metabolic reprogramming linked to high FOLH1 expression in prostate cancer.
Due to the involvement of the PSMA substrate folate as an essential co-factor in the one-carbon metabolism, which is the basis for the generation of the methyl-donor S-adenosylmethionine, we next examined DNA methylation profiles in the same tumour subsets. This revealed a significantly elevated global methylation level in the FOLH1-high group (Supplementary Fig. S1d), with 661 specific CpG sites exhibiting differential methylation (Supplementary Fig. S1e). Together, these findings suggest that high FOLH1 expression in prostate cancer is associated with both significant transcriptional and epigenetic reprogramming.
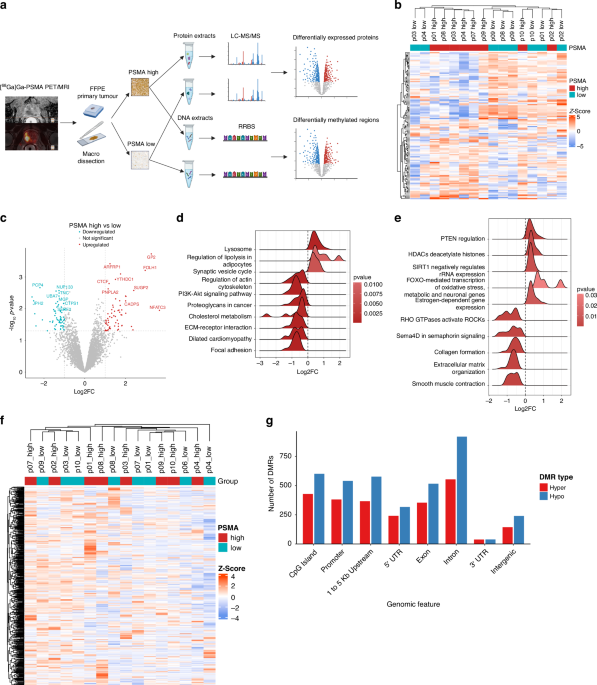
To extend these findings through exploratory proteomic and epigenetic profiling in our own patient cohort, we utilised radical prostatectomy specimens from 10 patients with locally advanced prostate cancer (Gleason score 8 and 9) and lymph node involvement (Supplementary Table 1). Patient selection was guided by retrospective analysis of [68Ga]Ga-PSMA-PET imaging data of patients with heterogenous PSMA-PET signals, indicative of high and low PSMA-expressing areas within their primary prostate tumour. Label-free liquid chromatography-tandem mass spectrometry (LC-MS/MS) and reduced representation bisulfite sequencing (RRBS) were then performed to compare protein expression and DNA methylation of PSMA-high versus PSMA-low areas from within the same specimen, determined by PSMA immunohistochemistry (IHC) (Fig. 1a). In two out of ten cases, we were unable to confidently identify areas of low PSMA expression by IHC these samples were excluded from the proteomics analysis. The proteomics approach identified 4473 proteins across all samples, with 3109 proteins shared between all samples analysed (Supplementary Fig. S2a). Differential expression analysis revealed 127 significantly differentially regulated proteins (P < 0.05, absolute Log2FC > 1), with PSMA (FOLH1) among the top deregulated proteins, validating our approach (Fig. 1b, c, and Supplementary Table 3). Gene Set Enrichment Analysis (GSEA) highlighted a significant upregulation of lysosomal and vesicle-associated KEGG pathways as well as lipolysis in PSMA-high areas, corroborating our in silico findings (Fig. 1d). Moreover, both KEGG and REACTOME pathway analysis highlighted a downregulation of genes associated with extracellular matrix (ECM) organisation and collagen formation (Fig. 1d, e). Notably, a deregulation of PTEN regulation and PI3K-Akt signalling was evident in PSMA-high tumour areas, alongside other deregulated transcriptional pathways. Together, these data suggest that PSMA-high tumour areas show differences in their metabolic characteristics, ECM remodelling and tumour signalling compared to PSMA-low areas within the same patient.
Fig. 1: Proteomic and epigenetic profiling of differential PSMA-associated prostate tumor areas.
a Experimental workflow for proteomic and DNA methylation analysis of patient-matched PSMA-high and -low prostate tumor areas. b Unsupervised clustering of significantly differentially expressed proteins (DEPs; absolute Log2FC > 1, P < 0.05) in PSMA-high vs. PSMA-low tumor areas. The heatmap represents Z-score normalized values with blue indicating low and red indicating high expression values. c Volcano plot of DEPs. Red points indicate significantly upregulated proteins in PSMA-high areas; blue points indicate significantly downregulated proteins (absolute Log2FC > 1, P < 0.05). Ridge plots visualizing the distribution of absolute expression Log2FC (x-axis) for core-enriched proteins within selected KEGG (d) and REACTOME (e) pathways identified by GSEA. The shape of each ridge represents the density distribution, indicating the frequency of proteins at specific Log2FC values within a given pathway. f Unsupervised hierarchical clustering of the top 1000 differentially methylated CpGs of PSMA-high and -low tumor areas identified by reduced representation bisulfite sequencing (RRBS). The heatmap represents Z-score normalised methylation values with red indicating hypermethylated and blue hypomethylated CpGs. g Distribution of differentially methylated regions (DMRs) according to genomic annotations between PSMA-high and low tumor areas. Bars represent the number of hypermethylated (red) and hypomethylated (blue) DMRs identified across various genomic features as indicated on the x-axis.
For DNA methylation analysis based on RRBS, quality control filtering due to insufficient DNA yield led to the exclusion of three samples. In line with TCGA-PRAD methylation data analysis, PSMA-high samples exhibited a trend towards higher global DNA methylation levels, although this was not statistically significant (P = 0.65; Supplementary Fig. S2c). Hierarchical clustering based on the top 1000 differentially methylated loci (DML) did not reveal a clear separation between PSMA-high and -low tumour areas (Fig. 1f). However, differentially methylated region (DMR) analysis identified 2238 DMRs between the PSMA-high and low groups (Supplementary Table 4). Analysis of the genomic distribution of these DMRs revealed a predominant enrichment within promoter regions including 1–5 kb upstream of the transcription start site and intronic regions (Fig. 1g).
Integrated proteomic and epigenomic analysis identifies ATGL as a key PSMA-associated lipolytic enzyme
To further refine our focus on biologically relevant proteins and identify those with convergent epigenetic regulation, we integrated our proteomics and RRBS datasets. Initial correlation analysis between protein expression changes and DMR methylation within gene bodies or promoters yielded no significant associations (Fig. 2a). However, by identifying the overlap between significantly differentially expressed proteins (P < 0.05) and genes harbouring promoter-associated DMRs, we pinpointed 16 candidate proteins (Fig. 2b). This list included ATGL, encoded by the PNPLA2 gene. Notably, the PNPLA2 locus showed a clear hypomethylation pattern in its promoter CpG island in PSMA-high samples, providing epigenetic support for ATGL protein overexpression (Fig. 2c).
Fig. 2: Integrative analysis highlights ATGL upregulation and promoter hypomethylation in PSMA-high prostate cancer.
a Scatter plots showing the absence of significant correlations between protein expression changes and DNA methylation levels within promoters (top) or gene bodies (bottom) of differentially expressed proteins (DEP). b Venn diagram illustrating the overlap between significantly differentially expressed proteins (P < 0.05) and genes harboring promoter-associated differentially methylated regions (DMRs), highlighting 16 overlapping proteins. c UCSC genome browser view of the PNPLA2 locus, encoding for ATGL protein. Tracks show Refseq gene annotation (blue), CpG islands downloaded from UCSC (green), DMRs (purple), and β-value differences for individual CpG sites (DMLs, turquoise).
Independent cohort validates strong PSMA-ATGL correlation and identifies links to clinicopathological and metabolic features
To validate the correlation between PSMA and ATGL protein expression in a larger, independent patient cohort, we generated tissue microarrays (TMAs) of treatment-naïve primary prostate cancer samples of intermediate Gleason scores (3+4, 4+3, and 4+4) (n = 93; Supplementary Table 2). Due to the absence of tumour tissue in TMA cores from 3 patients, the final analysis included 90 patient samples. PSMA showed a balanced IHC staining score, while ATGL expression was predominantly expressed at lower levels across all samples (Supplementary Fig. S3a, b). However, in line with our proteomics data, we observed a robust positive correlation between ATGL and PSMA protein expression in the TMA cohort (r = 0.74, P < 0.0001; Fig. 3a, b), validating our initial findings in a clinically relevant patient group.
Fig. 3: Validation of PSMA-ATGL protein co-expression and associations with clinicopathological and biological markers in an independent prostate cancer cohort.
a Scatter plot and linear regression line depicting the robust positive correlation between ATGL and PSMA protein expression H-scores in the tissue micro-array (TMA) cohort (n = 90). b Representative IHC staining images illustrating high (left, patient 89) and low (right, patient 33) ATGL (top) and PSMA (bottom) protein expression in TMA cores. Black arrowheads indicate representative tumour glands with strong specific (left) and negative (right) ATGL stain. c Heatmap visualizing the Pearson correlation matrix for all investigated variables in the TMA cohort. Color scale indicates the Pearson correlation coefficient, ranging from strong positive (red) to strong negative (blue). Circle size indicates absolute strength of correlation. GS (Gleason Score), BPH (benign prostate hyperplasia medication e.g. 5-alpha reductase inhibitors), BB (beta blockers), ASA (acetylsalicylic acid), LL (lipid-lowering drugs e.g. statins), HbA1c (glycated haemoglobin – serum marker for average blood glucose levels for the three months prior to prostatectomy), Chol (pre-operative serum cholesterol level), Trigly (pre-operative serum triglyceride level.
Next, we correlated PSMA and ATGL protein expression with molecular and clinicopathological patient data including Gleason score and T-stage, metabolic blood markers, or medication history, as well as IHC staining for specific candidate genes (Fig. 3c, and Supplementary Fig. S3c–f). PSMA expression was similar in the three Gleason Score groups, but as expected, showed significantly higher expression in T3 compared to T2 stage tumours (P = 0.011) (Supplementary Fig. S3c). On the other hand, ATGL expression was significantly higher in Gleason 4 + 4 tumours compared to Gleason 3+4 tumours (P = 0.038), but showed only a tendency of higher expression in T3 stage samples (P = 0.347) (Supplementary Fig. S3d).
To explore potential metabolic links, we analysed associations between PSMA and ATGL protein expression and serum metabolic markers. A negative correlation trend was observed between serum triglyceride levels and PSMA expression (r = −0.21, P = 0.517; Supplementary Fig. S3e) as well as ATGL expression (r = −0.27, P = 0.473; Supplementary Fig. S3e). Notably, ATGL expression demonstrated a statistically significant positive correlation with serum cholesterol levels (r = 0.22, P = 0.020; Supplementary Fig. S3f). No associations of PSMA and ATGL expression with different medications, including lipid-lowering or antidiabetic drugs, were detected (Fig. 3c). Moreover, expression levels of the proliferation marker Ki-67, c-MYC or hormone-sensitive lipase (HSL), the second enzyme in the lipolytic cascade with primary diglyceride but also triglyceride hydrolase activity, were unrelated to PSMA and ATGL expression. We also measured PGM1 expression as a surrogate of tumour-associated macrophage infiltration, which was associated with Ki-67 expression, but showed no correlation with PSMA or ATGL. Interestingly, we observed weak positive correlations between age and both PSMA (r = 0.21, P = 0.026) and ATGL (r = 0.25, P = 0.012) protein expression levels. Together, these data suggest correlative associations between serum lipid profiles and tumoral ATGL expression, with lower triglyceride and higher cholesterol levels observed in patients with ATGL-high prostate cancer. However, as serum metabolite levels are influenced by numerous systemic factors including diet, lifestyle, and comorbidities that were not controlled for in this retrospective analysis, these associations should not be interpreted as direct surrogates for tumour-intrinsic metabolic activity.
In vitro metabolic characterization reveals distinct fuel utilization and flexibility profiles
To dissect the functional role of ATGL in prostate cancer in more detail, we sought to identify suitable cell line models by characterising ATGL and PSMA protein expression across a panel of seven prostate cancer cell lines and one non-neoplastic prostate epithelial cell line (RWPE1). Western blot analysis revealed a diverse range of expression levels for both PSMA and ATGL across the cells tested (Fig. 4a). PSMA protein expression was highest in LNCaP, LAPC4, and 22RV1 cells, whereas ATGL protein expression was elevated in LNCaP, DUCaP, and VCaP cells. Notably, this analysis did not reveal a consistent correlation between PSMA and ATGL protein expression levels, probably due to their mainly metastatic origin or their metabolic adaptation in vitro.
Fig. 4: In vitro metabolic profiling of prostate cancer cell lines.
a Western blot analysis of PSMA and ATGL protein expression across a panel of prostate cancer cell lines and the non-neoplastic prostate epithelial cell line RWPE1. GAPDH was used as a loading control. b Triglyceride hydrolase activity assay in prostate cancer and RWPE1 cell lines. Cell lysates were incubated with vehicle control (Control) or 20 µM NG-497 for 1 h (NG-497). Released fatty acids (nmol/hour) per mg of protein are shown. Data represent mean ± SEM (n = 3). Statistical significance was determined by unpaired t-test (*P < 0.05, **P < 0.01, ***P < 0.001 vs. vehicle control within each cell line). c Relative dependency on glucose (Gluc), glutamine (Glut), and fatty acid (FA) oxidation in selected prostate cancer cell lines as determined by Seahorse XF Mito Fuel Flex Test assay. d Fuel flexibility of selected prostate cancer cell lines, representing the percentage maximal compensatory increase in oxygen consumption rate (OCR) upon inhibition of alternative fuel pathways as determined by Seahorse XF Mito Fuel Flex Test assay.
To directly assess ATGL enzymatic activity and the impact of its pharmacological inhibition, we employed a triglyceride hydrolase activity assay measuring the release of fatty acids from radioactively labelled triglycerides following incubation with cell lysates. Treatment with the ATGL inhibitor NG-497 resulted in significant inhibition of triglyceride hydrolase activity across multiple prostate cancer cell lines, including LNCaP, VCaP, PC3, 22RV1, and DUCaP cells (P < 0.05; Fig. 4b), confirming the efficacy of ATGL inhibition in these models.
Based on these initial findings and considering the combinatorial diversity of PSMA and ATGL expression profiles, we selected four cell lines for subsequent metabolic analyses: LNCaP (PSMA-high, ATGL-high), 22RV1 (PSMA-high, ATGL-low), PC3 (PSMA-negative, ATGL-high), and DU145 (PSMA-negative, ATGL-low). To assess the influence of growth media on ATGL activity and protein expression, we cultured these four cell lines in human plasma like medium (HPLM), which more closely mimics physiological glucose levels compared to standard RPMI-1640 medium (Supplementary Methods Fig. 2). Culturing cells in HPLM did not significantly alter ATGL activity and response to NG-497 (Supplementary Fig. S4a), or PSMA, ATGL, HSL and ABHD5 protein expression levels, although c-MYC protein expression was consistently upregulated in HPLM conditions (Supplementary Fig. S4b).
Next, we quantified the basic metabolic profiles of the selected cell lines, including their fuel dependency and metabolic flexibility using Seahorse XF Mito Fuel Flex Test assays. Analysis of baseline OCR revealed that LNCaP and 22RV1 cells exhibited over twofold higher baseline respiration rates compared to PC3 and DU145 cells (Supplementary Fig. S4c). Fuel dependency analysis indicated that LNCaP and 22RV1 cells exhibited a marked dependency on fatty acid oxidation, with 22RV1 cells displaying a similar dependency on glucose (Fig. 4c). Conversely, PC3 and DU145 cells were primarily dependent on glucose to maintain baseline respiration. Regarding metabolic flexibility, which indicates the capacity of cells to increase the oxidation of one fuel when alternative pathways are inhibited, 22RV1 cells displayed high flexibility across all fuel pathways, suggesting metabolic adaptability (Fig. 4d). In contrast, both LNCaP and DU145 cells showed very limited metabolic flexibility, while PC3 cells exhibited intermediate flexibility primarily towards glucose.
In summary, metabolic profiling of the selected cell lines revealed distinct fuel utilisation patterns, with LNCaP and 22RV1 cells exhibiting high baseline mitochondrial respiration driven by fatty acid oxidation in contrast to the glucose-centric metabolism of PC3 and DU145.
LNCaP cells exhibit enhanced vulnerability to the ATGL inhibitor NG-497 and ATGL knockdown
Having confirmed an inhibitory effect of NG-497 on ATGL activity, we assessed its impact on cell proliferation across our panel of cell lines (Fig. 5a). LNCaP cells displayed marked sensitivity to NG-497, with a low IC50 value of 2.2 µM, indicating high vulnerability to ATGL inhibition. In contrast, PC3, 22RV1, and DU145 cells exhibited significantly greater resistance, with IC50 concentrations of 51 µM, 27 µM, and >80 µM (not reached within the tested concentration range), respectively. To elucidate potential mechanisms underlying the differential sensitivity to ATGL inhibition, we assessed the impact of NG-497 and the PSMA inhibitor 2-(Phosphonomethyl)pentanedioic acid (2-PMPA) on the expression of ATGL, PSMA, and PSMA-dependent PI3K-Akt signalling (Fig. 5b). Following treatment with NG-497 at IC50 concentrations, western blot analysis revealed consistent upregulation of ATGL in PC3, 22RV1 and DU145 cells, suggesting a compensatory response to ATGL inhibition. LNCaP cells, which expressed high levels of ATGL at baseline, maintained stable ATGL expression across all conditions. Treatment with the PSMA inhibitor 2-PMPA had no effect on ATGL expression, neither as a single agent nor in combination with NG-497. Moreover, PSMA protein expression remained unaffected by single and combined treatments in PSMA-positive LNCaP and 22RV1 cells, while no PSMA expression was detected in PSMA-negative PC3 and DU145 cells within the different conditions. AKT phosphorylation appeared to be slightly reduced upon single NG-497 treatment and in combination with 2-PMPA in PTEN-negative LNCaP and PC3 cells. In PTEN-positive cells, pAKT remained undetectable in all conditions.
Fig. 5: ATGL inhibition by NG-497 selectively impairs viability and induces lipid accumulation.
a NG-497 dose-viability curves for selected prostate cancer cell lines, as determined by CyQUANT® Cell Proliferation Assay after 72 h of treatment with NG-497. Data represent mean of n = 3. IC50 values are indicated by the horizontal line. b Western blot analysis showing protein expression levels of ATGL, PSMA, pAKT and PTEN in selected prostate cancer cell lines. Cells were treated with DMSO (vehicle control), IC50 concentration of NG-497 (2,2 µM, 51 µM, 27 µM and 80 µM for LNCaP, PC3, 22RV1 and DU145, respectively), 2-PMPA (50 µM), and NG-497 (2,2 µM, 51 µM, 27 µM and 80 µM for LNcaP, PC3, 22RV1 and DU145, respectively) + 2-PMPA (50 µM) for 72 h. GAPDH and β-Actin were used as loading controls. Bars underneath the blots show quantification for ATGL and pAKT protein expression normalized to respective loading controls. c Representative BODIPY™ immunofluorescence staining images of LNCaP cells under different treatment conditions: DMSO (vehicle control), NG-497 (2,2 µM), 2-PMPA (50 µM), and NG-497 (2,2 µM) + 2-PMPA (50 µM) for 72 h. BODIPY™ staining is indicated by green dots. Cells were counterstained with DAPI to visualize nuclei.
To directly assess the functional consequences of ATGL inhibition on intracellular lipid storage, we performed BODIPY™ staining to visualise lipid droplet accumulation in treated cells (Fig. 5c, and Supplementary Fig. S5). NG-497 treatment led to a marked accumulation of intracellular lipid droplets in LNCaP, PC3, and DU145 cells, but notably not in 22RV1 cells, most probably due to high HSL levels in these cells (Supplementary Fig. S4b), which might compensate for ATGL inhibition. Combination treatment with NG-497 and 2-PMPA also resulted in lipid droplet accumulation to a similar extent as NG-497 treatment alone, suggesting that the observed lipid accumulation in the combination treatment is primarily driven by ATGL inhibition, and that 2-PMPA does not significantly alter this NG-497-induced phenotype.
To genetically validate the differential pharmacological ATGL inhibitor sensitivity, we performed proliferation assays following siRNA-mediated knockdown of ATGL and PSMA in LNCaP and 22RV1 cells cultivated in HPLM (Supplementary Fig. S6a, b). Consistent with the pharmacological data, ATGL knockdown significantly reduced LNCaP proliferation (Padj = 0.012) while 22RV1 cells showed a reduction in proliferation but no statistically significant impairment (adjusted Padj = 0.075), suggesting that the differential drug sensitivity reflects a genuine difference in ATGL dependency. PSMA knockdown showed less strong effects and did not significantly alter proliferation in either cell line.
ATGL and PSMA knockdown efficiency in LNCaP and 22RV1 cells was confirmed by western blot analysis (Supplementary Fig. S6c). ATGL knockdown upregulated PSMA 2.4-fold in LNCaP but reduced it in 22RV1, while PSMA knockdown did not alter ATGL in LNCaP but reduced it in 22RV1, revealing cell-line-specific cross-regulation. Notably, both knockdowns reduced full-length AR protein levels in both cell lines, including AR-V7 in 22RV1, which was paralleled by compensatory pAKT upregulation in PTEN-negative LNCaP cells. In order to study a potential androgen receptor (AR) dependency of ATGL and PSMA, we exposed LNCaP and 22RV1 cells to IC25 and IC50 doses of enzalutamide, which resulted in decreased AR expression in both cell lines and induction of pAKT in LNCaP cells (Supplementary Fig. S6d). Moreover, enzalutamide treatment increased both ATGL and PSMA levels in both cell lines treated, suggesting a reciprocal regulatory network in which AR signalling modulates PSMA and ATGL expression while disruption of either metabolic protein attenuates AR levels.
Following up on the distinct metabolic profiles described above, we performed Seahorse XF Mito Fuel Flex Test assays under pharmacological inhibition and genetic silencing of ATGL and PSMA in LNCaP and 22RV1 cells to assess their metabolic profiles under perturbation. Under pharmacological ATGL inhibition, LNCaP cells showed only modest shifts in fuel utilisation and failed to expand their metabolic flexibility, consistent with intrinsic metabolic rigidity (Fig. 6a, b). In contrast, 22RV1 cells showed a strong shift towards higher anaerobic glycolysis following ATGL inhibitor treatment at baseline (Fig. 6c, d). When challenged with additional fuel pathway blockade, 22Rv1 cells retained and expanded their reserve capacity to resume mitochondrial glucose and fatty acid oxidation. Genetic silencing of ATGL recapitulated the rigid LNCaP response to the ATGL inhibitor but not the dramatic 22RV1 rewiring, where cells instead reached a compensated steady state, consistent with the lower effects observed in the proliferation assay (Supplementary Fig. S7a–d). PSMA perturbation increased glutamine dependency in both cell lines, with striking quantitative convergence between pharmacological and genetic approaches in 22RV1, while chronic PSMA knockdown additionally drove 22RV1 cells toward broadly elevated dependency and contracted flexibility across all fuel axes.
Fig. 6: Seahorse XF Mito Fuel Flex Test profiling under pharmacological inhibition of ATGL and PSMA in LNCaP and 22RV1 cells.
Energy maps (a, c) display OCR plotted against ECAR for each individual well at the third baseline measurement before pathway inhibitor injection. Each dot represents one well irrespective of its subsequent measurement condition. Delta contribution plots (b, d) present the mean change in dependency (upper) and flexibility (lower) for glucose, glutamine, and fatty acid oxidation relative to the vehicle control (DMSO). Error bars represent the propagated standard error of the mean. These assays were performed as single biological experiments with 2 to 4 technical replicate wells per measurement condition after quality control. a Energy map for LNCaP cells treated with ATGLi (NG-497), PSMAi (2-PMPA), or the combination. b Delta contribution plots for LNCaP inhibitor-treated cells relative to DMSO control. c Energy map for 22RV1 cells treated with ATGLi, PSMAi, or the combination. d Delta contribution plots for 22RV1 inhibitor-treated cells relative to DMSO control.
In conclusion, these data indicate that LNCaP cells are highly dependent on ATGL-mediated lipolysis for proliferation, a vulnerability that can be traced back to their intrinsic metabolic rigidity.
