


SEC24A and SEC24B are important players in multiple myeloma
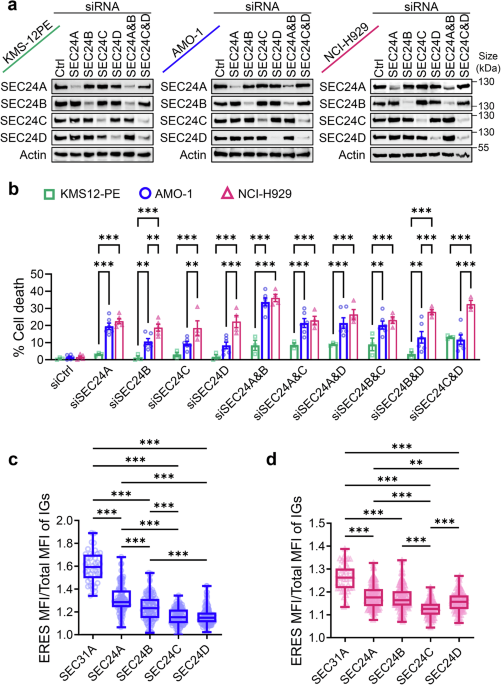
We first sought to determine which SEC24 paralog contributes to the survival of MM cells. To this end, we initially used three different myeloma cell lines that represent different states of proteostatic burden: (i) non-secretory KMS12PE cells,10 (ii) AMO-1 cells, which secretes IgA at low level, and (iii) the NCI-H929 cells, which also secretes IgA, but at a much higher level (Supplementary Fig. 1a, and Supplementary Fig. 2a, b). KMS12PE cells were validated to be non-secretory because no immunoglobulins could be detected by either immunofluorescence or FACS (Supplementary Fig. 2a, b). Because myeloma cells are notoriously difficult to transfect, we first developed a novel protocol for reproducible and efficient siRNA-mediated knockdowns (see Materials and methods, Fig. 1a and Supplementary Fig. 1b, c). Knockdowns of individual SEC24 paralogs or combinations thereof were established and cell viability was assessed 48 after siRNA transfection using the CellTiter-Glo assay. The secretory cell lines NCI-H929 and AMO-1 exhibited pronounced sensitivity to depletion of various SEC24 paralogs (Fig. 1b), whereas survival of non-secretory KMS-12PE cells was unaffected by inhibition of ER export. In particular, the co-depletion of SEC24A&B induced the strongest effects, and was therefore used for the rest of the study as the main perturbation. We detected cleavage of caspase 3 at 48 h after siRNA transfection, and the effect continued to increase up to 96 h after knockdown (Supplementary Fig. 1d). Identical kinetics were observed with PARP cleavage (Supplementary Fig. 1d). Depletion of SEC24A&B induced a significant reduction in steady-state immunoglobulin secretion in both AMO-1 and NCI-H929 cells (Supplementary Fig. 1e, f). For technical reasons, we were unable to perform siRNA rescue experiments, due to the high levels of cell death induced by plasmid transfection in cells that received siRNAs. This was not limited to SEC24 paralog knockdown, but was also observed in control siRNA conditions, indicating that this type of experiment is not compatible with our experimental system.
Fig. 1
Effect of SEC24 paralog depletion on survival of myeloma cells. a Immunoblots validating individual and combinatorial siRNA knockdowns of SEC24 paralogs in KMS12-PE, AMO-1, and NCI-H929 MM cell lines at 48 hafter transfection. b The impact of SEC24 depletion on cell viability was assessed using the CellTiterGlo assay after 48 h of knockdowns. Data were generated in ≥3 independent experiments. Each symbol represents an independent experiment. Significance was tested using the Tukey multiple comparison test (2-way ANOVA, ***P < 0.001; **P < 0.01). c, d Immunoglobulins predominantly colocalized with SEC24A and SEC24B paralogs. c AMO-1 or d NCI-H929 cells were incubated at 10 °C for 60 min to increase the local concentration of Igs at ERES. Cells were then spun onto coverslips and processed for immunofluorescence staining using antibodies against SEC24 paralogs and IgA. SEC31A staining was used as a positive control representing almost all ERES. The mean fluorescence intensity of IgA was measured at ERES and normalized to total cytosolic IgA intensity. The results are representative of three biologically independent experiments (number of cells >100 for each condition). Data are shown as a box-and-whisker plot displaying the median, first and third quartiles, and all data points. Whiskers in the box plots indicate maximum and minimum values. Significance was tested using the Tukey multiple comparison test (1-way ANOVA, ***P < 0.001; **P < 0.01)
We next tested the effect of SEC24A&B co-depletion on six additional myeloma cell lines and observed variable levels of reductions in survival (Supplementary Fig. 1g, Supplementary Fig. 2a, b, and Supplementary Table 1). Effects on cell viability were in the range of 20–35%, which is consistent with the notion that silencing SEC24A&B only partially impairs exit from the ER (because cells still have two other Sec24 paralogs), thus representing a mild perturbation of ER-proteostasis (Supplementary Fig. 1e, f). SEC24A&B knockdown also had no effect on general organization of ERES (Supplementary Fig. 3), indicating that this alteration of ER export might be selective to certain secretory proteins, and will not affect general secretion. The absence of an effect in non-secretory MM cells is in line with previous reports showing that knockdown of COPII subunits in the non-secretory cell line HeLa had no effect on their survival.11 Finally, we investigated whether inhibition of ER-export synergizes with the proteasome inhibitors, including bortezomib, carfilzomib, and MG132. Because both interventions target separate branches of the proteostasis network, we assessed their combined effect in a panel of 8 secretory myeloma cell lines and the non-secretory KMS-12PE cells as a negative control. As expected, non-secretory KMS12PE cells showed very little sensitivity to all proteasome inhibitors, which could not be enhanced by knockdown of SEC24A&B (Supplementary Figs. 4–6). In contrast, high level of toxicity was observed in the hypersecretory NCI-H929 cell line, supporting the notion that the secretory status determines the sensitivity to proteostasis-disrupting conditions. This high level of proteasomal toxicity prevented us from testing a synergism with SEC24A&B depletion in this cell line (Supplementary Figs. 4, 5, and Supplementary Fig. 6). However, in all cell lines, we observed additive effects to various extent and clear synergism of proteasome inhibitors with SEC24A&B knockdown in AMO-1 cells (Supplementary Figs. 4–6). On the contrary, the combination of SEC24A&B knockdown with lenalidomide, a commonly used IMiD, did not result in major additive or even synergistic effects in most cell lines (Supplementary Fig. 7).
Immunoglobulins colocalize with SEC24A and SEC24B in ERES
The effect of SEC24A&B depletion on survival of secretory myeloma cells implies that these SEC24 paralogs play a dominant role in the trafficking of immunoglobulins out of the ER. While previous work showed that ER-export of IgM is controlled by COPII-dependent factors,12,13 the identity of the SEC24 paralog mainly responsible was not investigated. We performed colocalization experiments of immunoglobulins with SEC24 paralogs in ERES. There is currently no evidence that SEC24 paralogs segregate on specific ERES. Rather, some ERES have a dominant SEC24 paralog, but are generally thought to be positive for all of them. Exit from the ER is fast, which precludes the detection of immunoglobulins in ERES at steady-state. To overcome this difficulty, we cultured AMO-1 and NCI-H929 cells for 60 min at 10 °C, a condition known to slow the exit of secretory proteins at the level of ERES.14,15 Cells were subsequently fixed and co-immunostained for IgA together with the individual SEC24 paralogs. Although immunoglobulins colocalized with all SEC24 paralogs, the colocalization was significantly stronger with SEC24A and SEC24B (Fig. 1c, d and Supplementary Fig. 8). This result is in line with the higher sensitivity of myeloma cells to SEC24A&B depletion compared to the other paralogs. We also co-stained immunoglobulins with SEC31, a component of every COPII coat and found that it showed greater colocalization with immunoglobulins than with any SEC24 paralog, indicating some level of segregation of SEC24 paralogs to different ERES.
ER stress in cells depleted of SEC24A&B does not contribute to cell death
To elucidate the mechanisms mediating myeloma cell death induced by knockdown of SEC24A&B, we hypothesized that reduced ER export activity leads to ER stress due to an accumulation of secretory proteins in the ER lumen, triggering an excessive unfolded protein response (UPR). In fact, crowding the ER lumen was previously shown to induce ER stress in non-secretory cell types.16,17 To test this hypothesis, we determined whether SEC24A&B depletion results in an increase in the load of misfolded proteins. We employed TPE-MI, a compound which upon reaction with free SH-groups in unfolded proteins becomes fluorescent, and thus can be quantified by flow cytometry.18 As shown in Fig. 2a and b, depletion of SEC24A&B (individually and in combination) resulted in a marked increase in the level of misfolded proteins in the secretory myeloma cell lines AMO-1 and NCI-H929. The increase with SEC24B depletion alone was already as strong as with the double knockdown, and was slightly higher than SEC24A depletion. This likely reflects a compensatory effect, because the levels of SEC24B are slightly increased in SEC24A knockdown cells, while SEC24B depletion does not affect SEC24A levels (Fig. 1a and Supplementary Fig. 1b). However, despite this increase in misfolded proteins, only a very weak UPR was detected in SEC24A&B knockdown cells (Supplementary Fig. 9a, b), suggesting that the observed cell death is unlikely to be mediated by UPR activation. In fact, the IRE1-XBP1 branch of the UPR has been reported to exert essential homeostatic roles in plasma cell differentiation and immunoglobulin production.19,20,21 In line with this homeostatic role of IRE1, pharmacological inhibition of IRE1 kinase or RNase activities did not rescue SEC24A&B depleted myeloma cells (Fig. 2c). One of the pro-survival roles of IRE1 is that it plays a role in expansion of ER volume in cells facing a high proteostatic burden. Silencing SEC24A&B resulted in an expansion of ER volume in the secretory myeloma cell lines AMO-1, FOLE and NCI-H929 (Fig. 2d, and Supplementary Fig. 10), but not in the non-secretory KMS12-PE cell line (Supplementary Fig. 10a) or low secretory cell line OH-2 (Supplementary Fig. 10b). ER expansion was completely dependent on IRE1 activity in the highly secretory NCI-H929 cell line (Supplementary Fig. 10d), and partially IRE1-dependent in the moderate secretory cell line AMO-1 (Supplementary Fig. 10c). Overall, these results indicate that the induction of UPR is unlikely to be involved in the cell death of SEC24A&B depleted myeloma cells.
Fig. 2
SEC24A&B-depleted secretory MM cells accumulate misfolded proteins and increase the size of the ER. a, b TPE-MI fluorescence was measured by flow cytometry after staining cells with 50 µM TPE-MI for 30 min. The data show the percentage change in median fluorescence intensity compared to the siRNA control condition for a AMO-1 and b NCI-H929 cells. Means ± SEM are shown (n = 3–5 measurements). Statistical significance was measured with one-way ANOVA followed by Dunnett’s test (***P <0.001; *P < 0.05). Representative histograms are shown on the right side of each graph with the same color code. c After 32 h of siRNA-mediated transfection of MM cell lines, cells were treated with vehicle (DMSO), 2 µM KIRA6, or 40 µM STF083010 for an additional 16 h. Cell viability was then assessed using the CellTiter-Glo assay. Data represent the mean of three independent experiments ±SEM. ***P < 0.001; *P <0.05, as calculated using a two-way ANOVA and Tukey post hoc test. d After 48 h of SEC24A&B co-knockdown, cells were stained with calnexin to label the ER, and confocal images of 3D reconstructions of the ER were acquired. Image stacks with 0.1 μm steps along the z-axis were used to analyze ER morphology using ImageJ 3D-suite. ER volume was normalized to the corresponding cell volume. Quantification was performed from three independent experiments. Data are presented as violin plots. Horizontal solid red lines in the violin plots represent medians, and black lines represent the first (lower) and third (upper) quartiles. Dots represent individual cells, AMO-1 (blue) and NCI-H929 (pink), n > 50 for each condition. The right panel shows a representative set of images for each cell type, with AMO-1 images presented at the top and NCI-H929 images below. Scale bar, 10 µm
An ERAD-mTORC1 signaling pathway mediates cell death of SEC24A&B-silenced myeloma cells
The accumulation of misfolded proteins in SEC24A&B knockdown cells prompted us to investigate a potential involvement of ER associated degradation (ERAD) in myeloma cell death. Induction of ERAD results in targeting misfolded proteins for proteasomal degradation, which would consequently elevate cytosolic amino acids. Therefore, we prepared cytosolic extracts of AMO-1 cells comparing control and SEC24A&B depleted cells and measured the levels of free amino acids. We normalized the amino acid levels to total cellular protein content. This normalization method is adequate because we did not observe an increase of cell size in SEC24 knockdown conditions (Supplementary Fig. 11). Impairment of ER-export resulted in a broad ~15–45% increase of most amino acids as well as a ~ 200% increase of glutamine (Fig. 3a, Supplementary Fig. 12, Supplementary Table S3–4). We performed dedicated analysis of glutamine levels in AMO-1 and NCI-H929 cells. SEC24A&B depletion resulted in a strong increase (~50% in AMO-1 cells and >200% in NCI-H929 cells) (Supplementary Fig. 13). This increase was likely due to an induction of ERAD, because it could be fully reversed by the ERAD-inhibitor kifunensine, as well as by proteasomal inhibitor bortezomib in both cell lines (Supplementary Fig. 13). This indicates that ERAD is a major contributor to the increased glutamine levels in SEC24A&B knockdown cells. Measurements of the levels of cytosolic amino acids was repeated in NCI-H929 cells and show a similar result as obtained with AMO-1 cells, namely that knockdown of SEC24A&B increases the levels of amino acids in the cytosol. To test whether the increase in amino acid levels is mediated by ERAD, we treated cells with kifunensine and observed that this reversed the increase, indicating a major role for ERAD in mediating the increase of cytosolic amino acids in SEC24A&B silenced cells (Supplementary FigS. 14–15).
Fig. 3
SEC24A&B-depleted cells exhibit elevated amino acids and ERAD-dependent mTORC1 activation. a Intracellular amino acid levels are presented as a percentage change over the negative control samples after 48 h of SEC24A&B silencing in AMO-1 cells. Each bar graph represents the average percentage change ±SEM (n = 3) relative to negative control cells. Statistical significance was determined by one-way ANOVA followed by Dunnett’s test (*P = 0.05). b AMO-1 cells were transfected with the indicated SEC24 siRNAs or control siRNA and subjected to western blot analysis of phosphorylated and total S6K1 after 48 h of knockdown. c AMO-1 cells transfected with siCtrl or siSEC24A&B were treated with 2 μM of kifunensine for 16 h, d or with 200 nM of bortezomib for 4 h, and then subjected to immunoblotting of phosphorylated and total S6K1 at the end of the 48-h knockdown. b–d Data are representative of at least three independent experiments
Mammalian target of rapamycin complex 1 (mTORC1) senses nutrient availability and is activated by a wide range of amino acids.22,23 Accordingly, we found that silencing SEC24A&B resulted in higher levels of phospho-S6 kinase (Fig. 3b, Supplementary Fig. 16a), a surrogate marker for mTORC1 activation. Treatment of SEC24A&B silenced cells with the ERAD inhibitor kifunensine, abolished the increase in mTORC1 (Fig. 3c and Supplementary Fig. 16b), indicating that mTORC1 activation depends on ERAD-mediated proteolysis. Likewise, brief (4 h) treatment with low doses of (200 nM) of bortezomib also reduced mTORC1 activation in SEC24A&B knockdown cells (Fig. 3d and Supplementary Fig. 16c). Consistent with ERAD activation in SEC24A&B knockdown conditions, kifunensine treatment of AMO-1 and NCI-H929 cells reduced polyubiquitinated protein levels to almost baseline levels (Supplementary Fig. 17a, b).
Our data so far support a model whereby alteration of ER-export triggers an accumulation of misfolded proteins in the ER, which are degraded by ERAD, resulting in an increase in the levels of cytosolic amino acids, which triggers mTORC1 activation. Next, we addressed two questions: (i) is elevated mTORC1 activity connected to myeloma cell death in SEC24A&B silenced cells, and (ii) what type of cell death is induced? To address these questions, we treated SEC24A&B silenced cells with torin-1 (to block mTOR) and with kifunensine (to block ERAD) for 16 h and found that both conditions partially rescued AMO-1 and NCI-H929 cells from cell death (Fig. 4a, b). The torin-1 concentration used (2 nM) reduced hyperactivated mTORC1 signaling to a level comparable to control cells (Supplementary Fig. 18a). This result indicates that elevated mTORC1 activity as well as ERAD are at least partially connected to cell death of myeloma cells with deficient ER-export. Notably, a pan-Caspase inhibitor or a caspase-9 specific inhibitor provided only partial protection (Fig. 4a, b, Supplementary Fig. 18b, c), indicating that apoptosis is not the sole mechanism of cell death induced by SEC24A&B depletion. To explore alternative cell death pathways, we treated SEC24A&B knockdown cells with the ferroptosis inhibitor ferrostatin-1 and necroptosis inhibitor necrostatin-1, neither of which provided protection (Supplementary Fig. 19a, b). Likewise, we found no evidence for senescence induction (Supplementary Fig. 19c). We noted that SEC24A&B knockdown cells exhibited more cytoplasmic vacuolization, which was absent in the non-secretory cell line KMS-12PE (Fig. 4c). Increased ER volume and cytosolic vacuoles are indicators of the induction of paraptosis, a relatively poorly understood cell death mechanism.24 In summary, our results indicate that impairment of ER export triggers an ERAD-mTORC1 cascade that reduces the viability of secretory MM cells. Cell death in this context involves both apoptotic and paraptotic mechanisms.
Fig. 4
Mechanisms and types of cell death of SEC24A&B depleted cells. a AMO-1 and b NCI-H929 cells were exposed to Z-VAD-FMK (20 μM), torin-1 (2 nM), kifunensine (2 μM), or DMSO for the last 16 h of a total 48-h SEC24A&B or control siRNA transfection, after which cell death was evaluated using an Annexin V and 7-AAD staining assay followed by flow cytometry analysis. The data are presented as means ± SEM from 4 to 6 individual experiments. Statistical significance was tested using the Tukey multiple comparison test (1-way ANOVA, ***P < 0.001; **P < 0.01; *P < 0.05). Right panels show representative dot plots of Annexin V and 7-AAD staining in MM cells. c Histograms show the distribution of the number of vacuoles per cell after SEC24A&B or control siRNA transfection for 48 h in MM cell lines. The number of vacuoles was quantified in more than 350 cells for each cell type. Data were obtained from at least three independent experiments. Right panels show representative images of MM cells after May-Grunwald/Giemsa staining. Scale bar, 10 µm
SEC24A&B depletion in MM cells disturbs the cellular energy balance
Higher mTORC1 activity is typically associated with an anabolic state, where cells generate more biomass through increasing the rate of translation. Because translation consumes ~30% of cellular energy, SEC24A&B silenced cells are expected to have a higher energetic demand. At the same time, disruption of ER homeostasis was shown to compromise mitochondrial function,25 suggesting a potential mismatch between energy demand and production. To assess mitochondrial activity, we measured glycolytic and respiratory activity in SEC24A&B knockdown cells. While no effect on basal glycolysis was detected (Supplementary Fig. 20), our data revealed a marked decrease in the spare respiratory capacity in SEC24A&B-depleted MM cells (Fig. 5a, b). Furthermore, we found that SEC24A&B depletion led to significant depolarization of mitochondria that decreases the capacity of secretory MM cells to produce ATP through oxidative phosphorylation at the inner mitochondrial membrane (Fig. 5c). To further assess mitochondrial dysfunction, we shifted the growth conditions of MM cells from glucose-containing to galactose-containing media. The oxidation of galactose to pyruvate by glycolysis yields no net ATP, forcing cells to rely on mitochondrial respiration for ATP generation. In control cells, ATP levels slowly declined over a 3-hour period, whereas SEC24A&B depleted cells exhibited a substantially greater drop in ATP levels, which is consistent with mitochondrial dysfunction (Fig. 5d).
Fig. 5
SEC24A&B depleted cells have altered mitochondrial function and exhibited reduced protein synthesis rates. a, b After 48 h of control or SEC24A&B siRNA-mediated transfection, OCR was measured on a Seahorse XF96 Analyzer under basal conditions and during successive additions of 1.5 mM oligomycin, 0.5 mM FCCP, and 0.5 mM rotenone/antimycin A in a AMO-1 and b NCI-H929 MM cell lines. Spare respiratory capacity is also presented in the bar graph. Graphs show mean values ± SEM (n = 4 independent experiments). Statistical analysis was conducted using a two-tailed unpaired t-test (**P < 0.01; *P < 0.05). c Mitochondrial membrane potential was determined by staining with the ratiometric dye JC-1 in AMO-1 and NCI-H929 MM cell lines after 48 h of control or SEC24A&B siRNA-mediated knockdowns. Graphs show mean values ± SEM (n = 5–7 independent experiments). ***P < 0.001; **P < 0.01, Student’s unpaired two-tailed t-test. Pseudocolor dot plots show a representative experiment. Red JC-1 staining indicates polarized mitochondria, while a loss of red fluorescence shows depolarization. Mitochondrial depolarization is calculated and presented as Arbitrary Units (a.u.) of the red/green fluorescence intensity ratio. d Intracellular ATP levels were measured in control and SEC24A&B-depleted AMO-1 (top panel, blue) and NCI-H929 (bottom panel, pink) cell lines, which were cultured for the indicated time periods in a medium where glucose was replaced with galactose. Lighter dashed lines and solid lines represent control siRNA and SEC24A&B siRNA transfections, respectively. Quantification is shown as mean ± SEM, n = 6, two-way ANOVA with Tukey’s multiple comparisons test (**P < 0.01; *P < 0.05). e Translation was monitored using puromycin-labeled proteins. Representative results from n = 3 experiments are shown. Puromycin incorporation of mock-treated (ctrl(-)), CHX-pretreated (25 μM), and puromycin (puro)-labeled (10 μg/ml) for the indicated times (1 h, 2 h, and 3 h), or only labeled with puromycin without CHX pretreatment for 3 h as a positive control (ctrl(+)), were analyzed by western blot using an antibody to puromycin in AMO-1 (left) and NCI-H929 (right) cells after 48 h of siRNA-mediated knockdown. Anti-puromycin immunoblots (upper panels) and Ponceau S staining (lower panels) are shown. Ponceau blots verify protein loading. FACS analysis of puromycin-labeled cells was detected with Alexa 647–labeled antibodies to puromycin at early time points. Representative histogram overlays are presented next to the blots. Light lines and solid lines represent control siRNA and SEC24A&B siRNA transfections, respectively
Given that translation is the most energetically costly process,26 we asked whether the elevated mTORC1 activity in SEC24A&B knockdown cells would still be able to increase their translation activity, despite having dysfunctional mitochondria. Therefore, we monitored translation using a puromycin-incorporation assay (SUnSET).27 FACS was used to detect translation at early time points, while immunoblotting was performed after one hour of puromycin-incorporation. Both approaches revealed a decrease in global translation in SEC24A&B-depleted secretory MM cells, suggesting that energy insufficiency constrains anabolic activity (Fig. 5e). Altogether, these results suggest that impairment of ER export in secretory MM cells disrupts cellular energy balance by simultaneously increasing energetic demand through mTORC1 activation and impairing mitochondrial ATP production. The resulting energetic imbalance eventually leads to cell death of myeloma cells.
Effect of SEC24A&B depletion on MM cell growth in vivo and in patient-derived cells
Our experiments described so far were conducted in vitro using MM cell lines. To test the growth of MM cells ex vivo, we used a chorioallantoic membrane (CAM) assay as described previously.28 We engineered NCI-H929 or KMS-12PE to express GFP-CaaX to enable the visualization and quantification of spheroid growth. The CAM assay offers the advantage of a rapid 3D in vivo system to monitor growth of MM cells. Cells were transfected with non-targeting control siRNA or SEC24A&B siRNAs and tumor spheroids were embedded in growth factor-reduced Matrigel matrix and positioned onto the CAM for 4 days. MM spheroids were excised and their mass was quantified using an anti-GFP-ELISA. SEC24A&B depletion significantly reduced spheroid mass of secretory MM cell line, NCI-H929 (Fig. 6a). In contrast, spheroids derived from non-secretory KMS-12PE cells did not exhibit any significant decrease in size when depleted of SEC24A&B.
Fig. 6
Effects of SEC24A&B knockdown on MM cells in vivo and in patient-derived MM cells. a Chicken chorioallantoic membrane assay was used for in vivo testing. MM spheroids containing SEC24A&B or control siRNA treated MM cells in a growth factor-reduced Matrigel matrix were positioned on the membrane and incubated for 4 days. GFP concentrations of single spheroid were measured by ELISA. Quantification of the data was obtained from multiple technical replicates represented as different symbols. Horizontal black lines indicate medians. Statistical analysis of the results was performed by unpaired, two-tailed t test. ***P < 0.001. MM spheroids were photographed using a stereo-fluorescence microscope. Representative spheroids are shown on the right side. Scale bar, 1 mm. b NSG mice were intrafemurally injected with NCI-H929 cells bearing scrambled-shRNA or SEC24A&B-shRNA. Two weeks after inoculation, tumors were established in all mice and readily detected by bioluminescence images (day 0). Then, mice received 2.5 mg/kg doxycycline intraperitoneally twice at 5-day intervals. Following two rounds of doxycycline induction, the mice were injected i.p. with 100 μl of CycLuc1 (5 mM) and imaged ten minutes post-injection (day 10). Each point represents the total flux (photons/sec) in the region of interest (red dashed-line) of the mice. Gray circles, NCI-H929 cells bearing scrambled-shRNA (n = 8); red circles, NCI-H929 cells bearing SEC24A&B-shRNA mice (n = 8). ***P < 0.001, Student’s paired two-tailed t-test. Representative bioluminescence images of mice show systemic tumor progression and response to SEC24A&B depletion. c Cell viability of primary human bone marrow CD138+ myeloma cells was measured using the CellTiterGlo assay after 48 h of SEC24A&B knockdown. Cell viability was normalized to siRNA control. Patients were grouped as newly diagnosed (n = 9) and relapsed (n = 8). Lines indicate medians. *P < 0.05, Student’s unpaired two-tailed t-test. d Flow cytometry histograms of TPE-MI staining in one representative patient after 48 h of siRNA-mediated knockdowns. AF = unstained cells for autofluorescence. e ER volume of one representative patient after 48 h of SEC24A&B or negative control siRNA treatment of patient-derived CD138 + MM cells. ER volume was normalized to corresponding cell volume. Data are presented as violin plots. Horizontal dark cyan lines in the violin plots represent medians, and light cyan lines represent the first (lower) and third (upper) quartiles. Each light-colored circle represents an individual cell (n > 100 cells per condition). ***P < 0.001, Student’s unpaired two-tailed t-test. The right panel shows a representative set of images for each condition. Scale bar, 10 µm
To further validate these findings in a mammalian in vivo disease model, we established an orthotopic mouse model using luciferase expressing NCI-H929 cells stably expressing doxycycline-inducible shRNAs targeting SEC24A and SEC24B or a scrambled control. Cells were injected intrafemorally into 6–8-week-old immunocompromised NSG mice to establish orthotopic MM xenograft model in the bone marrow. Two weeks after intrafemoral injection, tumor growth was monitored by bioluminescence imaging and doxycycline was administered intra-peritoneally twice at 5-day intervals. While tumors derived from cells expressing scrambled shRNA continued to grow for the next 10 days, tumors established with SEC24A&B shRNA-expressing cells exhibited a substantial reduction in size (Fig. 6b, Supplementary Fig. 21a, b). Finally, to determine the clinical significance of our findings, we asked whether reduction of SEC24A&B levels in patient-derived myeloma cells would reproduce some of the effects observed with MM cell lines. Primary cells were obtained from 17 patients (9 primary diagnosed and 8 relapsed, Supplementary Table 2). SEC24A&B knockdown resulted in a 30% reduction in the viability of cells isolated from newly diagnosed patients, whereas it had a much weaker effect on cells collected from relapsed patients (Fig. 6c). In line with the observations from cell lines, SEC24A&B silencing also increased the amount of protein misfolding and increased ER volume in primary MM cells (Fig. 6d, e).
