


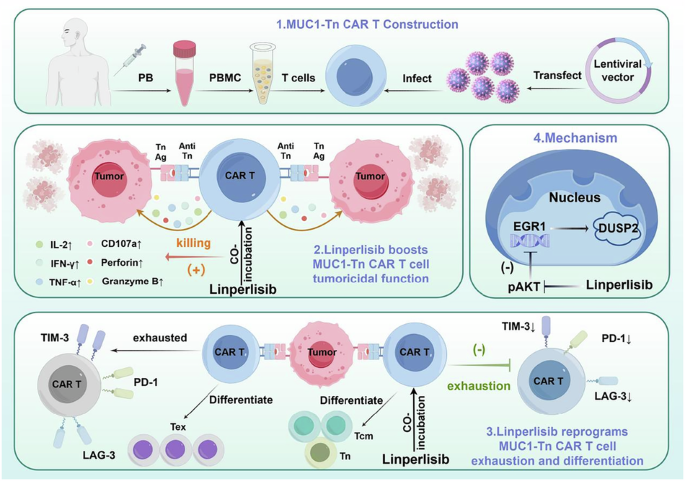
Expression and validation of Tn antigen as a target for CAR-T therapy in T-ALL
Tumor-associated antigen expression is critical for CAR target selection, influencing recognition, cytotoxicity, and off-tumor toxicity. To evaluate MUC1-Tn (CD175) as a therapeutic target for hematologic malignancies, we analyzed its expression in T-ALL (Jurkat E6.1, Hut-78), B-ALL (Nalm6, Reh), and CTCL (HH, MAC1) cell lines. Flow cytometry and Western blotting confirmed Tn expression in all cell lines except Reh, with higher levels in T-ALL cells (Fig. 1a, b). To verify patient relevance, bone marrow samples from five T-ALL patients and healthy donors were assessed. Flow cytometry revealed significantly elevated Tn expression in patient samples (Fig. 1c, d; gating strategy and healthy donor expression in Supplementary Fig. 1a, b). Based on these findings, MUC1-Tn was selected as a therapeutic target for T-ALL CAR T cell development.
Fig. 1: Target validation and construction of MUC1-Tn CAR T cells.
a Flow cytometry was performed to analyze the expression of MUC1-Tn (CD175) antigen in various leukemia cell lines. b Western blot analysis was conducted to validate MUC1-Tn antigen expression across various leukemia cell lines. c, d Flow cytometric analysis was performed to assess MUC1-Tn antigen expression in bone marrow mononuclear cells (BMMCs) from both T-ALL patients and healthy donors (n = 5). Flow cytometry results demonstrating MUC1-Tn antigen expression in healthy donors are presented in Supplementary Fig. 1b. e The schematic diagram of the MUC1-Tn CAR plasmid construct is presented. f Flow cytometry detection of lentiviral transfection efficiency in CD3+ T cells. g Western blot analysis confirmed the expression of MUC1-Tn scFv following viral transduction. h, i CAR T cells (day 8 of culture) were co-cultured with VPD450-labeled Jurkat E6.1 and Hut-78 target cells at an effector-to-target (E:T) ratio of 1:2 for 6 h. Tumor cell apoptosis was quantified by flow cytometry (n = 3). Representative flow cytometry plots (left) and statistical analysis (right) are shown. All experiments were presented as the mean ± SD. Data in (d) were analyzed by unpaired Student’s t test. Data in (h, i) were analyzed by unpaired one-way ANOVA with multiple comparison test (*P < 0.05; **P ≤ 0.01; ***P ≤ 0.001; ****P ≤ 0.0001; NS not significant).
MUC1-Tn CAR T cells exhibit functional cytotoxicity against T-ALL cells without off-target or fratricide effects
Lentiviral transduction efficiency was confirmed by fluorescence microscopy (Supplementary Fig. 1c) and quantified by flow cytometry (~67.9%, Fig. 1f), with Western blot verification of MUC1-Tn scFv expression (Fig. 1g; scFv sequence and plasmid details in Supplementary Table S2 and Supplementary Fig. 1d, e). Apoptosis assays demonstrated that MUC1-Tn CAR T cells exhibited potent cytotoxicity against two T-ALL cell lines, with greater killing of Jurkat E6.1 cells correlating with higher Tn antigen expression (Fig. 1h, i). Safety evaluation revealed no significant apoptosis in the Tn-negative T-ALL cell line Molt4, nor in MCF-10A cells that express full-length MUC1 but lack Tn antigen (Supplementary Fig. 1f, g) [30]. Furthermore, no fratricide was observed when CAR T cells were co-cultured with untransduced T cells (Supplementary Fig. 1h). Collectively, these results confirm that MUC1-Tn CAR T cells possess potent and specific antitumor activity with a favorable safety profile.
Linperlisib enhances the anti-T-ALL ability of MUC1-Tn CAR T cells
Building upon the successful construction of MUC1-Tn CAR T cells, we evaluated the in vitro impact of the PI3Kδ inhibitor linperlisib on their anti-leukemic efficacy. Linp-CAR T cells were co-cultured with T-ALL cell lines Jurkat E6.1 and Hut-78 for 6 h. Tumor cell apoptosis was analyzed by flow cytometry, and effector functions were assessed via degranulation (CD107a), cytotoxic granule release (perforin/granzyme B), cytokine secretion (IL-2, IFN-γ, TNF-α), and target lysis by LDH assay. Compared to conventional CAR T cells, Linp-CAR T cells exhibited significantly enhanced dose-dependent tumor killing, with increased apoptosis and target lysis across effector-to-target ratios (Fig. 2a, b). Functional assays revealed enhanced CD107a expression (Fig. 2c), granzyme B/perforin release (Fig. 2d, e), and elevated cytokine secretion (Fig. 2f).
Fig. 2: Linperlisib enhances the anti-T-ALL ability of MUC1-Tn CAR T cells.
a CAR T or Linp-CAR T cells cultured for 8 days were co-cultured with VPD450-labeled Jurkat E6.1 and Hut-78 cells at graded effector-to-target ratios (1:8, 1:4, 1:2, 1:1) for 6 h. Tumor cell apoptosis rates were quantitatively analyzed by Annexin V/PI double staining coupled with flow cytometry (n = 3). b Using the co-culture system established in (a), the specific cytotoxic effects of CAR T and Linp-CAR T cells against T-ALL cell lines were quantitatively evaluated by LDH release assay (n = 3). c Degranulation capacity of CAR T and Linp-CAR T cells was assessed by measuring CD107a surface expression levels via flow cytometry (n = 3). Representative flow cytometry plots (left) and statistical analysis (right) are shown. d, e Intracellular staining combined with flow cytometry was employed to quantitatively determine granzyme B and perforin expression levels in effector cells (n = 3). Representative flow cytometry plots (left) and statistical analysis (right) are shown. f Cytokine secretion profiling. The secretion capacities of key effector cytokines (IFN-γ, IL-2, and TNF-α) by CAR T and Linp-CAR T cells were systematically evaluated using flow cytometric intracellular staining (n = 3). Representative flow cytometry plots are shown in Supplementary Fig. 2a, b. All experimental data were presented as mean ± SD. Statistical significance was assessed by unpaired Student’s t test (*P < 0.05; **P ≤ 0.01; ***P ≤ 0.001; ****P ≤ 0.0001; NS not significant).
These findings were validated using bone marrow samples from five MUC1-Tn⁺ T-ALL patients. Linp-CAR T cells demonstrated superior tumor killing (Fig. 3a, b), lysis capacity (Fig. 3c), degranulation (Fig. 3d), cytotoxic granule release (Fig. 3e, f), and cytokine secretion (Fig. 3g) compared to untreated T cells and conventional CAR T cells. Collectively, linperlisib treatment markedly enhances degranulation, cytotoxicity, and cytokine secretion of MUC1-Tn CAR T cells, boosting their in vitro anti-T-ALL efficacy.
Fig. 3: Linperlisib enhances the cytotoxic efficacy of MUC-Tn CAR T in targeting tumor cells derived from patients.
Bone marrow samples were collected from five T-ALL patients, from which mononuclear cells were isolated and purified. a, b At an E:T ratio of 1:1, UT, CAR T, and Linp-CAR T cells cultured to day 8 were co-cultured with VPD450-labeled patient tumor cells for 6 h. Tumor cell apoptosis was analyzed by flow cytometry, using VPD450-labeled tumor cells co-cultured with effector cells (n = 5). c At an E:T ratio of 1:1, UT, CAR T, and Linp-CAR T cells cultured to day 8 were co-cultured with patient-derived tumor cells for 6 h. The specific cytotoxic effects against T-ALL cell lines were assessed by LDH cytotoxicity assay (n = 5). d–f Flow cytometric analysis evaluating the degranulation (CD107a expression, n = 5) and cytotoxic factor release (n = 5) in UT, CAR T, and Linp-CAR T cells after 6-h co-culture with patient tumor cells. Representative flow cytometry plots (left) and statistical analysis (right) are shown. g UT, CAR T, and Linp-CAR T cells were co-cultured with patient tumor cells at an E:T ratio of 1:1 for 24 h at 37 °C, followed by ELISA measurement of cytokine (IL-2, IFN-γ, and TNF-α) secretion in supernatants (n = 5). All experiments were presented as mean ± SD. Statistical analysis was performed using unpaired one-way ANOVA with multiple comparison test (*P < 0.05; **P ≤ 0.01; ***P ≤ 0.001; ****P ≤ 0.0001; NS not significant).
Linperlisib inhibits the differentiation of T or CAR T cells and reduces T cell exhaustion markers
To evaluate the safety profile of linperlisib on T and CAR T cells and its effects on effector cell differentiation and exhaustion, we first assessed its impact on proliferation, differentiation, and exhaustion marker expression. Linperlisib-treated T and CAR T cells maintained comparable proliferation and viability to untreated controls at various concentrations (Supplementary Fig. 3a, b). At 1 μM, linperlisib significantly increased CD8+ T cell populations (P ≤ 0.001, Fig. 4a) and reduced Treg proportions (Fig. 4b). Dose-escalation studies revealed increased frequencies of naïve (TN) and central memory T cells (TCM), with decreased effector memory (TEM) and terminally exhausted T cells (TTE) (Fig. 4c), alongside progressive downregulation of exhaustion markers (LAG-3, PD-1, TIM-3) (Fig. 4d). Following stimulation with T-ALL cell lines, linperlisib-treated CAR T cells exhibited lower Treg proportions (Fig. 4e), reduced exhaustion marker expression (Fig. 4f), and decreased terminally exhausted T cell populations (Fig. 4g) compared to untreated controls. Collectively, these results demonstrate that linperlisib effectively delays T and CAR T cells exhaustion and reduce exhaustion marker expression, thereby enhancing the potency and persistence of CAR T cell-mediated antitumor responses.
Fig. 4: Linperlisib inhibits the differentiation of T or CAR T cells and reduces T cell exhaustion markers.
a Proportion of CD8+ T cells after treatment with different drug concentrations (n = 3). Representative flow cytometry plots (left) and statistical analysis (right) are shown. b Proportion of Treg cells (CD3+CD4+CD25+Foxp3+) after treatment with different drug concentrations (n = 3). Representative flow cytometry plots are shown in Supplementary Fig. 3c. c CD8+ T cell differentiation profiles following treatment with various drug concentrations (n = 3). Representative flow cytometry plots are shown in Supplementary Fig. 3d. T cell subsets were defined as: naïve T cells (CD45RO−CCR7+), central memory T cells (CD45RO+CCR7+), effector memory T cells (CD45RO+CCR7−), and terminally exhausted T cells (CD45RO−CCR7−). d Expression of exhaustion markers on CD3+T cells after treatment with different drug concentrations (n = 3). Representative flow cytometry plots are shown in Supplementary Fig. 3e. e–g Flow cytometric analysis of Treg cell proportion, expression of exhaustion markers (LAG-3, TIM-3, PD-1), and differentiation status in CAR T or Linp-CAR T cells (n = 3). Representative flow cytometry plots are shown in Supplementary Fig. 3f–h. h Transmission electron microscope image of mitochondria. i Western blotting detecting the expression of mitochondrial regulatory proteins. j Detection of cellular mitochondrial oxygen consumption rate. All experiments were presented as the mean ± SD. Data in (a–d) were analyzed by unpaired one-way ANOVA with multiple comparison test. Data in (e–g, i) were determined by unpaired Student’s t test (*P < 0.05; **P ≤ 0.01; ***P ≤ 0.001; ****P ≤ 0.0001; NS not significant).
Linperlisib induces mitochondrial fusion and enhances respiratory capacity in CAR T cells
Previous work reported an association between increased mitochondrial content and enhanced T-cell fitness [31]. To investigate the impact of linperlisib on CAR T cell persistence, we examined mitochondrial morphology and function. Transmission electron microscopy revealed linperlisib-induced mitochondrial fusion, characterized by enlarged mitochondria with elongated networked structures and intact cristae (Fig. 4h). Molecularly, linperlisib upregulated fusion mediators MFN1/2 and the biogenesis regulator PGC1-α, while reducing fission-related pDRP1 activity (Fig. 4i). Functionally, Seahorse analysis confirmed increased basal and maximal respiration in treated cells (Fig. 4j), reflecting enhanced metabolic capacity. Collectively, these findings indicate that linperlisib promotes mitochondrial fusion and respiratory function in CAR T cells, which may contribute to their improved persistence.
Linperlisib enhances the antitumor efficacy and persistence of MUC1-Tn CAR-T cells in the cell line-derived xenograft (CDX) model
To assess the in vivo therapeutic effects of linperlisib-treated CAR T cells, we established Jurkat E6.1 leukemia xenograft models in B-NDG mice. Seven days after tumor inoculation, mice were randomly assigned to four groups: normal saline (NS), untransduced T cells (UT), CAR T cells, and linperlisib-treated CAR T cells (Linp-CAR T). Randomization was performed by random selection of pre-existing mouse identification numbers. Leukemia progression was monitored by bioluminescence imaging (Fig. 5a). Both CAR T and Linp-CAR T groups exhibited superior anti-leukemic activity compared to controls, evidenced by significantly reduced tumor burden (Fig. 5b, c) and prolonged survival (Fig. 5d). Notably, CAR T monotherapy showed diminished tumor control after day 21. Comparative analyses across multiple time points revealed that Linp-CAR T cells achieved enhanced and more sustained tumor clearance (Fig. 5e, f), further confirmed by immunohistochemistry (Supplementary Fig. 4). Mechanistically, Linp-CAR T cells exhibited increased proportions of CD8+ and central memory subsets, reduced terminally exhausted T cells (Fig. 5g, h), and downregulated exhaustion markers (LAG-3/PD-1/TIM-3; Fig. 5i). These findings demonstrate that linperlisib enhances the therapeutic efficacy and durability of MUC1-Tn CAR T cells against T-ALL in vivo by mitigating exhaustion and preserving memory phenotypes.
Fig. 5: In the CDX model, MUC1-Tn CAR T cells treated with linperlisib exhibit enhanced tumor-killing ability and prolonged activity time.
Pre-experiment: A total of 12 BND-G mice were used (3 mice per group). In each group, 1 mouse was euthanized for analysis of bone marrow CAR T cell exhaustion markers, and the remaining 2 mice were monitored for overall survival. Formal experiment: A total of 40 B-NDG mice were included (10 mice per group). In each group, 5 mice were used to assess tumor cell infiltration in various organs and to evaluate CAR T cell differentiation and exhaustion, while the other 5 mice were observed for overall survival. Animals were randomly allocated to experimental groups. Exclusion criteria (e.g., death, operational errors, data collection failures) were pre-specified before the experiment. Blinding was not implemented in this study. a Protocol for T-ALL xenograft mouse model: On Day 0, T-ALL Jurkat E6.1 luciferase-expressing cells (1 × 10⁶) were intravenously injected via the tail vein into 4–8 week-old B-NDG mice. On Day 7, tumor-bearing mice received intravenous injections of saline (200 μl), UT (1 × 10⁶), CAR T (1 × 10⁶), or Linp-CAR T (1 × 10⁶). Mouse condition and body weight were monitored daily, with tumor progression assessed weekly by IVIS Lumina imaging. b Representative images of tumor burden at each analysis timepoint (Day 7,14,21,28,35,42; n = 5) following D-luciferin substrate administration (intraperitoneal injection, 150 mg/kg). The floating color bar indicates imaging threshold range. c Total flux quantification curves showing tumor progression in four treatment groups (n = 5). d Kaplan–Meier survival curves demonstrating significantly improved survival in T-ALL mice treated with Linp-CAR T cells (n = 5). e Quantitative analysis of bioluminescent imaging at four timepoints (Day 14,21,28,35) for CAR T and Linp-CAR T groups (n = 5). f Flow cytometry analysis of tumor cell proportions in peripheral blood, bone marrow and spleen (Day14) from CAR T and Linp-CAR T groups (n = 6). g Flow cytometry quantification of CD8+ CAR T cell proportions (EGFP+) in bone marrow (Day14; n = 6). h Differentiation status analysis of bone marrow CAR T cells by flow cytometry (Day14; n = 5). i Exhaustion marker expression profiles in bone marrow CAR T cells by flow cytometry (Day14; n = 6).Data in (e–i) were presented as mean ± SD and analyzed by Student’s unpaired t-test. Statistical significance for (d) was calculated by two-sided log-rank Mantel–Cox tests (*P < 0.05; **P ≤ 0.01; ***P ≤ 0.001; ****P ≤ 0.0001; NS not significant).
Enhanced antitumor activity of linperlisib-treated MUC1-Tn CAR T cells in patient-derived xenograft (PDX) models and upon tumor rechallenge
Building upon the enhanced antitumor efficacy observed in CDX models, we evaluated linperlisib-treated CAR T cells in more clinically relevant system. A PDX model was established using primary patient tumor cells with high MUC1-Tn expression (Fig. 6a). Both CAR T and Linp-CAR T significantly prolonged survival versus controls (Fig. 6b). The mouse weight was monitored (Fig. 6c). Tumor-bearing mice exhibited pronounced splenomegaly, an effect that was alleviated by both interventions, with the Linp-CAR T treatment showing a more pronounced therapeutic effect (Fig. 6d, e).
Fig. 6: Linperlisib enhances the antitumor efficacy and persistence of MUC1-Tn CAR T cells in PDX and tumor rechallenge models.
a Schematic illustration of the T-ALL PDX model establishment and treatment regimen. b Kaplan–Meier survival curves of tumor-bearing mice in the indicated treatment groups (n = 5 per group). c Body weight changes of mice throughout the experimental period. d Representative images of spleens from each group, illustrating differences in splenomegaly. e Quantitative analysis of spleen weights. f Schematic representation of the tumor rechallenge experimental design. g Tumor burden dynamics over time, assessed by bioluminescence imaging (BLI). h Survival analysis of mice subjected to tumor rechallenge. i, j Flow cytometric analysis of CAR T cell exhaustion markers and terminal differentiation status before and after tumor rechallenge. Data in (i) and (g) were presented as mean ± SD and analyzed by Student’s unpaired t-test. Data in (e) was presented as mean ± SD and analyzed by unpaired one-way ANOVA with multiple comparison test. Statistical significance for (b) and (h) was calculated by two-sided log-rank Mantel–Cox tests (*P < 0.05; **P ≤ 0.01; ***P ≤ 0.001; ****P ≤ 0.0001; NS not significant).
To evaluate CAR T cell persistence in vivo, we established a tumor rechallenge model. Upon tumor engraftment, mice received CAR T or Linp-CAR T cells via tail vein injection at an effector-to-target ratio of 3:1 (Fig. 6f), which differs from the 1:1 ratio used in the prior CDX model. Both treatments induced substantial tumor reduction by day 10 and near-complete remission by day 14. Following rechallenge, while control CAR T-treated mice relapsed, Linp-CAR T-treated mice maintained sustained remission (Fig. 6g) with significantly prolonged survival (Fig. 6h). Flow cytometry revealed that the upregulation of exhaustion markers and the increased proportion of TTE were attenuated by linperlisib treatment, both prior to and following rechallenge (Fig. 6i–j). Collectively, these findings demonstrate that linperlisib potentiates the in vivo antitumor efficacy of MUC1-Tn CAR T cells and enhances their persistence and resistance to tumor rechallenge.
Linperlisib inhibits the exhaustion transcription program of MUC1-Tn CAR T cells
Both in vitro and in vivo studies demonstrated that linperlisib-treated CAR T cells exhibit reduced exhaustion markers and decreased terminally exhausted populations, indicating enhanced functional persistence. To investigate the molecular mechanisms underlying this effect, we performed RNA sequencing on tumor-stimulated CAR T and Linp-CAR T cells at day 15 of culture (Fig. 7a). This analysis identified 651 differentially expressed genes, with key exhaustion- and differentiation-related regulators including EGR1, EGR2, FOS, JUNB, TOX2, and BATF3 being the most significantly modulated (Fig. 7b) [24, 32,33,34]. Based on this transcriptional profiling, we selected candidate genes for validation at the protein level. Western blot analysis confirmed marked downregulation of EGR1, EGR2, and DUSP2, along with significant upregulation of BATF3 in linperlisib-treated CAR T cells (Fig. 7c, d). These findings suggest that linperlisib enhances the sustained cytotoxic activity of MUC1-Tn CAR T cells through suppression of exhaustion-related transcriptional programs.
Fig. 7: Linperlisib inhibits the exhaustion transcription program of MUC1-Tn CAR T cells.
a Gene Ontology (GO) enrichment analysis reveals significantly enriched genes in biological processes (BP). The horizontal axis indicates the number of enriched genes within each GO term, while the vertical axis displays the significantly enriched GO terms representing specific biological processes. The blue color gradient in the legend on the right corresponds to lower adjusted p-values (p.adjust), indicating higher statistical significance of the enrichment. b The heatmap illustrates the expression patterns of representative differentially expressed genes (FDR < 0.05) between Linp-CAR T and conventional CAR T cell groups. c Western blot analysis demonstrated the expression profiles of key proteins in CAR T cells following linperlisib treatment. d The relative expression levels of these six protein bands are presented as grayscale intensity ratios normalized to internal controls. All experiments were presented as the mean ± SD. Data were analyzed by unpaired Student’s t test (*P < 0.05; **P ≤ 0.01; ***P ≤ 0.001; ****P ≤ 0.0001; NS not significant).
Dual-specificity phosphatase 2 (DUSP2) is a protein contributes to the exhaustion effect of MUC1-CAR T cells
To elucidate the transcriptional regulatory network through which linperlisib alleviates exhaustion in MUC1-Tn CAR T cells, we constructed a protein-protein interaction (PPI) network using Cytoscape to analyze differentially expressed genes and identify core genes. This analysis identified DUSP2 as a hub gene (Fig. 8a). DUSPs play pleiotropic roles in T cell activation, senescence, exhaustion, and homeostasis, with chronic activation leading to DUSP overexpression and T cell exhaustion [35]. Based on these findings, we hypothesized that DUSP2 may serve as a critical mediator of exhaustion in MUC1-Tn CAR T cells.
Fig. 8: Linperlisib targets the EGR1-DUSP2 axis to inhibit MUC1-Tn CAR T exhaustion.
a The protein-protein interaction (PPI) network diagram (where circles represent differentially expressed proteins and connecting lines indicate interactions between protein pairs) was constructed to visualize the functional relationships among key molecular players. b The differentiation of CAR T cells (Day-14) was detected by flow cytometry after adding 0.1% DMSO, 500 nM (low), 2 μM (medium), and 10 μM (high) Salubrinal. Representative flow cytometry plots are shown in Supplementary Fig. 5c. c Flow cytometry was performed to detect the expression of exhaustion markers in day-14 CAR T cells treated with 0.1% DMSO, 500 nM (low), 2 μM (medium), or 10 μM (high) Salubrinal (DUSP2 inhibitor). Representative flow cytometry plots are shown in Supplementary Fig. 5d. d The differentiation status of DUSP2-overexpressing CAR T cells (Day-14) was analyzed by flow cytometry, with representative flow cytometry plots (left) and quantitative statistical results (right) shown. e The expression of exhaustion markers in CAR T cells (Day-14) overexpressing DUSP2 was detected by flow cytometry. Representative flow cytometry plots (top) and statistical graphs (bottom) are shown. f The protein docking diagram (Blue: DUSP2; Pink: EGR1; Stick representation: amino acid residues; Yellow dashed lines: hydrogen bonds; Orange dashed lines: salt bridges). When salt bridges coincide with hydrogen bonds, hydrogen bonds are prioritized for visualization). gThe co-immunoprecipitation (Co-IP) results were analyzed by Western blot (Input group: crude lysates without immunoprecipitation, confirming EGR1 and DUSP2 protein expression; IgG negative control: precipitation with nonspecific antibody to exclude nonspecific binding; IP group: DUSP2 was detected in proteins pulled down by EGR1 antibody). h, i Western blot analysis showing the expression levels of EGR1 and DUSP2 proteins in CAR T cells following treatment with DUSP2 inhibitor (10 μM) and EGR1 inhibitor (5 μM), respectively. j EGR1 and DUSP2 protein expression in response to three PI3Kδ inhibitors (Linperlisib, Duvelisib, Idelalisib) was examined by Western blotting. k Flow cytometry analysis was conducted to detect exhaustion marker expression in CAR T cells (Day 14) treated with 0.1% DMSO, 5 μM EGR1 inhibitor, or 5 μM EGR1 inhibitor following DUSP2 overexpression. l Flow cytometry was performed to analyze the differentiation status of CAR T cells (Day 14) treated with: 0.1% DMSO (control), 5 μM EGR1 inhibitor, or DUSP2 overexpressing cells subsequently treated with 5 μM EGR1 inhibitor. Data in (d) and (e) were presented as mean ± SD and analyzed by Student’s unpaired t-test. Data in (b, c, k, l) were presented as mean ± SD and analyzed by unpaired one-way ANOVA with multiple comparison test (*P < 0.05; **P ≤ 0.01; ***P ≤ 0.001; ****P ≤ 0.0001; NS not significant).
To test this hypothesis, we treated day-12 MUC1-Tn CAR T cells with increasing concentrations of salubrinal (a compound that downregulates DUSP2 expression in immune cells despite its canonical role as an inhibitor of eIF2α dephosphorylation [36]) for 24 h and analyzed exhaustion and differentiation markers by flow cytometry. The results showed that salubrinal treatment shifted cell phenotypes from effector and terminally exhausted states toward naïve and memory-like states (Fig. 8b), accompanied by progressively decreased exhaustion markers (TIM-3: 46.8% → 16.3%; LAG-3: 43.5% → 14.7%; PD-1: 44.6% → 23.7%, Fig. 8c). To further corroborate these findings, we generated DUSP2 knockdown MUC1-Tn CAR T cells using lentiviral shRNA (sh-DUSP2) (Supplementary Fig. 5e, f). Consistent with our hypothesis, DUSP2 knockdown promoted a more favorable differentiation phenotype, with increased central memory T cells, decreased terminally differentiated effector T cells, and significantly reduced exhaustion markers (Supplementary Fig. 5g, h). Conversely, DUSP2 overexpression produced opposite effects, promoting terminal exhaustion differentiation and upregulating exhaustion markers (Fig. 8d, e; Supplementary Fig. 5i, j). Collectively, these complementary genetic and pharmacological data establish DUSP2 as an important regulator of exhaustion in MUC1-Tn CAR T cells.
Early Growth Response Protein 1 (EGR1) is identified as an upstream regulator of DUSP2
Protein docking predictions suggested a potential interaction between DUSP2 and EGR1 (Fig. 8f). To validate this finding, we performed co-immunoprecipitation (Co-IP) followed by Western blot. EGR1-specific antibody pulled down DUSP2 from cell lysates (Fig. 8g), confirming a physical interaction. To elucidate their regulatory relationship, we used pharmacological inhibition: DUSP2 inhibitor reduced DUSP2 protein levels without affecting EGR1, whereas EGR1 inhibition diminished both EGR1 and DUSP2 abundance (Fig. 8h, i). These data indicate that EGR1 acts upstream of DUSP2 in this regulatory axis.
Linperlisib exerts an inhibitory effect on MUC1-Tn CAR T cell exhaustion by targeting the EGR1-DUSP2 signaling axis
Given that EGR1 regulates DUSP2 transcriptionally and that PI3K-AKT signaling modulates EGR1 expression, we examined whether other PI3Kδ or PI3Kδ/γ inhibitors also affect the expression of these molecules [37, 38]. To test this, we treated MUC1-Tn CAR T cells with three PI3K inhibitors (linperlisib, duvelisib, idelalisib) and assessed protein levels by Western blot. All three inhibitors reduced AKT phosphorylation, accompanied by decreased EGR1 and DUSP2 expression (Fig. 8j).
To further establish the functional relevance of the EGR1-DUSP2 axis in regulating CAR T cell exhaustion, we generated three functionally distinct CAR T cell models (control, EGR1 inhibition alone, and DUSP2 overexpression combined with EGR1 inhibition). Flow cytometric analyses revealed that EGR1 inhibition alone substantially reduced terminally exhausted cell populations and decreased exhaustion marker expression (LAG-3/PD-1/TIM-3) compared to controls (Fig. 8k, l). Notably, EGR1 inhibition alone exerted superior anti-exhaustion effects compared to combined DUSP2 overexpression with EGR1 inhibition, suggesting that DUSP2 may contribute to exhaustion through both EGR1-dependent and -independent mechanisms. Collectively, these findings identify the EGR1-DUSP2 signaling axis as an important pathway contributing to CAR T cell exhaustion and provide mechanistic insight into how linperlisib promotes CAR T cell persistence.
