


Characteristics of the patients
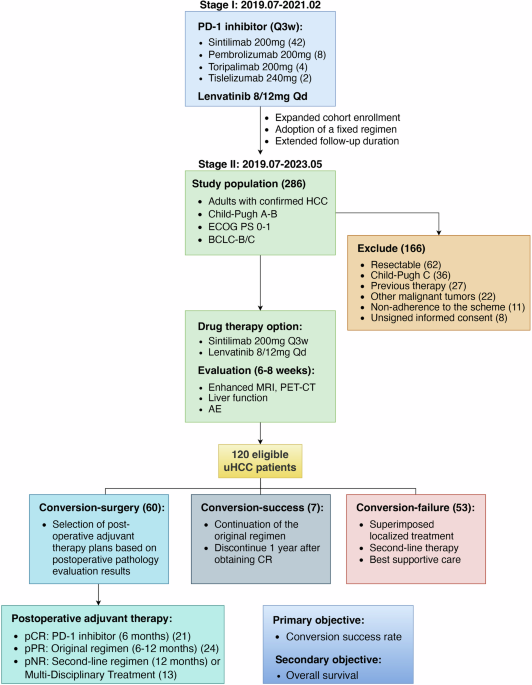
From July 2019 to May 2023, this prospective cohort study consecutively screened 286 patients with HCC. After excluding 168 individuals based on predefined enrollment criteria, 120 treatment-naïve patients with radiologically confirmed unresectable HCC received conversion therapy comprising sintilimab (200 mg IV Q3W) and lenvatinib (body weight–based oral dosing) (Fig. 1). In this cohort, the majority of patients presented with advanced-stage HCC features (Table 1): over 80% exhibited macrovascular invasion at initial diagnosis, and over 90% were classified as BCLC stage C. Approximately half demonstrated alpha-fetoprotein (AFP) levels exceeding 400 ng/mL, while 33% had extrahepatic metastases. Additionally, more than 80% of the cohort were male with concurrent hepatitis B virus (HBV) infection, more than 70% had concomitant liver cirrhosis, and over 90% exhibited Child‒Pugh class A liver function.
Fig. 1The alternative text for this image may have been generated using AI.
Enrollment and treatment. PD-1 programmed cell death protein-1, HCC hepatocellular carcinoma, ECOG Eastern Cooperative Oncology Group, PS performance status, BCLC Barcelona Clinic Liver Cancer Staging, MRI magnetic resonance imaging, PET-CT positron emission tomography/computed tomography, AE adverse events, CR complete response, pCR pathological complete response (no viable tumor cells in the resection specimens, including completely resected primary tumors, tumor thrombosis, and extrahepatic lesions), pNR pathological nonresponse (>50% viable tumor cells in the primary tumor or appearance of new lesions), pPR pathological partial response (≤50% viable tumor cells in the primary tumor)
Table 1 Baseline characteristics of the participants
The conversion rate of systemic therapy
Radiologic assessment per mRECIST and RECIST v1.1 criteria demonstrated target lesion size reduction in 93% (101/109) and 90% (100/111) of evaluable patients, respectively (Fig. 2a, b). The ORR by independent imaging review (IIR) was 58% (70/120) and 46% (55/120) for each criterion. Sixty-seven (56%, 67/120) achieved successful conversion. After MDT evaluation integrated with patient-centered decision-making, 60 (90%, 60/67) of these conversion responders underwent curative-intent hepatectomy. Notably, 85% (51/60) of the surgical group achieved curative resection criteria within 2–5 months (median 3.2 months) of protocol-directed conversion therapy. Among patients with successful conversion therapy, the median number of systemic treatment cycles administered was 5 (range 3–10), with a median treatment duration of 3.5 months (range 2–9) (Supplementary Fig. 1). Furthermore, five protocol-compliant responders experienced nonmedical treatment delays—despite meeting conversion-success standards within 48 weeks, their therapeutic trajectories extended to 14–30 months (median 19 months).
Fig. 2The alternative text for this image may have been generated using AI.
Radiographic tumor response. a Percentage change from baseline in the sum of target lesion diameters according to modified RECIST (mRECIST) criteria among 109 evaluable patients; b Percentage change from baseline in the sum of target lesion diameters per RECIST version 1.1 criteria among 111 evaluable patients. Fisher’s exact test between conversion success and radiographic response assessment, stratified by c mRECIST criteria and d RECIST version 1.1 criteria
Per the mRECIST criteria, three patients with complete radiologic regression of target lesions (100% reduction) were deemed conversion failures. This determination stemmed from protocol deviations: two underwent nonprotocol-specified local therapies during systemic treatment, while one developed new extrahepatic lesions.
Among 21 of 53 patients failing conversion therapy, salvage locoregional interventions, including transarterial chemoembolization (TACE), hepatic arterial infusion chemotherapy (HAIC), radiofrequency ablation (RFA), or radiotherapy, were administered following MDT review of tumor profiles and topographic feasibility. Achievement of successful conversion in initially unresectable HCC patients showed a statistically significant correlation with imaging-assessed treatment response under both mRECIST and RECIST v1.1 criteria (Fisher’s exact test, P < 0.001) (Fig. 2c, d).
Surgical and pathological outcomes
Among the patients who underwent hepatic resection, surgical interventions included major hepatectomy (≥3 segments, n = 34), portal vein tumor thrombectomy (PVTT) resection (n = 21), hepatic vein tumor thrombectomy (HVTT) resection (n = 3), and regional lymphadenectomy (n = 14) (Table 2).
Table 2 Surgical and pathological results
Pathologic response stratification revealed 21 (35%, 21/60) patients with pathologic complete response (pCR, 0% residual viable tumor), 25 (42%, 25/60) with pathologic partial response (pPR, ≤50% residual viable tumor), and 14 (23%, 14/60) with pathologic nonresponse (pNR, >50% residual viable tumor) (Table 2).
Survival
With a median follow-up of 41 months (95% CI, 39.5–42.5) for the entire cohort, 64 deaths (53%, 64/120) were recorded. Kaplan‒Meier estimates confirmed 12-, 36-, and 60-month survival rates of 70.8% (95% CI, 63.2–79.5), 49.1% (95% CI, 40.6 to 59.3), and 42.6% (95% CI, 34.0–53.4), respectively. The median OS was 36 months (95% CI, 25 to not estimable [NE]) (Fig. 3a).
Fig. 3The alternative text for this image may have been generated using AI.
Survival in the cohort population. a Overall survival in the entire cohort population; b Comparison of overall survival between the surgical and nonsurgical groups. NE not estimable, OS overall survival
Subgroup survival analysis revealed significantly prolonged OS in the surgical group, with estimated 12-, 36-, and 60-month survival rates of 93.3% (95% CI, 87.2–99.9), 79.2% (95% CI, 69.3–90.5), and 73.9% (95% CI, 62.7–87.1), respectively. In contrast, the nonsurgical group exhibited corresponding survival rates of 48.3% (95% CI, 37.2–62.8), 20.0% (95% CI, 11.8–33.9), and NE, with a median OS of only 12 months (95% CI, 10–25) (Fig. 3b). A total of 14 patients (23%) in the surgical group and 50 (83%) in the nonsurgical group died (stratified hazard ratio for death, 0.15; 95% CI, 0.08–0.28; P < 0.001) (Fig. 3b). Of note, baseline clinical characteristics were comparable between the surgical and nonsurgical groups (Table 1).
To avoid immortal time bias, landmark analysis demonstrated that patients who underwent sequential surgical treatment after successful conversion had significantly longer OS than those in the nonsurgical group (stratified hazard ratio for death, 0.23; 95% CI, 0.13–0.43; P < 0.001) (Supplementary Fig. 2).
Furthermore, patients in the successful conversion group also had longer OS than those in the unsuccessful conversion group (stratified hazard ratio for death, 0.15; 95% CI, 0.09–0.26; P < 0.001) (Supplementary Fig. 3a). The baseline characteristics of both groups are detailed in Supplementary Table 1. Exploratory analysis identified that nonsurgical patients achieving successful conversion (n = 7) exhibited inferior survival compared with the surgical group (adjusted P = 0.081) but superior outcomes relative to conversion failure patients (adjusted P = 0.056) (Supplementary Fig. 3b).
Univariable Cox proportional hazards regression analysis identified AFP decline during conversion therapy (HR 0.529, 95% CI, 0.406–0.688, P < 0.001), maximal tumor shrinkage ratio (RECIST v1.1: HR 0.068, 95% CI, 0.024–0.194, P < 0.001; mRECIST: HR 0.096, 95% CI, 0.04–0.231, P < 0.001), and surgical intervention (HR 0.152, 95% CI, 0.083–0.277, P < 0.001) as protective factors for OS. Conversely, baseline maximum tumor diameter (HR 1.055, 95% CI, 1.005–1.107, P = 0.031), PVTT grading (HR 1.242, 95% CI, 1.032–1.494, P = 0.022), and radiologic response categories (RECIST v1.1: HR 2.891, 95% CI, 1.93–4.332, P < 0.001; mRECIST: HR 2.622, 95% CI, 1.886 to 3.644, P < 0.001) emerged as significant risk factors for mortality (Supplementary Fig. 4a). Multivariable Cox proportional hazards regression analysis identified decreased AFP during conversion therapy (HR 0.58, 95% CI, 0.414–0.812, P < 0.01) and surgical intervention after successful conversion (HR 0.23, 95% CI, 0.11–0.483, P < 0.001) as independent protective factors for OS in patients with HCC (Supplementary Fig. 4b).
Inverse probability of treatment weighting (IPTW) analysis, used to balance patient characteristics between the surgical and nonsurgical groups, demonstrated a more significant survival benefit in the surgical group than in the nonsurgical group (Supplementary Fig. 5a-b). This finding aligns with the generally well-balanced baseline characteristics observed between the two groups.
Two patients underwent R1 resection due to incomplete tumor resection, and the median postoperative follow-up duration for the remaining 58 patients was 38 months (95% CI, 35.7–40.3). Recurrence events occurred in 26 patients (45%, 26/58), with Kaplan‒Meier estimated RFS rates of 72.0% (95% CI, 61.2–84.6), 53.0% (95% CI, 40.8–68.9), and 45.4% (95% CI, 30.5–67.8) at 12, 36, and 48 months post-operatively, respectively. The median RFS was 40 months (95% CI, 24 to not NE) (Supplementary Fig. 6). Univariable Cox proportional hazards regression analysis identified depth of pathologic response as the sole risk factor for both OS (HR 4.584, 95% CI, 1.923–10.93, P < 0.001; Supplementary Fig. 7a) and RFS (HR 2.526, 95% CI, 1.457–4.381, P < 0.001; Supplementary Fig. 7b) in the surgical group.
Survival analysis indicated statistically significant differences in OS across all pairwise comparisons of the pCR, pPR, and pNR subgroups (adjusted P < 0.05 for each) (Supplementary Fig. 8a). In contrast, RFS exhibited significant disparities only between pCR vs. pNR (adjusted P < 0.01) and pPR vs. pNR (adjusted P = 0.013) (Supplementary Fig. 8b). According to the established major pathological response (MPR) criterion (defined as at least 70% nonviable tumor cells)13, we compared outcomes among the MPR subgroup and patients with pCR, pPR, or pNR as defined in our study. The MPR subgroup demonstrated significantly superior OS and RFS compared to the pNR subgroup (adjusted P < 0.01) but showed no significant difference in outcomes compared to the pCR and pPR subgroups (Supplementary Fig. 9a-b).
Intriguingly, according to the mRECIST criteria, pCR was observed in 63% (12/19) of tumors achieving radiological CR, while only 25% (8/32) of PR-associated tumors and 12% (1/8) of SD-associated tumors attained pCR (Supplementary Table 2). By RECIST v1.1 criteria, pCR rates were 41% (16/39) in PR-associated tumors compared with 25% (5/20) in SD-associated tumors (Supplementary Table 3).
Adverse events and surgical complications
Treatment-related adverse events (TRAEs) occurred in 110 patients (92%, 110/120) during conversion therapy, with 37 patients (31%, 37/120) experiencing grade 3–5 TRAEs. The most common all-grade TRAEs included hypertension (40%, 48/120), rash (30%, 36/120), hand-foot syndrome (28%, 34/120), pyrexia (13%, 16/120), and nausea (10%, 12/120). Four patients (3%, 4/120) developed grade 4 immune-related myocarditis: two isolated cases, one concurrent with hypophysitis, and one accompanied by upper gastrointestinal bleeding. Four fatal (3%, 4/120) (grade 5) events occurred: two immune-related myocarditis cases, one gastrointestinal hemorrhage, and one complex case involving immune-related hepatitis, massive ascites, and indeterminate-cause mortality (postmortem evaluation precluded by COVID-19 quarantine restrictions).
Among surgical patients, four patients (7%, 4/60) experienced Clavien‒Dindo grade III postoperative complications, and 10 (17%, 10/60) developed grade IV complications. No mortality was attributed to surgical complications.
