


Reconstruction of RDC dataset in WSIC
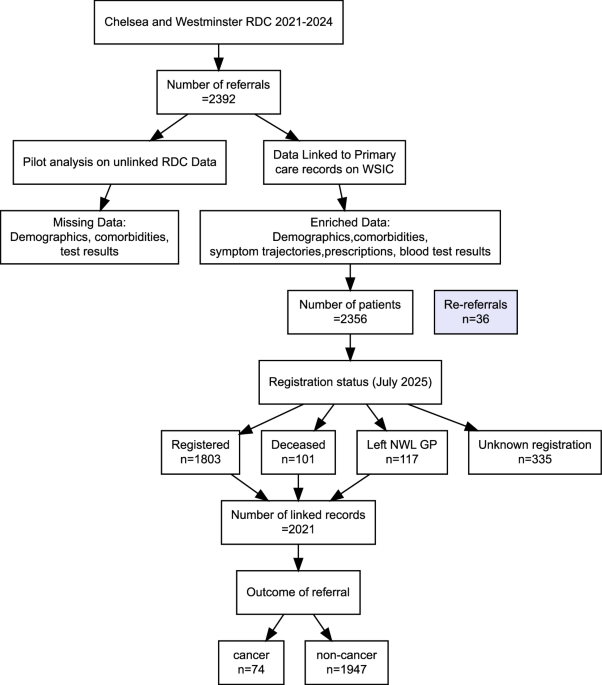
Using NHS numbers recorded in RDC dataset, we identified 2356 unique patients in WSIC, with 36 re-referrals; 2021 had available primary‑care records and were included in the analysis (accounting for unknown registrations). Summary of cohort flow and linkage outcomes is available in Fig. 1. The dedicated primary‑care SNOMED CT code for NSS (1556551000000104) captured only 253 of these referrals, with matching referral dates in both datasets and a further 54 with a small discrepancy in recorded dates (mean 6 days). Incorporating the older code (30614002), which was used until 2023, retrieved 1102 additional records. Consequently, RDC referral records were retained as the definitive source for cohort identification in this study.
Fig. 1: Cohort flow and linkage.
Flowchart of RDC referrals, linkage to WSIC primary care data, and the final analysis cohort. Denominators reflect unique patients after excluding re-referrals; Somerset system entries were used as the definitive referral source. Abbreviations: RDC Rapid Diagnostic Centre, WSIC Whole Systems Integrated Care. NWL NorthWest London
Data completeness
‘WSIC data’ improved data availability compared to the ‘RDC dataset’ for frailty (EFI ~85% vs ECOG ~1.6%), smoking (~85% vs ~1.5%), alcohol (~82% vs ~2.1%), comorbidities (~72% vs ~1%), GP visits (~84% vs ~60%) and cancer subtype (100% vs 88%) (Supplementary Table 1). Only WSIC provided access to deprivation status; intensity of alcohol and smoking consumption; quantified weight loss and the duration over which it occurred; laboratory results, prescription histories, detailed non-cancer diagnoses, re-referrals, and the temporal sequence of events from symptom onset to diagnosis, as well as subsequent outcomes after RDC discharge.
Cohort demographics
The median age at referral was 66 years [IQR 54–77]; females comprised 58%. The cohort was ethnically diverse, with 47.0% White, 20.6% Asian, and 7.1% Black, alongside representation from multiple other ethnic groups. Socioeconomic grouping showed 9.0% of patients in the most deprived IMD1st quintile, with the largest proportion (49.2%) were in the 2nd–3rd quintiles, and 28.1% in the least deprived quintiles (4th–5th). Frailty was common, with 55.2% exhibiting mild to severe frailty and 29.1% of patients classified as fit. Multimorbidity was prevalent; 18.5% having ≥5 long term conditions, hypertension and non-diabetic hyperglycaemia being most common, and 18.2% had none. Behavioural risk exposures were notable; 72.2% of patients were current alcohol consumers, although intake was predominantly trivial, and 14.7% were current smokers while 48.5% never smoked. (Supplementary Tables 2–5).
Referral criteria and symptom patterns
The most common reasons for referral recorded in the ‘RDC dataset’ were unexplained weight loss (53.7%), vague abdominal pain (6.5%), fatigue/malaise (12.6%), abnormal laboratory findings (9.9%), loss of appetite (8.1%), nausea/vomiting (2.4%), bloating (2.7%), progressive pain (2.8%), abnormal radiology (2.5%), ‘GP gut feeling’ (0.8%), and unexplained breathlessness (1.1%). ‘Other symptoms’ (32.5%) included pain at multiple sites (19%), night sweats (15%), breathlessness/cough/chest discomfort (5.4%), lumps (5.8%), dysphagia or bowel habit change (4.4%), lymphadenopathy (2.2%), acid reflux (1.0%), etc. (Supplementary Table 6). Percentages are not exclusive—patients commonly presented with more than one symptom, and individual component percentages reflect symptom‑level frequency rather than mutually exclusive patient groups.
All common NSS referral criteria were identifiable in WSIC, except ‘GP gut feeling’. Weight loss was the most common presentation, identified via SNOMED CT ‘finding’ codes in 517 patients and via measured weight change in 837. Combined, 1146 patients had evidence of weight loss, comparable to 1266 reported in the RDC dataset. Most patients lost 5–20% of baseline weight over 12 months (Fig. 2).
Fig. 2: Duration and magnitude of pre‑referral weight loss (WSIC dataset).
Distribution of patients by duration of weight loss prior to referral, stratified by percentage change from baseline weight. Bars represent counts of patients grouped by time interval (<1, 1–2, 3–5, 6–11, and ≥12 months) and coloured according to weight loss category (<5%, 5–10%, 10–20%, >20%). Weight loss categories were derived from SNOMED CT–coded clinical entries and recorded weight values. Abbreviations: WSIC, Whole Systems Integrated Care.
Qualifying attributes (e.g., ‘unexplained’ breathlessness, ‘vagueness’ of abdominal pain, ‘progressiveness’ of pain, ‘chronicity’ of cough) were not always captured from structured codes. Radiology requests (MRI/USG/CT/ X‑ray) were recognised for 624 patients, but scan results were rarely available and could not be used as coded reasons for referral.
Diagnostic outcomes
Cancer rates were similar across datasets: the RDC dataset recorded 74 cancers, versus 75 in WSIC dataset (including a case with synchronous tumours), demonstrating near-complete concordance. The most frequent cancer subtypes were lymphoma (16.0%), urological cancers (14.6%), haematological malignancies (13.3%), hepatopancreatobiliary cancers (10.6%), and lung cancer (9.3%) (Supplementary Table 7). An additional 34 patients were diagnosed with cancer during the 12‑month follow‑up, unique to ‘WSIC dataset’.
The RDC dataset recorded 311 patients with serious and 1033 with non‑serious non-malignant conditions, though diagnostic details were not available. In contrast, WSIC dataset identified 1068 benign diagnoses within 3 months of referral, with a further 245 recorded during the subsequent 3‑month extended follow‑up. Common conditions included gastritis, iron deficiency anaemia, and diabetes and its complications (Supplementary Table 8).
Longitudinal patterns and secondary outcomes
Historical symptom timing and laboratory trends were absent from the RDC dataset. WSIC reconstructed patterns showed that symptom burden increased sharply about 4 months prereferral (mean 5.3 in cancer versus 2.7 in non-cancer cases), and most symptoms emerged as early as 18–24 months before referral in non-cancer cases, particularly weight loss, abnormal laboratory findings such as anaemia and jaundice (Supplementary Table 9).
By contrast, in cancer cases, abdominal symptom presentation (pain, discomfort, bloating, nausea, vomiting) and fatigue/malaise clustered closer to referral, approximately 3–6 months pre-referral (Fig. 3a). Longitudinal trends of individual symptoms and abnormal blood test results stratified by gender and weight-loss status did not reveal distinguishing patterns between the two groups (Fig. 3b, c).
Fig. 3: Symptom and laboratory trajectories before referral to RDC (WSIC dataset).
a Timing of onset over 24 months pre-referral compared amongst those with cancer versus those not – Bubble size proportional to patient count presenting with the symptom in that month; b Monthly prevalence of selected abnormal laboratory results and symptoms ranked by frequency (e.g., anaemia, high ESR, high CRP, high ALT, high HbA1c, weight loss); abnormalities based on sex‑specific standard reference ranges; c Association of weight loss (most common presenting symptom) and abnormal blood test results with diagnosis. Analysis restricted to patients with documented weight loss prior to referral. Abbreviations: NSS non‑specific symptoms, ESR erythrocyte sedimentation rate, CRP C‑reactive protein, ALT alanine aminotransferase, HbA1c glycated haemoglobin, N&V nausea & vomiting, DVT deep vein thromboses, GI gastrointestinal, WSIC Whole Systems Integrated Care.
GP visit rates, blood test requests, abnormal test results, and prescription patterns were similar overall between cancer and non‑cancer groups across the 24-month pre-referral period (Fig. 4). GP visits ranged from 1.9 to 4.4 per person-month for patients diagnosed with cancer compared to 2.0–3.9 per person-month for those not (Supplementary Table 9). Among patients with available laboratory data, mean number of blood test requests was 29 in those diagnosed with cancer (n = 71) and 33 in those without cancer (n = 1894)(p = 0.091). Test requests rose from ~5 months pre-referral for those subsequently diagnosed with cancer (Supplementary Table 10). Mean number of abnormal test results were slightly higher in the cancer group than non-cancer group(3.6[n = 63] vs 3.0 [n = 1677]; p = 0.032); rates increased from ~4 months pre-referral for those subsequently diagnosed with cancer (Supplementary Table 10); with the most frequent abnormalities observed in Haemoglobin, CRP, ALP, and HbA1c (Fig. 3c). One hundred and thirty nine patients had abnormal QFIT; Median QFIT was 68.5 µg/g among cancer vs 26 µg/g among non-cancers; however, only 4 cancer cases had abnormal QFIT, so inference is limited.
Fig. 4: Healthcare utilisation trajectories in the 24 months before referral (WSIC dataset).
Panels show 3‑month centred moving averages of rates per person‑month for a GP visits b blood test requests c abnormal blood tests d prescriptions, stratified by eventual cancer vs non‑cancer outcome. Colours denote outcome groups as per legend. Abbreviations: GP general practice/primary‑care, WSIC Whole Systems Integrated Care.
Incident use of antacids (PPIs/H2 blockers), antibiotics, diuretics and analgesics (NSAIDs) was more common in cancer than non-cancer groups, with small absolute differences (e.g., +5.3%, +2.1%, +1.7%, +1.2%, respectively). Conversely,anxiolytics and steroids were prescribed less frequently in the cancer group (Supplementary Table 11). Polypharmacy by class count and total prescription counts were not significantly different between the groups (p = 0.528 and p = 0.321, respectively) (Supplementary Table 12). Patterns varied across cancer subtypes, but small numbers precluded formal subgroup analyses.
Factors associated with healthcare use
Given these descriptive patterns, multivariable Poisson models were used to examine predictors of healthcare activity within the 6‑month pre-referral window, and overdispersion was assessed using the Pearson χ² statistic. Where overdispersion was present (ratio >1.2), negative binomial models were fitted (Fig. 5 and Supplementary Table 13). Rates of all activity domains increased with rising symptom burden. Each additional symptom was associated with higher counts of GP visits (IRR 1.15; 95% CI 1.13–1.17, p < 0.001), blood test requests (IRR 1.26, 95% CI 1.19–1.33, p < 0.001), abnormal blood tests (IRR 1.22, 95% CI 1.15–1.28, p < 0.001) and medications issued (IRR 1.32, 95% CI 1.25–1.40, p < 0.001). Weight loss independently was associated with increased activity, including more GP visits (IRR 1.06, 95% CI 1.01–1.11, p = 0.018), blood test requests (IRR 1.64, 95% CI 1.44–1.87, p < 0.001), and abnormal results (IRR 1.63, 95% CI 1.43–1.85, p < 0.001). The interaction between subsequent cancer diagnosis status and proximity to referral was not significant, indicating similar proximal escalation in both groups.
Fig. 5: Adjusted incidence rate ratios for pre‑referral healthcare activity (6‑month window).
Forest plots display adjusted incidence rate ratios (IRRs) for pre-referral healthcare activity across four domains—GP visits, test requests, abnormal test results, and medications issued—estimated using a negative binomial regression model. Models reflect counts of healthcare domains within the 6‑month pre-referral window adjusted for age, sex, frailty, deprivation, ethnicity, comorbidity count, and symptom count. IRRs are plotted on a logarithmic scale; the vertical dashed line indicates no association (IRR = 1.0). Cancer status is included to illustrate whether escalation patterns differed between patients later diagnosed with cancer and those without cancer. Points represent adjusted IRR estimates, and horizontal bars denote 95% CI. Moderately deprived corresponds to IMD quintiles 3–4; most deprived corresponds to quintiles 1–2. Abbreviations: GP, general practice; CI, confidence interval; EFI, Electronic Frailty Index; IMD, Index of Multiple Deprivation.
Sociodemographic factors showed mixed associations: male sex was linked to slightly higher abnormal test counts (IRR 1.30; 95% CI 1.20–1.42, p < 0.001), and GP visits (IRR 1.11; 95% CI 1.08–1.14, p < 0.001); older age was associated with increased abnormal tests rate (IRR 1.14; 95% CI 1.10–1.17, p < 0.001) but lower GP visits (IRR 0.96; 95% CI 0.95–0.98, p < 0.001); non White ethnicity was associated with lower recorded GP visits (IRR 0.89; 95% CI 0.87-0.92, p < 0.001). Compared with the least deprived group, individuals in the moderately and most deprived groups had higher rates of GP visits but lower rates of test requests (Supplementary Table 13). A similar pattern was observed across increasing levels of frailty, from mild/moderate to severe frailty reflecting differences in healthcare seeking behaviour or access.
Diagnostic predictors and time-to-event analysis
Patients diagnosed with cancer were older than those without cancer (mean age 68 vs 64 years, p = 0.038), with a higher proportion aged ≥80 years (32.0% vs 17.3%). Sex distribution, frailty status, deprivation, alcohol use, smoking status, and overall comorbidity burden were similar between groups. (Supplementary Table 14–15). To identify factors associated with cancer diagnosis, we fitted a multivariable logistic regression model. Increasing age remained the strongest predictor (Fig. 6a; OR 1.22; 95%CI 1.03–1.46, p = 0.021). Patients from other ethnic groups had slightly lower odds of cancer compared with White patients, although estimates were imprecise (OR 0.54; 95% CI 0.31–0.92, p = 0.019), as were they for effect of deprivation status. Despite their clear association with pre-referral healthcare activity, neither symptom burden nor male sex was strongly associated with cancer risk (OR 1.04; 95% CI 0.97–1.12, p = 0.217 and OR 1.02; 95% CI 0.63–1.64, p = 0.929, respectively). Alcohol and smoking were excluded from the primary model to maintain parsimony; adding them in sensitivity analyses did not materially change effect estimates.
Fig. 6: Diagnostic risk and time‑to‑diagnosis among RDC referrals.
a Multivariate logistic regression: adjusted odds ratios (ORs) for cancer diagnosis by age (per 10-year increase), sex (male vs female), frailty (EFI; ordinal), deprivation (IMD quintile; ordinal), ethnic group (Other vs White), comorbidity count (number per patient) and symptom count (summed across 6 months before referral). Odds ratios are plotted on a logarithmic scale. Points represent adjusted OR estimates; horizontal bars indicate 95% confidence intervals; the vertical dashed line denotes the null value (OR = 1). The predictors were selected a priori based on clinical relevance and events per–parameter considerations. b Kaplan–Meier curve showing time to diagnosis among RDC referrals. Time zero represents the date of referral to the RDC. A log rank test compares the unadjusted time-to-diagnosis distributions between groups, with non-cancer diagnoses occurring earlier overall than cancer outcomes.
Diagnostic interval estimates from the RDC dataset indicated a median of 1 day from referral to triage, and 26 versus 29 days from triage to diagnosis for cancer and non‑cancer cases, respectively. In WSIC dataset, unadjusted Kaplan–Meier analysis (Fig. 6b) demonstrated that non‑cancer diagnoses were made earlier than cancer diagnoses, with median times of 24 days (95% CI 22–26) compared with 34 days (95% CI 29–43), a statistically significant difference (log‑rank p = 0.0491). In the adjusted Cox proportional hazards regression model (n = 74; events = 74), male sex was associated with a faster time to cancer diagnosis (HR 2.62; 95% CI 1.41–4.85, p ≈ 0.002). Conversely, patients aged ≥80 years and those with mild frailty had slower time to diagnosis (HR 0.44; 95% CI 0.23–0.86, p = 0.015 and HR 0.31; 95% CI 0.14–0.66, p ≈ 0.002, respectively). Other age bands, deprivation and ethnicity categories showed no statistically significant associations.
Overall model discrimination was moderate (concordance 0.72), and the model demonstrated good global fit (likelihood ratio test p < 0.001).
