


Cell culture
The prostate cell lines that were used in this study (PNT2, PC3, DU145, 22Rv1, LNCaP and VCaP) were purchased from American Type Culture Collection (ATCC, Manassas, USA). The HEK293T cells were a kind gift from Prof H Axelsson, Lund University. Cell lines were authenticated by Eurofins Genomics and tested regularly for mycoplasma contamination and confirmed negative. Cells were cultured according to the manufacturer’s specifications.
Transfection with small-interfering RNA (siRNA)
Cells were transfected with ADAR1-targeting siRNA (Silencer Select siRNA, Thermo Fisher Scientific, Cat. No. AM51331) or non-targeting negative control siRNA (Silencer Select Negative Control No. 1, Cat. No. 4390843) using Oligofectamine™ Reagent (Thermo Fisher Scientific, Cat. No. 2634823) according to the manufacturer’s instructions. The transfection mix was added to the cells for 5 h, after which the medium was replaced with fresh medium containing FBS. Cells were harvested or fixed 72 h post-transfection.
Inhibitor treatment
Cells were treated with 8-azaadenosine (MedChemExpress, Cat. No. HY-115686), a nucleoside analogue previously reported to affect ADAR1-mediated RNA editing, at a final concentration of 10 µM for 72 h. The compound was provided as a stock solution pre-dissolved in dimethyl sulfoxide (DMSO), and an equivalent volume of DMSO was used as a vehicle control in all experiments. Dose–response experiments were conducted using concentrations ranging from 0.6 µM to 20 µM over 24–72 h. The final DMSO concentration did not exceed 0.1% in any condition.
Stable ADAR overexpressing cell lines
Cloning of lentiviral ADAR vectors has been done previously16.Briefly, HEK293T cells were transfected ENV plasmid (pMD2G_VSV_G), PsPax2 and either PLV-ADAR1p110 WT-PuroR, PLV-ADAR1p110 mut-PuroR, PLV-ADAR1p150WT-PuroR, PLV-ADAR1p150mut-PuroR, PLV-ADAR2 WT-PuroR, PLV-ADAR2 mut-PuroR, PLV-eGFP-PuroR or PLV-empty-PuroR. Thirty hours after the start of virus collection the supernatant of the transfected HEK293T cells was collected and the recipient 22Rv1 cells were transduced with the virus supernatant. The day after the transduction, the cells transduced with the eGFP-vector were checked for successful transduction under fluorescence microscope. After two more days antibiotic selection with 0.5 µg/mL puromycin (©InvivoGen) started.
RNA extraction
Total RNA was extracted from prostate cancer cell lines using TRIzol reagent (Ambion, Carlsbad, CA, USA) according to the manufacturer’s instructions. RNA was isolated from untreated cells, as well as from cells treated with scrambled siRNA, ADAR1-targeting siRNA, DMSO (vehicle control) or 8-azaadenosine (nucleoside analogue) 72 h after transfection or treatment. RNA concentrations were measured using a NanoDrop 2000 spectrophotometer (Thermo Fisher Scientific, Wilmington, DE, USA).
Quantitative reverse transcription PCR (RT-qPCR)
Total RNA was treated with DNase I (Thermo Fisher Scientific, Vilnius, Lithuania) at 37°C for 30 min to remove genomic DNA contamination. Complementary DNA (cDNA) was synthesized using the RevertAid H Minus First Strand cDNA Synthesis Kit (Thermo Fisher Scientific, Cat. No. K1632) following the manufacturer’s protocol. The resulting cDNA was diluted and used for qPCR reaction, performed in technical quadruplicates. Quantitative real-time PCR (qPCR) was carried out using TaqMan Gene Expression Assays and TaqMan Gene Expression Master Mix (Thermo Fisher Scientific, Cat. No. 4369016) on a QuantStudio 7 Flex Real-Time PCR System (Thermo Fisher Scientific). Expression levels of ADAR (Assay ID: Hs04399610_g1) were normalized to the geometric mean of three housekeeping genes: ACTB (β-actin; Hs99999903_m1), GAPDH (Hs02758991_g1), and HPRT1 (Hs99999909_m1), using the ΔCt method.
Protein extraction
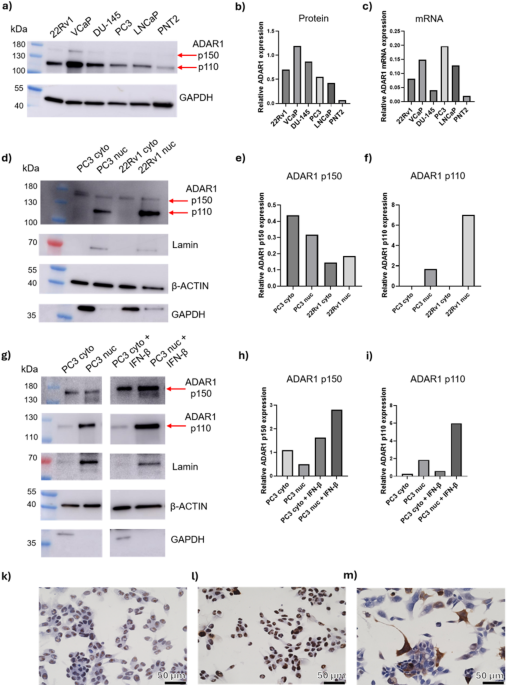
For total protein extraction, cells were washed twice with ice-cold PBS and lysed in RIPA buffer (Abcam, ab156034) supplemented with protease inhibitor cocktail (Thermo Scientific, Cat. No. 78438). Lysates were incubated on ice for 30 min with periodic vortexing, followed by centrifugation at 14,000 × g for 15 min at 4°C. Supernatants were collected, and total protein concentrations were quantified using the BCA Protein Assay Kit (Thermo Fisher Scientific, Cat. No. 23225) according to the manufacturer’s protocol. Cytoplasmic and nuclear protein fractions were isolated using the NE-PER™ Nuclear and Cytoplasmic Extraction Reagents (Thermo Scientific, Cat. No. 78835) according to the manufacturer’s instructions. Briefly, cells were harvested and washed with ice-cold PBS, followed by resuspension in Cytoplasmic Extraction Reagent I (CER I). After incubation on ice, Cytoplasmic Extraction Reagent II (CER II) was added, and samples were vortexed and centrifuged to separate the cytoplasmic fraction (supernatant). The remaining pellet was then resuspended in Nuclear Extraction Reagent (NER) and incubated on ice with periodic vortexing to extract nuclear proteins. After centrifugation the nuclear fraction (supernatant) was collected. Protein concentrations in both fractions were determined using the BCA Protein Assay Kit (Thermo Fisher Scientific, Cat. No. 23225) according to the manufacturer’s protocol. Fraction purity was verified by immunoblotting using GAPDH (cytoplasmic marker) and lamin (nuclear marker).
Western blotting
Protein lysates were prepared from prostate cancer and non-cancer cell lines treated with scramble control, ADAR1 siRNA, DMSO, or 8-azaadenosine. Total protein (10–30 µg) was mixed with 4× Laemmli buffer (Bio-Rad, Cat. No. 1610737), heated at 95°C for 5 min, and separated on 4–20% TGX™ gels (Bio-Rad, Cat. No. 4561096) alongside a protein ladder (Thermo Scientific, Cat. No. 26616). Proteins were transferred to PVDF membranes (Bio-Rad, Cat. No. 1704158) using the Trans-Blot® Turbo™ system (Bio-Rad, Cat. No. 1704150). Membranes were blocked for 1 h at room temperature in 5% blocking buffer (5% FCS, 10 g ovalbumin or BSA, 50 g non fatty dried milk powder, and 75 g glycine) in PBST, then incubated for 1 h at RT or overnight at 4 °C with primary antibodies: anti-β-actin (1:5000, Sigma, A5441), anti-GAPDH (1:10,000, Sigma, MAB374), anti-ADAR1 (1:1000, CST, 81284), and anti-ADAR1 p150 (1:1000, CST, 32136). After PBST washes, membranes were incubated with HRP-conjugated secondary antibodies (anti-rabbit, 1:2000, DAKO P0448; anti-mouse, 1:5000, DAKO P0447) for 1 h. Detection was performed using Immobilon® Classico substrate (Millipore, WBLUC0100) and imaged on an Amersham Imager 600 (GE Healthcare). Densitometry was performed in ImageJ (v1.54d).
RNA sequencing
Total RNA was extracted from 22Rv1 and LNCaP prostate cancer cell lines using the mirVana™ PARIS™ Kit (Invitrogen, Cat. No. AM1556) according to the manufacturer’s protocol. RNA concentration and purity were initially assessed with a NanoDrop 2000 spectrophotometer (Thermo Fisher Scientific), and RNA integrity was evaluated with the Agilent 2100 Bioanalyzer (Agilent Technologies, Santa Clara, CA, USA). Only samples with an RNA Integrity Number (RIN) ≥ 8.0 were used for downstream analysis. RNA concentration was quantified by the fluorometric Qubit™ RNA High Sensitivity (HS) Assay Kit (Invitrogen, Cat. No. Q32852). RNA sequencing was performed using three independent replicates for each experimental condition.
Library preparation and paired-end 150 bp sequencing, targeting approximately 25 million reads per sample, were performed at the Center for Translational Genomics, Lund University, and Clinical Genomics Lund (SciLifeLab) using an Illumina NovaSeq 6000 platform. Polyadenylated mRNA was enriched from 500 ng of total RNA using oligo(dT) magnetic beads. Strand-specific libraries were prepared using the Illumina Stranded mRNA Prep, Ligation kit according to the manufacturer’s instructions. RNA sequencing data were analysed in R software (v4.4.1). Differential expression analysis was performed using the DESeq2 package (v1.44.0;)40. Genes with an adjusted p-value < 0.05 and |log2 fold change| > 1 were considered significantly differentially expressed. Gene Set Enrichment Analysis (GSEA) was performed using the ClusterProfiler R package (v4.12.6)41 with the Hallmark gene sets (MSigDB H collection). Genes were ranked by log₂ fold-change from the differential expression analysis. Gene sets with 15–500 genes were tested, and pathways with FDR q < 0.05 were considered significantly enriched. Overrepresentation analysis (ORA) was performed on 42 genes showing opposite expression changes upon ADAR1 silencing and ADAR1 p150 overexpression in 22Rv1 cells from our bulk RNA-seq (p-value < 0.05). Analysis was conducted in Cytoscape (v3.10.4)42 using the STRING app (v2.2.0)43 with STRING database annotations. The whole genome was used as background. Enrichment was assessed across GO, KEGG, Reactome, and WikiPathways, with FDR-adjusted p-values. Pathways with FDR < 0.05 were considered significant.
Dual transfection and luciferase reporter assay
A-to-I editing levels were evaluated using pCA959 ADAR reporter plasmids, as previously described by Fritzell et al.44. This reporter contains a modified GluA2 editing substrate in which NanoLuc luciferase is only expressed upon ADAR-mediated editing. pCA959 positive and negative control plasmids were included. The reporter plasmids were kindly provided by Albin Widmark and the late Marie Öhman (Stockholm University, Sweden). To assess the impact of ADAR1 silencing on editing activity, 22Rv1 cells were co-transfected with ADAR1 siRNA or scrambled siRNA together with pCA959 plasmids using DharmaFECT Duo (Horizon Discovery). Cells were seeded at 2 × 10^5 cells/well in 12-well plates and transfected with 5 µg plasmid DNA and 100 nM siRNA. After 5 h, transfection medium was replaced with normal growth medium, and cells were cultured for 72 h. Firefly and NanoLuc luciferase activities were measured using the Nano-Glo® Dual-Luciferase® Reporter Assay System (Promega) on a Wallac Victor2 1420 reader (PerkinElmer). Editing activity was calculated as the NanoLuc/Firefly ratio. Positive and negative reporter controls were included to validate assay performance but were not included in statistical hypothesis testing.
SRB assay for cell growth
Cell growth was assessed using the sulforhodamine B (SRB) assay. Cells were seeded in either 96-well or 6-well plates and transfected with either scrambled siRNA or ADAR1 siRNA or treated with DMSO (control) or 8-azaadenosine (inhibitor) for 24, 48 and 72 h. After the indicated timepoints, cells were fixed with ice-cold 10% trichloroacetic acid (TCA) (Thermo Fisher Scientific, Cat. No. A11156.36) for 1 h on ice or overnight at 4 °C. The fixed cells were stained with 0.4% SRB (Sigma-Aldrich, Cat. No. 230162) in 1% acetic acid for 15 min at room temperature. Unbound SRB was washed away with 1% acetic acid, and the bound SRB was solubilized with 10 mM Tris base. Absorbance was measured at 490 nm using a Synergy 2 plate reader (BioTek Instruments, Winooski, VT, USA).
Adhesion assay
Adhesion assays were conducted in 12-well plates three days after transfection with scramble or ADAR1 siRNA, or treatment with 8-azaadenosine. Wild-type cells were seeded at 1 × 10⁵ cells/well one day prior to the assay. Treated cells were detached using Versene (Thermo Fisher, Cat. No. 15040066), pelleted at 300 × g for 5 min, and stained with 1 mL BCECF-AM (1:400 in PBS) (Thermo Fisher, Cat. No. B3051) at 37 °C for 15 min. After washing, cells were resuspended at 8 × 10⁴ cells/mL, and 500 µL was added per well containing a wild-type monolayer. Plates were incubated at 37 °C for 3 h. Following incubation, wells were washed and lysed with 100 µL of 1× Passive Lysis Buffer (Promega, Cat. No. E1941) for 15 min at room temperature on a shaker. Lysates (50 µL) were transferred to a 96-well plate, and fluorescence was measured (excitation: 490 nm, emission: 535 nm). Adhesion was normalized to a control aliquot lysed prior to seeding.
Flow cytometry for apoptosis and proliferation analysis
Flow cytometry was used to assess apoptosis and proliferation in prostate cancer cells treated with scrambled siRNA, ADAR1 siRNA, DMSO, or 8-azaadenosine (10 µM) for 72 h. For apoptosis analysis, cells were stained using the Annexin V-FITC Apoptosis Detection Kit (Thermo Fisher Scientific, Cat. No. V13241) according to the manufacturer’s protocol. Briefly, cells were collected, washed with PBS, and stained with Annexin V-FITC and propidium iodide (PI) for 15 min at room temperature in the dark. After staining, cells were analysed by flow cytometry using a BD Accuri C6 instrument (BD Biosciences) to quantify apoptotic populations. Annexin V fluorescence was detected in the FITC channel, while PI fluorescence was detected in the PE channel, allowing discrimination between viable, early apoptotic, late apoptotic, and necrotic cells. For proliferation analysis, cells were stained with the Click-iT™ EdU Flow Cytometry Assay Kit (Thermo Fisher Scientific, Cat. No. C10425) to measure DNA synthesis. Cells were incubated with 10 µM EdU for 2 h, then fixed and permeabilized. EdU incorporation was detected using an Alexa Fluor 488–conjugated azide via the Click-iT™ reaction, following the manufacturer’s instructions. After staining, cells were analysed by flow cytometry, and Alexa Fluor 488 fluorescence was collected in the FITC channel to assess DNA synthesis as a marker of proliferation. For DNA content cell cycle analysis, cells were stained with SYTOX® AADvanced™ dead cell stain (Invitrogen, Cat. No. S10349), combined with RNase A treatment (20 mg/mL, Invitrogen Cat. No. 12091), following the manufacturer’s instructions. The signal was detected in PerCP-Cy5.5 channel and the cell cycle profiles were compared between the conditions. Additionally, dual-parameter analysis of Click-iT™ EdU and SYTOX® AADvanced™ fluorescence was performed to confirm EdU incorporation during the S phase of the cell cycle. Data were collected from at least 10,000 events per sample, and analysis was performed using FlowJo software (version 10.10.0; FlowJo LLC, Ashland, OR, USA).
Immunocytochemistry
22Rv1 prostate cancer cells stably overexpressing ADAR1 (p110 or p150) or empty vector controls were seeded at 2 × 10⁴ cells/well on poly-D-lysine-coated 4-well chamber slides. After overnight attachment at 37 °C, cells were fixed with 4% paraformaldehyde for 5 min, permeabilized with 0.1% Triton X-100 in DPBS for 5 min and blocked with 5% BSA in DPBS for 1 h at room temperature. Cells were incubated overnight at 4 °C with anti-ADAR1 antibody (Cell Signalling Technology, Cat. No. 81284), followed by a 1 h incubation with HRP-conjugated secondary antibody (1:2000, DAKO P0448). Detection was performed using DAB substrate, and slides were mounted and imaged by brightfield microscopy.
Patient cohorts
ADAR1 expression levels in prostate cancer patients were evaluated using two independent, publicly available datasets. Transcriptomic data (GEO accession GSE21034) consisted of gene expression profiling by array from benign tissue (n = 29), primary tumours (n = 131), and metastatic lesions (n = 19)27. Proteomic data (PRIDE accession PXD009868) included mass spectrometry protein expression levels from benign tissue (n = 8), primary tumours (n = 28), and bone metastases (n = 22)28. Protein expression levels in patient samples were quantified using a super-SILAC (stable isotope labelling with amino acids in cell culture) approach and their levels were presented as normalized SILAC ratios. ADAR1 expression was analysed to compare transcript and protein levels across disease stages. For analysis of ADAR1 expression in mCRPC, we used a cohort formed by Feng et al., comprising combined and batch-effect corrected gene expression data from four different mCRPC cohorts29. In our analysis, we compared the gene expression levels of ADAR1 in primary site (n = 27) to bone (n = 168) or lymph node (n = 253) metastatic sites. Additionally, a tissue microarray (TMA) constructed from 230 patients with hormone-naïve, localised prostate cancer treated with radical prostatectomy at Skåne University Hospital, Malmö, between 2004 and 201945 was subjected to immunohistochemistry. For metastatic tissue assessment, ADAR1 immunohistochemistry was also performed on a limited set of metastatic prostate cancer samples (n = 5) collected at Skåne University Hospital and provided by Dr A Bjartell. These metastatic samples were used for representative histological evaluation only and were not included in quantitative statistical analyses. All participants gave written informed consent, and the study was approved by the Lund University Ethical Committee (2016/1030, 2018/937, 2020/00669 and 2012/22) in accordance with the Declaration of Helsinki. Clinical and pathological data were obtained from electronic health records.
Immunohistochemistry
TMA paraffin blocks were sectioned at 4 μm thickness, mounted on glass slides, deparaffinized with xylene and graded ethanol, and rehydrated in distilled water. Antigen retrieval was performed using a PT-Link module (DAKO, Glostrup, Denmark) at 95–99 °C for 20 min in pH 6.0 buffer. Immunohistochemical staining for ADAR1 was performed using a DAKO Autostainer Plus system and the EnVision FLEX detection kit (DAKO, Glostrup, Denmark), which includes Peroxidase-Blocking Reagent. Primary staining was carried out using an anti-ADAR1 antibody (Cell Signalling Technology, Cat. No. 81284) at a dilution of 1:400. Procedures for verification of antibody specificity have been previously described45. Slides were scanned using an Aperio CS2 slide scanner (Leica Biosystems) and analysed with HALO software (Indica Labs). Scoring of cellular staining intensity and proportion of positive cells was carried out by two independent scorers (SK and MP) as previously described46. Briefly, staining intensity and the proportion of stained cells were each scored on a 3 − 0 scale, and the final H-score (0–9) was calculated by multiplying the intensity with the proportion score (range 0–9).
Statistical analysis
All statistical analyses were performed using GraphPad Prism version 10.2 (GraphPad Software, CA, USA) and R software (v4.4.1). Differences between two groups were evaluated using unpaired two-tailed Student’s t-tests for normally distributed data, or the Wilcoxon rank-sum test for non-parametric data. For paired data, the Wilcoxon signed-rank test was used. For comparisons involving more than two groups, the Kruskal–Wallis test followed by Dunn’s post-hoc test was used. For zone-based comparisons the Skillings–Mack test for incomplete paired data was used, followed by pairwise Wilcoxon signed-rank tests with Holm correction for multiple testing. For ordered ISUP grade groups, the Jonckheere–Terpstra trend test was used. Differential expression analysis of RNA-seq data was performed using DESeq240, and genes with an adjusted p-value < 0.05 and |log2 fold change| > 1 were considered significantly differentially expressed. Gene Set Enrichment Analysis (GSEA) was performed using standard algorithms, and significance was determined based on false discovery rate (FDR q < 0.05). Overrepresentation analysis of 42 genes oppositely regulated upon ADAR1 silencing and ADAR1 p150 overexpression was conducted with Cytoscape (StringApp)42,43 and pathways with FDR < 0.05 were considered significantly enriched Survival analyses were performed using Cox proportional hazards regression models. Univariable and multivariable Cox regression analyses were conducted to assess the association between variables and biochemical recurrence-free survival. Hazard ratios (HRs) with 95% confidence intervals (CIs) were calculated. All tests were two-sided, and a p-value less than 0.05 was considered statistically significant. Significance levels are depicted in the figures as follows: *p < 0.05, **p < 0.01, ***p < 0.001, ****p < 0.0001.
