


Ethical regulations
PDX models used in this study were derived from the BTBC (Breakthrough Breast Cancer) study. BTBC is a longitudinal blood and tissue sampling protocol conducted alongside standard of care therapy in breast cancer patients. Written informed consent was given by patients and the study conducted according to the UK National Health Research Authority (HRA) approved protocol originally reviewed at the London—Chelsea Research Ethics Committee (REC No: 13/LO/1248 and conducted at Guy’s & St Thomas’ Hospital). Animal studies received ethical approval from King’s College London (KCL) Animal Welfare Ethical Review Body (AWERB) and the UK Home Office (PPL PF642A32A).
Cell lines
The following cell lines were obtained from ATCC: CAPAN1, MDAMB436, MDAMB231, HCC1954, RPE-1 and SUM149. SUM159 were from Asterand, HMEC and MTSV1.7 from Thermofisher, MCF10A, DLD1 and DLD1 BRCA2−/− cell lines from Horizon Discovery Inc. RPE-1 p53−/− and RPE-1p53−/−; BRCA1−/− were a gift from D. Durocher18. BARD1AID/AIDHCT116 cell line was kindly gifted by R. Chapman20. Brca1Sco/Δ mES and the HAP1BRCA1-AID cells were a gift from J. Jonkers44. SUM149Reverted and CAPAN1Reverted were generated as previously described17 and SUM149 (Sg exon 22) were a gift from N. Johnson16. SUM149 53BP1−/− are described in Noordermeer et al.18. Cell lines were derived from female donors (MDA-MB-436, MDA-MB-231, HCC1954, SUM149, SUM159, HMEC, MTSV1-7, MCF10A, RPE-1) or male donors (CAPAN-1, DLD-1, HCT116, HAP1); mES cells are murine. The study uses these as experimental models and findings are not sex specific.
All cells were grown according to supplier’s recommendation and authenticated by means of Short Tandem Repeat (STR) analysis (PowerPlex® 1.2 System, Promega, WI, US) according to the manufacturer’s instructions. STR profiles were matched to the German Collection of Microorganisms and Cell Cultures (DSMZ)—database (www.dsmz.com). At monthly intervals, Mycoplasma testing of cell cultures was carried out using the MycoAlert Mycoplasma Detection Kit (Lonza).
Small interfering RNA (siRNA) and small hairpin RNA (shRNA)
Three different Human Silencer® Select siRNAs targeting PUM3 were purchased from Ambion (ID: s19272, s19273 and s19274, labelled si1, si2 and si3 respectively). siRNA transfections were performed as previously described using transfection conditions optimised for each cell line to provide minimal non-specific toxicity45. Two different PUM3-targeting human GIPZ lentiviral shRNA clones (ID: V2LHS_233677 and V2LH_95830, shRNA-1 and shRNA-2, respectively) and a non-targeting shRNA (ID: RHS4346) were also used (ThermoFisher) as well as the following doxycycline-inducible short hairpin RNAs (shRNA) lentiviral vectors (Mirimus):
shPUM3-1D (Doxycycline-inducible)
TGCTGTTGGCAGTGAGCGCAGGTCCTATTGTACTTACTAATAGTGAAGCCACAGATGTATTAGTAAGTACAATAGGACCTTTGCCTACTGCCTCGGA.
shPUM3-2D (Doxycycline-inducible)
TGCTGTTGGCAGTGAGCGCACAGTACGAGAAATCATTGAATAGTGAAGCCACAGATGTATTCAATGATTTCTCGTACTGTATGCCTACTGCCTCGGA.
To silence murine PUM3 in organoids, GIPZ lentiviral shRNA clones V2LMM_89259 and V2LMM_195685 (Horizon Discovery) were used, referred to as shRNA-1 and shRNA-2, respectively.
Lentiviral particles were produced from shRNA expression constructs in HEK293T cells using pSPAX2 and pMD2.G packaging vectors. Infected cells were selected with 1.5 μg/ml puromycin for at least three days prior to experiments and knockdown was confirmed by western blot. The doxycycline inducible PUM3 shRNA-siRNAs rescue construct was generated by introducing six synonymous mutations into the shRNA-2 targeting sequence of the PUM3 cDNA and additional seven synonymous mutations into the siPUM3-1, siPUM3-2 and siPUM3-3 targeting sequences and then cloning the mutated cDNA into pINDUCER 20 as previously described45. For PUM3 overexpression in HAP1 and mES cells, PUM3 cDNA was inserted either into a modified version of pCW57.1 (Addgene #41393) containing a blasticidin resistance cassette or pLex305 (Addgene #41390) using Gibson assembly. The pET52b-His-SUMO-PUM3 vector was designed for bacterial expression of recombinant PUM3 protein. The construct includes an N-terminal 6×His tag for affinity purification, followed by a SUMO tag to enhance solubility and proper folding. A human rhinovirus (HRV) 3C protease cleavage site is positioned between the SUMO tag and the PUM3 coding sequence, allowing for precise removal of the fusion tags post-purification. The vector is driven by a T7 promoter for high-level expression in E. coli.
Western blotting and Jess Simple capillary western blot
Cells were lysed in RIPA lysis and extraction buffer (Thermo Fisher Scientific) supplemented with 1 tablet/10 ml lysis buffer of cOmplete™ and EDTA-free Protease Inhibitor Cocktail (Roche). Lysates were generated on ice, centrifuged 10 min at 16,900 × g prior to supernatant collection and concentration was assessed using BCA Protein Assay Kit according to the manufacturer’s instructions (#23225, Thermo Fisher Scientific).
Jess reagents were prepared according to the manufacturer’s instructions. For Jess Simple capillary western blot, 0.4–1 µg protein was denatured using manufacturer-provided buffer (DTT-based) and loaded in Jess™ multiwell plates using the ProteinSimple 12–230 kDa Separation Module (SM-FL004, BioTechne). Anti-Rabbit Detection Module or Anti-Mouse Detection Module (DM-001 and DM-002, BioTechne) were used according to the manufacturer’s instructions. For detection on NIR channel Goat anti-Mouse IgG (H + L) Secondary Antibody [DyLight 650] and Goat anti-Rabbit IgG (H + L) Secondary Antibody [DyLight 650] (NBP1-75147C and NB7156C, Novus Biologicals) were multiplexed with the HRP secondary antibodies. Images were obtained and analysed using Compass software for Simple Western (ProteinSimple).
Western blotting was performed as previously described46 using the following antibodies: PUM3 (HPA002353, Sigma-Aldrich, 1:250); beta actin (A3854, Sigma-Aldrich, 1:5000); beta actin (#3700, Cell Signaling Technology, 1:25 for Simple Western assays), mouse PUM3 (67941, Proteintech, 1:1000 for Simple Western assays), HA-tag (#2367, Cell Signaling Technology, 1:1000 for western blot; 1:100 for Simple Western assays), BARD1 (ab50984, Abcam, 1:500), PARP1 (#9542, Cell Signaling Technology, 1:1000), FANCD2 (ab108928, Abcam, 1:500), APEX2 (SAB1400507, Sigma-Aldrich, 1:250), Polθ (MBS9612322, MyBiosource, 1:500), Vinculin (c-73614, Santa Cruz 1:50 for Simple Western assays), GAPDH (ab8245, Abcam, 1:1000), phospho-γH2Ax (05-636, Millipore, 1:1000), BRCA1 (OP92, Merck, 1:1000), HA (H9658, Merck, 1:1000), H3 (ab1791, abcam, 1:2000).
Immunofluorescence and confocal microscopy
Experiments were performed in black-sided, clear-bottom 96-well ViewPlates (PerkinElmer). PUM3 knockdown with siRNA was performed as described and cells were fixed for 10 min with 4% PFA 96 h post-transfection. Cells were permeabilised for 10 min with 0.5% Triton X100 and incubated with the following primary antibodies: γH2Ax (05-636, Millipore, 1:500), RAD51 (ab133534, Abcam, 1:500), PUM3 (HPA002353, Merck, 1:250), HA (#3724, Cell signaling, 1:1000) overnight at 4 °C and stained with Alexafluor 488 and Alexafluor 555 secondary antibodies (Abcam, 1:1000) for 1 h at room temperature. Nuclei were stained with DAPI and plates imaged using the ImageXpress high content confocal microscope (Molecular Devices) and DNA damage foci quantified using the MetaXpress software (Molecular Devices).
Immunoprecipitation of GFP-Tagged PUM3
DLD1 cells were transiently transfected with either the pEGFP-N1 empty vector or pEGFP-N1 encoding PUM3 fused to GFP. Forty-eight hours post-transfection, GFP-tagged proteins were immunoprecipitated using GFP-Trap magnetic particles (Proteintech). Cells were lysed on ice in 500 μL of lysis buffer (50 mM Tris-Cl pH 7.5, 150 mM NaCl, 1 mM EDTA, 0.6% Igepal; pH adjusted at 4 °C) supplemented immediately before use with 1× protease inhibitor cocktail, 1 mM DTT, and 1 μL Benzonase. Lysates were incubated at 4 °C for 30 min with rotation, briefly sonicated and clarified by centrifugation. GFP-Trap beads were equilibrated by resuspension in 500 μL ice-cold dilution buffer (10 mM Tris-Cl pH 7.5, 150 mM NaCl, 0.5 mM EDTA; pH adjusted at 4 °C), followed by magnetic separation. Clarified lysates were incubated with pre-cleared beads for 1 h at 4 °C with rotation. After incubation, beads were washed five times with wash buffer (10 mM Tris-Cl pH 7.5, 150 mM NaCl, 0.05% Igepal, 0.5 mM EDTA; pH adjusted at 4 °C), transferring beads to a fresh tube during the final wash. Bound proteins were eluted by resuspending beads in 50 μL 2× SDS sample buffer (Laemmli) and boiling for 5 min at 95 °C. Eluates were separated by SDS–PAGE and analysed by immunoblotting.
DNA fibre assays
Cells were transduced with PUM3 targeting or non-targeting and DNA fibre assays performed as previously described47. 5-Chloro-2’-deoxyuridine (CldU) and 5-Iodo-2’-deoxyuridine (IdU) fibre lengths were measured for ongoing forks that contained both labels and fork rate was determined by measuring length in μm; the length was then converted to kb using the commonly used conversion factor of 2.59 kb per μm. This was then divided by the labelling time to generate fork rate. The stalled forks were fibres that only incorporated the first label (IdU) and percentage was calculated relative to the total number of fibres counted.
Proximity ligation assay (PLA)
For PLA cells were seeded into 96 well plates and pulse-labelled with 10 μM Ethynyl Deoxyuridine (EdU) for 10 min to label nascent DNA or 500 μM Ethynyl Uridine (EU) to label nascent RNA. For transcriptional experiments cells were treated with 200 μM 5,6-dichloro-1-β-D-ribofuranosylbenzimidazole (DRB) for 6 h or 50 μM Cordycepin for 3 h prior to and during nascent DNA labelling. Subsequent to labelling, cells were permeabilized with 0.5% Triton for 10 min at 4 °C, fixed at room temperature with 3% formaldehyde, 2% sucrose in PBS for 10 min. EdU-biotin labelling was performed as per manufacturer’s instructions (Click-it EdU, Thermofisher). Cells were then washed twice with PBS and 40 μl of antibodies diluted appropriately in 0.1% Saponin, 1% BSA in PBS added to each well. Primary antibodies were incubated overnight at 4 °C using the following: PUM3 (HPA002353, Sigma-Aldrich, 1:250), RNAPII (ab193468, Abcam, 1:500) Biotin (200-002-211, Jackson ImmunoResearch, 1:2000), PCNA (sc-7907, Santa Cruz, 1:500), HA-tag (#3724, Cell Signaling Technology, 1:1000), TOP1 (sc-32736, Santa Cruz, 1:250). PLA probe binding and labelling was performed as per manufacturer’s instructions (Thermofisher). Subsequent to PLA cells were labelled with DAPI to stain nuclei and Alexa Fluor 488 secondary antibody (A32723, Abcam, 1:1000) to visualise EdU/EU staining. Confocal microscopy was performed using an advanced spinning disk confocal system (3i) and PLA foci were quantified manually.
PDX models
Snap-frozen patient-derived xenograft (PDX) tumour samples were obtained from our biobank and generated as previously described48,49,50.
Human breast tumour samples used to establish these PDX models were collected from adult female patients after written informed consent as part of the non-interventional BTBC study (REC reference13/LO/1248; IRAS ID 131133; Principal Investigator: Prof. Andrew Tutt; Analysis of functional immune cell stroma and malignant cell interactions in breast cancer in order to discover and develop diagnostics and therapies in breast cancer subtypes). The study was approved by the local Research Ethics Committee and conducted in accordance with the Declaration of Helsinki.
All animal experiments were performed under UK Home Office Project Licence PF642A32A (Protocol 3, Subcutaneous or Mammary Fat Pad Models) following approval by the King’s College London Animal Welfare and Ethical Review Body (AWERB) and the UK Home Office. No in vivo experiments were performed as part of the present study; only frozen PDX tumour material obtained from the biobank was used for downstream molecular analyses.
Cryopreserved PDX models (KCL015A, KCL003, KCL014 and KCL008) were thawed at 37 °C, pelleted by centrifugation and resuspended in dissociation buffer containing 2 mg mL⁻¹ Collagenase IV and 4 U mL⁻¹ DNase I in complete culture medium. Samples were incubated at 37 °C with shaking for 45 min, with intermittent vortexing and trituration every 10–15 min. Dissociated cells were diluted with culture medium, filtered through a 40-µm cell strainer, centrifuged, washed in PBS, deposited onto glass slides by cytocentrifugation, fixed in 4% paraformaldehyde for 10 min at room temperature and processed for PLA as described above.
Isolation of proteins on nascent DNA (iPOND)
iPOND was performed as previously described51. Briefly, SUM149 cells stably expressing GFP-PUM3 were cultured under standard conditions and subjected to the isolation of proteins on nascent DNA (iPOND) protocol. Cells were treated with either vehicle control, 10 μM EdU for 30 min (EdU), EdU followed by 1 μM camptothecin (EdU+CPT), or EdU followed by a thymidine chase (Chase). After treatment, cells were fixed and subjected to click chemistry to conjugate biotin to EdU-labelled DNA. Proteins associated with replication forks were isolated using streptavidin pull-down and analysed by Western blot. PUM3 was detected using anti-PUM3 antibody, while PCNA and Histone H3 served as positive controls for replication fork and chromatin association, respectively. The following antibodies were used for iPOND; PUM3 (HPA002353, Sigma-Aldrich, 1:250), PCNA (PC10, Abcam, 1:1000) and Histone H3 (3H1, Cell Signaling Techonology, 1:5000).
Rapid immunoprecipitation mass spectrometry of endogenous proteins (RIME)
RIME was performed by Active Motif according to a published protocol52. In brief, formaldehyde-fixed (methanol-free) cell pellets were processed by Active Motif (Carlsbad, CA, USA). Chromatin was isolated, sonicated to 300–500 bp fragments, and 150 µg of chromatin was immunoprecipitated with anti-GFP antibody (Evrogen AB121). Following on-bead trypsin digestion, peptides were analysed by LC–MS/MS on a Thermo Scientific Q Exactive Orbitrap mass spectrometer coupled to a Dionex Ultimate 3000 UHPLC. MS data were processed using PEAKS Studio (v11) and searched against the UniProt human and cRAP databases with decoy-based FDR control. Proteins were filtered based on spectral counts (≥5 per replicate), unique peptide counts (≥3 per replicate), and enrichment over IgG controls, and enriched proteins were subjected to functional annotation using the PANTHER database. RIME was performed in SUM149 cells with an endogenously GFP-tagged PUM3 (SUM149PUM3-GFP). SUM149PUM3-GFP was generated using the previously described CRISPaint method and the following guide RNA sequence: CCAGAGTTGTGACCTGGAAG53. CRISPainted cells were GFP sorted and single-cell clones expanded and sequenced to confirm tagging. RIME was performed with a GFP antibody (AB121, Evrogen) in SUM149PUM3-GFP and SUM149 as a negative control. Candidate interactors were ranked according to the Log2 ratio of protein abundance in SUM149PUM3-GFP compared to SUM149.
Cell-based assays
Cell viability was assessed 7 days after siRNA transfection using CellTiter-Glo Luminescent Cell Viability Assay (Promega) as per the manufacturer’s instructions. Clonogenic assays were performed for 14 days, at which point colonies were fixed with Trichloroacetic Acid (TCA) and stained with sulforhodamineB (SRB). Colonies were counted and surviving fractions calculated by normalising colony counts to colony numbers in non-targeting siRNA wells. Cell cycle transit time was assessed using timelapse microscopy using an Incucyte s2 (Essen Bioscience) and a 20x lens imaging every 30 min for a period of 72 h, Metaphase to metaphase time was quantified manually. To assess the effect of PUM3 overexpression in HAP1 or mES cells, 2000 cells were plated into 6-well plates, exposed to indicated concentrations of compounds and viability was assessed after 7 days using CellTiterBlue (Promega). Incucyte® Classic Confluence Analysis Workflow was used to analyze real-time cell growth.
R loop assays
Total nucleic acids were extracted with the DNeasy Blood and Tissue kit (QIAGEN) following the manufacturer’s instructions. 10 μg of DNA were digested overnight with a cocktail of restriction enzymes (BSrGI, EcoRI, HindIII, SspI, XbaI), cleaned with Phenol: chloroform and spotted directly on a positively charged Nylon membrane (Amersham). Another 10 μg of genomic DNA was treated with 2 U of RNaseH (NEB, M0297L) per mg of DNA for 6 h at 37 °C as negative control. The membrane was blocked in TBST + 5% milk and probed with the mouse S9.6 antibody (1:1000, Merck MABE1095) overnight at 4 °C after UV-crosslinking (0.12 J/m2). Images were acquired with Azure 600 (AzureBiosystems) and quantified using Image J.
Electrophoretic mobility shift assay (EMSA)
EMSA was performed to assess the binding of HIS-SUMO-3C-PUM3 to nucleic acid substrates. HIS-SUMO-3C-PUM3 was expressed from the pET52b-His-SUMO-PUM3 vector, which encodes an N-terminal His₆ tag for affinity purification, a SUMO tag to enhance solubility, a 3 C protease cleavage site, and full-length PUM3. Binding reactions were carried out in a buffer containing 10 mM Tris-HCl (pH 7.5), 50 mM KCl, 1 mM DTT, and 5% glycerol. Reactions included 10 nM of either 48mer double-stranded DNA (dsDNA) or DNA:RNA hybrid and increasing concentrations of HIS-SUMO-3C-PUM3 (0–25 μM). Samples were incubated at room temperature for 30 min and resolved on a 6% native polyacrylamide gel in 0.5× TBE buffer. Gels were run at 100 V for 1.5 h at 4 °C and subsequently imaged using a fluorescence scanner. Band intensities were quantified to determine the percentage of bound substrate, and binding curves were fitted to calculate apparent dissociation constants (Kd).
AlphaFold Multimer analysis
AlphaFold v2.3.2 (AlphaFold Multimer/AFM) was used54 to predict how PUM3 (Q15397) and TOP1 (P11387) might interact. AFM was run with default settings and model relaxation disabled, yielding five models for the PUM3-TOP1 interaction. We ranked models based on the pDockQ metric55. Three models were low confidence (pDockQ <0.23), and the remaining two models (PUM3_TOP1_1 and PUM3_TOP1_3) had pDockQ values of 0.481 and 0.537, respectively. Since the interaction suggested by PUM3_TOP1_3 resulted in a clash with the experimentally determined structures of DNA-bound PUM3 and TOP1, we focused on PUM3_TOP1_1, which predicted that the C-terminus region of PUM3 could directly interact with TOP1 via an unstructured loop in PUM3 (aa 536-554) found between Pumilio 9 and Pumilio 10 repeats.
DNA copy number and gene expression analysis
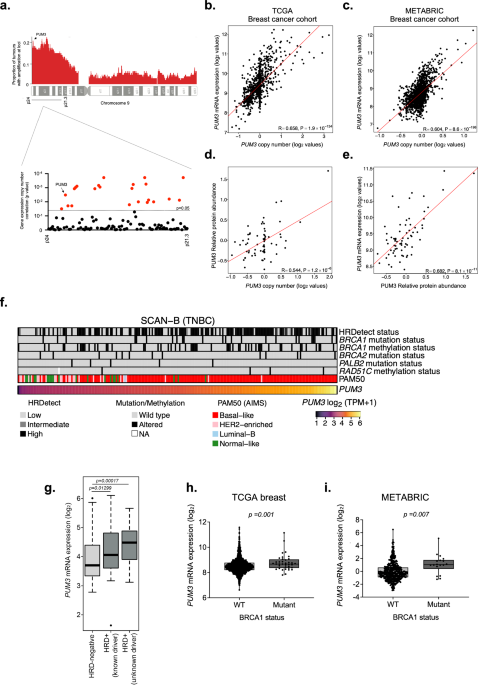
All microarray analyses were performed in the R software environment (www.r-project.org/). Gene expression and DNA copy number levels of 9p were investigated in our published breast cancer cell lines data56 as well as in 111 basal-like breast cancers57,58. Pre-processed public breast cancer datasets (TCGA BRCA, METABRIC and SCAN-B) as described previously59,60 were used for assessing PUM3’s mRNA, copy-number and protein profiles.
Spheroid assay
MDAMB436 transduced either with the two doxycycline (DOX)-inducible PUM3 shRNA vectors (shPUM3-1D and shPUM3-2D, described above) or with the sh non-targeting control (shNT) were seeded at a cell density of 5000 cells/well in a 96-well low-attachment plate (Corning, Amsterdam, The Netherlands), and the spheroid area and fluorescence intensity was calculated using the IncuCyte live-cell analysis system.
Fluorescence polarisation (FP) assay
Annealed oligonucleotides at a final concentration of 100 nM, were incubated with increasing concentrations of purified recombinant protein in 20 mM HEPES. NaOH pH 7.5, 125 mM NaCl, 0.5 TCEP. Fluorescence polarisation was measured in a black, round-bottomed SBS-format 96-well plate, using a CLARIOstar multimode plate reader (BMG Labtech GmbH, Offenburg Germany). DNA duplexes were generated by annealing an equimolar amount of oligonucleotide A with oligonucleotide B, to yield a final concentration of 100 µM. Purified oligonucleotides were purchased from Merck (Darmstadt, Germany).
Oligonucleotide A
5’-F TAGTGCTGTAGGAGAATATACGGGCTGCTCGTGTTGACAAGTACTGAT-3’.
Oligonucleotide B
5’-ATCAGTACTTGTCAACACGAGCAGCCCTATATTCTCCTACAGCACTA-3’.
Where F = 5-Carboxyfluorescein.
Organoid viability assay
The viability of the murine Brca1−/−p53−/− tumour organoid BP-903 was measured using IncuCyte S3 model microscope set to perform Brightfield live captures at 8 h intervals, coupled with Organoid Module growth-curve analyses. Briefly, organoids were extracted from Matrigel and dissociated to single cells in TrypLE for 10 min at 37 °C, single cells were transduced with either shNT or shPUM3-1 and shPUM3-2 at an approximate MOI (multiplicity of infection) of 1, using concentrated Lentiviral particles. This material was then mixed with 200 μL of matrigel (Corning) diluted as 50% in basal ADDF+++ media (Advanced DMEM/F12 supplemented with 10 mM HEPES, 1% GlutaMAX, and 1% penicillin/streptomycin) supplemented with 2% B27, 1% N2 (Thermo Fisher Scientific), 10 ng/ml mEGF, 10 ng/ml FGF basic (Peprotech), 4 μg/ml Heparin (Sigma) mixed 1:1 with Growth Factor reduced Matrigel (Corning, #356237). The resulting PDO mixes were then seeded onto a single well of 24-well plate per condition. After an overnight incubation with the respective lentiviral particles, the wells were fed with 1 mL of Organoid media (as described above). Three days after transduction/infection, organoids were retrieved and dissociated using TrypLE™ Express (Thermo) and resuspended using 1 mL of Organoid media. 900 μL of this was extracted for western blotting to confirm knockdown; it was spun down for pelleting and then lysed in 2% SDS containing proteases and phosphatase inhibitors from Roche. The remaining volume (<100 μL at ap-proximately 10,000 cells per μL) per condition was diluted with 1 mL 50% matrigel in Organoid media, and 50 μL per well (thus ~5000 cells per well) was seeded onto multiple wells (12–16) of 96 well-plate for IncuCyte acquisitions. The wells were initially fed with 100 μL Organoid media once gelified and then every 4–5 days.
Topoisomerase 1 plasmid relaxation assay
The Topoisomerase I Assay Kit (Topogen) was used to assess cellular topoisomerase 1 activity following manufacturer’s instructions.
Statistics and reproducibility
Statistical analysis was performed using GraphPad10. Two-tailed Student’s t test was used for statistical comparisons between two groups. Ordinary one-way ANOVA and two-way ANOVA with Tukey’s multiple comparisons or with Sidak’s multiple comparisons were used to determine statistical significance of multiple comparisons. All experiments for which quantifications were performed were carried out a minimum of three times, as indicated in the figure legends.
Reporting summary
Further information on research design is available in the Nature Portfolio Reporting Summary linked to this article.
