


Patient cohort
All procedures involving human participants were conducted in accordance with the ethical standards of the institutional and national regulations, and with the Declaration of Helsinki. Preoperative blood samples and PDAC tissue biopsies for organoid generation were collected from patients diagnosed with resectable PDAC at the University Hospital of Dresden between 2022 and 2023 (Supplementary Table S1). All PDAC patients provided written informed consent, and the study was approved by the Ethics Committee of the TU Dresden (EK76032013; EK366092024). All tissue samples were reviewed by board-certified pathologists to confirm the presence of PDAC according to the WHO classification. Human peripheral blood mononuclear cells (PBMCs) were obtained from PDAC patients for the optimization of the co-culture conditions. PBMCs from G-CSF-mobilized leukapheresis of healthy donors, which was undertaken at the Bone Marrow Transplantation Center of the Carl Gustav Carus University Hospital, Dresden, Germany, under a study protocol approved by the Ethics Committee of the TU Dresden (EK127042009) and with written informed consent from all donors, were used for co-culture experiments. Leukapheresis products were transferred to the Leibniz Institute of Polymer Research Dresden, Max Bergmann Center of Biomaterials, Dresden, Germany, where they were washed and processed according to the CD34 MicroBead Kit UltraPure (Miltenyi Biotec). During magnetic-activated cell sorting of CD34-expressing hematopoietic stem and progenitor cells, the CD34-negative flow-through, containing monocytes, macrophages, and other blood cells, was separately collected. Then, the CD34-negative cell collection was biobanked at 50×106 to 100×106 per 1 ml vial in a custom, step-wise freezing workflow including 50% (v/v) CryoStor CS10 (Stem Cell Technologies), 10% (v/v) CryoSure-DMSO (WAK-Chemie Medical), and 5% (v/v) human serum albumin (HSA, Baxalta) in PBS, and stored in a liquid nitrogen tank until further use. These were used for monocyte isolation, macrophage differentiation, and for co-culture with PDAC PDOs.
Isolation and differentiation of monocytes into macrophages
Monocytes (CD14+) were isolated from biobanked PBMCs via negative magnetic bead selection using the Pan Monocyte Isolation Kit (Miltenyi Biotec, Bergisch Gladbach, Germany) according to the manufacturer’s instructions. Cell viability was assessed by trypan blue exclusion prior to culture. Purified monocytes were seeded on NUNC™ UpCell™ plates (Thermo Fisher, Waltham, US) and maintained in macrophage medium consisting of RPMI1640 (Thermo Fisher, Waltham, US) supplemented with human serum (10% v/v, Sigma-Aldrich, St. Louis, US), M-CSF (25 ng/ml, Miltenyi Biotec, Bergisch Gladbach, Germany), and Penicillin/Streptomycin (1% v/v). To generate M0 macrophages, monocytes were treated with M-CSF and on day 6 either subjected to LPS (100 ng/ml, Sigma-Aldrich, St. Louis, US) and IFN-γ (10 ng/ml, Gibco, Waltham, US) for M1 macrophage polarization, or to IL-4 (20 ng/ml, Miltenyi Biotec, Bergisch Gladbach, Germany) for M2 macrophage polarization.
Multiplex immunohistochemistry
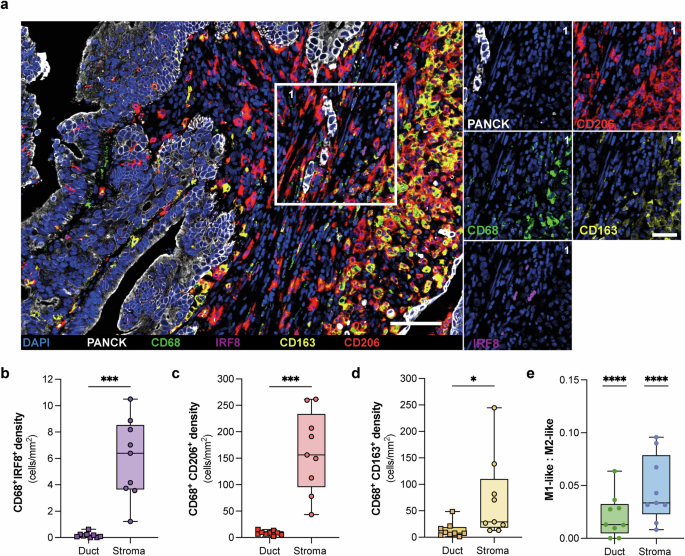
Formalin-fixed, paraffin-embedded (FFPE) tumor sections from nine PDAC patients were stained using the Opal multiplex technology (Akoya Biosciences) on the Ventana Discovery Ultra platform (Ventana Medical Systems, RRID:SCR_021254). Tissue slides underwent deparaffinization, rehydration, and heat-induced antigen retrieval at 95°C in Cell Conditioning Solution (CC1, pH 9; Ventana Medical Systems). Primary antibodies (Supplementary Table S2) were applied sequentially, followed by horseradish peroxidase (HRP)-conjugated OmniMap secondary antibodies (Ventana Medical Systems). Opal TSA fluorophores (Akoya Biosciences) were then introduced, enabling covalent binding to tyramide residues and stable fluorescence emission. Antibody stripping was performed after each cycle using CC2 buffer (pH 6; Ventana Medical Systems) at 100°C to allow sequential staining of up to six markers. After completing all cycles, nuclei were counterstained with DAPI (Merck/Sigma-Aldrich), and slides were mounted using Fluoromount-G (SouthernBiotech). Afterwards, whole-slide scans were acquired using PhenoImager HT 2.0 (Akoya Biosciences). Regions of interest (ROIs) were defined using Phenochart software (Akoya Biosciences, RRID:SCR_019156), followed by multispectral imaging (MSI) at 200x magnification. Spectral unmixing was performed in inForm software (Akoya Biosciences, RRID:SCR_019155), and multi-channel TIFF files were generated for downstream analysis. Finally, the images were processed in QuPath software following an established pipeline (https://qupath.readthedocs.io/, RRID:SCR_018257). Initially, 80–100 randomly selected images were used to train a pixel classifier for segmenting tumor and stromal regions. Using the QuPath extension StarDist, automated cell detection was executed53,54, followed by training object classifiers to identify specific cell types based on marker expression. A validation set of images was used to refine classification accuracy before applying the final pipeline, integrating pixel classification, cell detection, and object classification across all images.
PDAC organoid generation from tissue specimens
Tumor biopsies were washed, minced into small pieces (<1 mm3), and enzymatically digested with DispaseII (1.2 mg/ml, Roche, Basel, Switzerland) and CollagenaseII (0.625 mg/ml, Sigma-Aldrich, St. Louis, US) in DMEM/F12+++ medium supplemented with 1xHEPES, 1xPen/Strep and 1xGlutaMAX (all Invitrogen, Waltham, US) at 37 °C as previously described10, and cultivated in human PDAC organoid medium DMEM/F12+++ supplemented with Wnt3a-conditioned medium (50% v/v), noggin-conditioned medium (10% v/v), RSPO1-conditioned medium (10% v/v), B27 (1x, Invitrogen, Waltham, US), nicotinamide (10 mM, Sigma-Aldrich, St. Louis, US), gastrin (1 µM, Sigma-Aldrich, St. Louis, US), N-acetyl-L-cysteine (1.25 mM, Sigma-Aldrich, St. Louis, US), primocin (100 µg/ml, InvivoGen, San Diego, US), recombinant murine epidermal growth factor (50 ng/ml, Invitrogen, Waltham, US), recombinant human fibroblast growth factor 10 (100 ng/ml, PeproTech, Waltham, US), A-83-01 (0.5 μM, Tocris Bioscience, Bristol, UK), and N2 (1x, Invitrogen, Waltham, US)10. The organoids were always maintained at 37 °C and 5% (v/v) CO2. PDAC organoid lines were routinely tested for mycoplasma using MycoStrip™ DETECTION Assay (InvivoGen, San Diego, US).
Cell viability and caspase 3/7 assays
For all viability-related experiments, PDAC organoids and macrophages were plated in 96-well plates and assessed over a 7day period. Cell viability was measured using the CellTiter-Glo® Luminescent Cell Viability Assay (Promega, Madison, US) according to the manufacturer’s instructions. Luminescence was recorded using the Varioskan Lux (Thermo Fisher Scientific, Waltham, US) with an integration time of 500 ms. Caspase-3/7 activity was quantified using the Caspase-Glo® 3/7 Assay (Promega, Madison, US), following the manufacturer’s protocol, and luminescence was measured with a 500 ms integration time. For both assays, measurements were normalized to the first day of culture (day 1) and depicted as fold change.
StarPEG-heparin hydrogel setup for 3D mono- and co-culture
Matrigel-embedded organoids were mechanically dissociated using a fire-polished glass Pasteur pipette. A relative cell number was achieved by digesting PDOs into single cells using TrypLETM Express (Thermo Fisher, Waltham, US). Macrophages were incubated with Dulbecco’s PBS for 15 min at RT on a rocker and detached using a 1% BSA-coated pipette. Cell viability was assessed with trypan blue. PDAC organoids (3 × 10⁴ cells/ml) and M0 macrophages (6 × 10⁴ cells/ml) were mixed in a ratio of 1:2 for co-cultures, based on established organoid–immune cell co-culture models in which this ratio balances sufficient macrophage numbers for reliable functional readouts with avoidance of non-specific cytotoxicity at higher ratios55,56; notable that seeding ratios in tumor cell-macrophage co-culture models vary across the literature (1:1 to 1:10), reflecting the absence of a universal standard. Monocultures of PDAC organoids and M0 macrophages, along with M1- and M2-polarized macrophages, were used as controls. Protease-sensitive starPEG-heparin hydrogels for cell embedding were composed of star-shaped poly(ethylene glycol)-peptide conjugates (starPEG, MW 15,000 Da). For this, heparin was first dissolved in Dulbecco’s PBS (pH 7.4) and was covalently functionalized with 2 moles of thiol-containing RGDSP (MW 990 Da) per mole of heparin via a Michael addition reaction. Then, the cells were suspended in the hydrogel precursor solution containing RGDSP and heparin. This mixture was then combined with a secondary hydrogel precursor solution of starPEG dissolved in Dulbecco’s PBS (pH 7.4). The two components were mixed at an equimolar ratio, corresponding to a crosslinking 26ratio of 1 (i.e., as defined as γ=1 in prior studies)26. The cell-containing starPEG-heparin hydrogels were cast onto sterile, Sigmacote-coated glass slides (Sigma-Aldrich, St. Louis, US). Upon gelation (5 min at RT), the drops were transferred into NUNC™ UpCell™ cell culture plates containing the co-culture medium (CCM) consisting of RPMI supplemented with Wnt3a-conditioned medium (20.5% v/v), noggin-conditioned medium (5% v/v), RSPO1-conditioned medium (5% v/v), B27 (0.5x, Invitrogen, Waltham, US), DMEM/F12+++ (14% v/v), human serum (1.5% v/v, Sigma-Aldrich, St. Louis, US) and Penicillin/Streptomycin (1%). Co-cultures were assessed at day 3 and day 7 to capture tumor–macrophage interaction, reflecting early polarization responses and sustained transcriptional reprogramming, respectively57,58,59. Medium was replaced with fresh CCM after 3 days.
Flow cytometry
Two 10 µl hydrogel drops were pooled and treated with Collagenase type IA (1.85 mg/ml, Sigma-Aldrich, St. Louis, US) for cell recovery. After a maximum of 20 min at 37 °C, the cell suspension was centrifuged and washed with PBS. Samples were first stained with a viability dye followed by macrophage-specific markers, prior to fixation and permeabilization with eBioscience FOXP3/Transcription Factor Staining Buffer Set (Thermo Fisher Scientific, Waltham, US). FMO and isotype controls were used to guide gating (Supplementary Fig. S5b). Flow cytometry was performed using the LSR Fortessa™ flow cytometer (BD Bioscience, Franklin Lakes, US). Data were analyzed using FlowJov10.7.1 (BD Bioscience, Franklin Lakes, US).
Cytokine profiling
For membrane-based cytokine profiling, supernatant of M0 macrophages and PDO co-cultures (DD1391 and DD1970) were harvested on day 7 and immediately stored at −80 °C until further analysis. Cytokine profiling was performed using the Human Cytokine Array C5 kit (RayBiotech, RRID:AB_10185250) according to the manufacturer’s instructions. Chemiluminescent membrane images were acquired using a Fusion FX imaging system (Vilber Lourmat, France). Densitometric quantification of protein array signal intensities was performed using the Protein Array Analyzer plugin in ImageJ60.
Transcriptomic analysis
Differential gene expression analysis was performed using DESeq261 (1.46.0) in R(4.4.1). PDO transcriptomes and co-cultures were combined into one object and macrophages into another. The DESeq2 design objects were generated, including a compensatory term for the culturing time, where cell lines or cultures were assessed, and a compensatory term for the cell line, where the culturing time was assessed. For PCA and hierarchical clustering, counts were first transformed with variance stabilization. For visualization of genes in a heatmap, gene expression was scaled by row. Differential gene expression analysis was performed with an adjusted p-value cut-off of 0.05 and an absolute log2-fold change of 1. For volcano plots showing differential gene expression, y-axes were capped at the highest highlighted genes, and every value above was collapsed at this maximum. The purpose was better visibility for the transcript population of interest given some outlier genes with very high significance levels. Odds ratios for macrophage polarization were derived from contingency tables showing the overlap of significant genes from the experimental polarization M2-like versus M1-like and the co-culture comparison to the PDOs or days 3 and 7 of culturing. Odds ratios with a 95% confidence interval were determined based on whether the proportion of M2-like genes in the co-culture versus M1-like genes in the co-culture is enriched as compared to the polarization genes that are independent of co-culture. For the associated testing statistics, an X2 test was performed. Marker genes were selected based on experimental data on protein levels and literature.
Statistical analysis
Graphs and statistical analyses, including significance and p-values, were performed using GraphPad Prism v10.4.0 (RRID: SCR_002798). Unless otherwise stated, the data sets represent two independent experiments. Values were averaged, and standard deviation or, if applicable, standard error of the mean was calculated. A paired t-test was used for the mIHC analysis. An unpaired t-test or ANOVA was used for statistical analyses and is mentioned in the figure legends. The p-values are presented as follows: *p ≤ 0.05; **p ≤ 0.01; ***p ≤ 0.001; ****p ≤ 0.0001.
