


All research involving human samples and animals was conducted in compliance with all relevant ethical regulations. Studies involving human samples were approved by the San Raffaele Ethics Committee, IRCCS Ospedale San Raffaele, Milan, Italy, whereas animal studies were approved by the Animal Care and Use Committee of IRCCS Ospedale San Raffaele and authorized by the Italian Ministry of Health. Protocol-specific details are provided in the relevant Methods sections.
Collection and purification of primary AML samples and treatment
Primary AML patient samples were collected and cryopreserved at the San Raffaele Leukemia Biobank after written informed consent was obtained, in accordance with the Declaration of Helsinki. The informed-consent documentation (obtained from all participants) specified that participant data could be disseminated through scientific publications only in strictly anonymized. Participants received no financial compensation.
The Leukemia Biobank protocol was approved by the San Raffaele Ethics Committee on 12 July 2010, with the latest amendment approved on 14 June 2012, and samples were analyzed according to the SEN-LEUK protocol, approved by the San Raffaele Ethics Committee on 10 December 2017, with the latest amendment approved on 14 March 2024.
Participant sex was obtained from clinical records. Both female and male participants were included based on sample availability, and sex was not used as an inclusion or exclusion criterion. Sex-stratified analyses were not performed because the individual experimental cohorts were small and the study was not designed or powered to assess sex-specific effects. Participant age and sex are reported in Supplementary Data 1.
After thawing, cells were cultured on a layer of irradiated (20 Gy) human fibroblasts (BJ-hTERT) in Blasts Culture Media (BCM) (components listed below). After 2 days of culturing, AML blasts were purified by a CD34- or CD33- based magnetic-activated cell separation system (for CD34: cat#130-046-702, for CD33: cat#130-045-501, Miltenyi Biotec) or by FACS sorting using the following antibodies: Brilliant Violet 510™ hCD45 (cat#368526, BioLegend), CD33-FITC (cat#IM1135U, Beckman Colter), CD34-PE (cat#130-113-179, Miltenyi Biotech). Following purification, AML cells were seeded for subsequent analysis.
Blasts colture medium (BCM) preparation
BCM media was prepared with 250 ml DMEM (#cat D5671, Sigma-Aldrich; supplemented with 10% FBS, 1% Penicillin/Streptomycin mixture (P/S), and 2% L-Glutamine), 250 ml RPMI 1640 (cat#10-040-CV, Corning; supplemented with 10% FBS, 1% P/S, 2% L-Glutamine), 0,5 mM 2-Mercaptoethanol (cat#31350010, Thermo Scientific). Then, BCM was supplemented fresh with 20% 5637 cells-conditioned BCM and with the following cytokines:
Stock concentration (ng/µl)
Concentration in Cytokine BCM (ng/ml)
Catalog Number, brand
SCF
20
100
300-07-250ug, PeproTech
IL-3
10
10
200-03, PeproTech
IL-6
10
20
200-06-100ug, PeproTech
TPO
10
10
300-18, PeproTech
FLT-3-Ligand
10
10
300-19, PeproTech
AML primary samples treatments
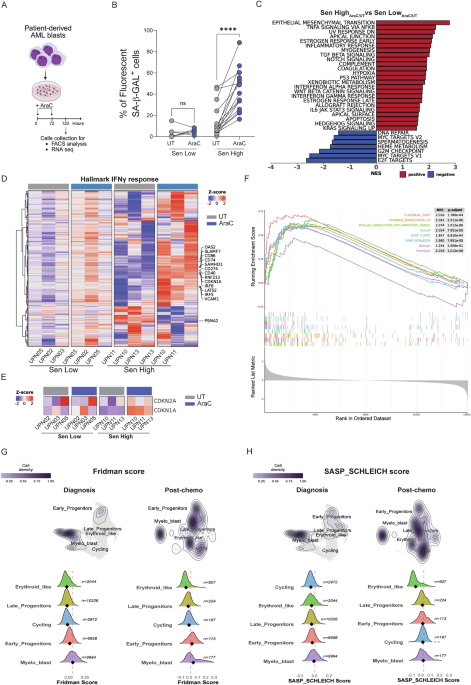
For the dose-response curve, AML blasts were plated in a 24 well plate onto irradiated BJ-hTERT stromal cells and escalating doses of AraC (cat#F000046284, Pfizer) were tested: C1: 1 nM; C2: 40 nM; C3: 400 nM; C4: 1 µM; C5: 4 µM. The drug was administered at 0 and 72 hours from AML blast thawing. At 72 hours, the cell medium was refreshed, the stromal layer replaced before adding the second dose and downstream analyses were performed at 120 h. Tazemetostat (cat#S7128-10mg, Selleck Chemicals) was used at 10 µM and administered at times 0, 24, 48,72 and 96 h.
Cell lines and senescence-inducing treatments
BJ hTERT human fibroblasts (ATCC, cat#CRL-3627) were maintained in high-glucose Dulbecco’s modified Eagle’s medium (DMEM; cat#D5796, Sigma-Aldrich) supplemented with 10% FBS, 1% P/S and 1% sodium pyruvate (cat#11360-039, Gibco, 100 mM stock solution) at 37 °C and 5% CO₂. THP-1 cells (ATCC, cat#TIB-202) were maintained in RPMI 1640 (cat#10-040-CV, Corning) supplemented with 10% FBS, 1% P/S, and 2% L-Glutamine at 5% CO2 and 37 °C.
THP-1 and BJ hTERT cells were checked against the ICLAC Register of Misidentified Cell Lines, version 14, and neither cell line was listed as misidentified. The cell lines were not independently authenticated in our laboratory; their identities were based on the documentation provided by ATCC. 5637 cells were provided by collaborators and were used solely to generate conditioned medium. Information on the original source and catalog number was not available.
For the dose-response curve, cells were seeded 1 × 10⁵/ml in a 12-well plate, 5 technical replicates for each condition and treated with escalating doses of AraC (cat# F000046284, Pfizer; C1: 2 nM; C2: 20 nM; C3: 200 nM; C4: 2 µM; C5: 5 µM; C6: 10 µM) every other day for 7 days.
Subsequent readouts were performed with the selected dose of AraC (200 nM) after seeding cells in 6-well plates at 1,5 × 10⁵ cells/mL. Cells were counted with trypan blue solution using the TC20 counter every other day. Stained cells were acquired at the CANTO II analyzer, and data were analyzed using FlowJo version 10.10.0 (Tree Star).
For apoptosis, the staining was performed using Annexin V binding buffer 1x (cat#556454, BD), adding 2 μL of Annexin V (cat#640920, BioLegend) and 1 μL of 7AAD (Stock concentration: 50 µg/ml). The gating strategy was performed using FMO controls for Annexin V and DAPI with a sample containing a mix of control and treated cells.
Stained cells were analyzed at the CANTO flow cytometer, and data were analyzed using the FlowJo program. Senescence and HLA class I and II levels evaluation were carried out as described below.
Senescence evaluation
Patients-derived AML cells and BM cells from in vivo experiments were incubated with Chloroquine (cat#C6628, Sigma-Aldrich,150 µM final concentration) for 1 h at 37 °C with 5% CO2. Then, 5-Dodecanoylaminofluorescein Di-β-D-Galactopyranoside (C12FDG, cat#D2893, ThermoFisher, final concentration 16,66 nM) was added for 30 min at 37 °C. Alternatively, for in vivo experiments, SPiDER-βGal (cat#SG02-10, Dojindo, final concentration 0.57 ng/uL) was used as senescence substrate and added for 15 min at 37 °C. After washing in PBS, stained cells were analyzed by imaging-based flow cytometry technology (ImageStreamX) or by standard flow cytometry at the CANTO II analyzer.
THP-1 cells were incubated in McIlvaine buffer (pH 6.0) with C12FDG at 16,66 nM working concentration) for 30 min at 37 °C. For McIlvaine buffer preparation, the protocol provided by Dojindo was used.
To measure senescence with ImageStreamX analysis, cells were first incubated with Edu (2 µM final concentration) for 48 h and stained for fluorescent SA-β-GAL, then with Pacific Blue AnnexinV (cat#640918, BioLegend) using Annexin V binding buffer 1x (cat#556454, BD). Cells were fixed, permeabilized and stained for EdU (Click-iT™ EdU Alexa Fluor™ 647 Flow Cytometry Assay Kit, cat#C10635, ThermoFisher). Only events with a gradient value higher than 60 based on brightfield images were considered cells on focus. Single-cell events were selected by plotting the area against the aspect ratio. Alive cells (negative for AnnexinV) within the single-cell gate were selected for the EdU signal and the senescence marker fluorescent SA-β-GAL.
Western blot analysis
Cells were lysed in ice-cold RIPA buffer supplemented with Protease and Phosphatase Inhibitor Mini Tablets (#catA32961, Thermo Scientific) and sonicated with Bioruptor sonicator (Diagenode). Protein concentration was determined by Pierce™ BCA Assay Kit (cat#23227, Thermo Fisher Scientific) according to the manufacturer’s instructions. Proteins were resolved on pre-cast 4–15% Mini-PROTEAN gels (cat#4568084, Bio-rad) by SDS-PAGE, then transferred to a nitrocellulose membrane (cat#1620115, Bio-rad), followed by blocking with 5% BSA or 5% milk in TBS-Tween 0.1% (TBST) for 1 hour at room temperature. Membranes were incubated overnight at 4 °C with the specific primary antibody diluted in 5% BSA/TBST (cat#A7906-100G, Sigma-Aldrich) or 5% MILK/TBST (cat# 9999S, CST) according to antibodies datasheet. HRP-conjugated primary antibodies used as loading controls, including H3 and β-Actin, were incubated for 1 h at room temperature. Membranes were washed three times with TBST for 10 min RT on a shaker, then incubation with HRP-linked secondary antibody was carried out for 1 h at RT (according to primary antibody host species: Goat anti-Rabbit IgG (H + L) Secondary Antibody, HRP, cat#65-612-0, ThermoFisher). Membranes were developed using an HRP substrate (Clarity™ Western ECL Substrate, cat# 1705061, Bio-rad) and visualized at the iBright Imaging System (Thermo Fisher). Protein size was determined by matching bands from a colored protein ladder (cat#26619, Thermo Scientific). Protein bands were quantified using ImageJ software. Differences in protein levels were normalized against the indicated loading control.
A list of the primary antibodies used is reported in the table below:
Antibody
Species
Dilution
Reference
p21
Rabbit
1:500
cat#2947 s, CST
γH2AX
Rabbit
1:500
cat#ab81299, Abcam
H3K27me3
Rabbit
1:500
cat#9733 s, CTS
EZH2
Rabbit
1:1000
cat#4905 s, CST
β-actin-HRP
1:25000
#catA3854-200UL, Sigma-Aldrich
H3-HRP
1:5000
Cat#ab21054, Abcam
Sample preparation for immunopeptidomics
Patient-derived AML blasts from n = 3 biologically independent Sen High and n = 3 biologically independent Sen Low patient samples were cultured as described above and analyzed under untreated and AraC-treated conditions. Cells were washed twice with ice-cold PBS by centrifugation at 335 × g for 5 min at 4 °C. After the first wash, cells were transferred to low-protein-binding microcentrifuge tubes. Following complete removal of the supernatant, cell pellets were weighed, snap-frozen in liquid nitrogen, and stored at − 80 °C until further processing.
Purification and concentration of HLA class I peptides
HLA class I-bound peptides were immunoaffinity purified from AML samples using biotin-conjugated anti-human HLA-A, HLA-B, and HLA-C antibodies (cat#311434, clone W6/32, BioLegend). For sample preparation, the snap-frozen cell pellet was resuspended in the lysis buffer [150 mM NaCl, 50 mM TRIS-HCl, pH 7.4, protease inhibitors (cat#A32955 Thermo Scientific Pierce), 1% Igepal (cat#I8896, Sigma-Aldrich)]. Lysates were centrifuged for 10 min at 500 × g, and then the supernatant was centrifuged for 30 min at 25 000 × g. Next, HLA-I complexes were immunoaffinity purified from the cleared lysate with anti-human HLA-A, HLA-B, and HLA-C biotin–streptavidin bound to the micropillars of the biotinylated thiol–ene CHIP (PeptiChip75). The CHIPs were first washed three times with PBS, and then the HLA molecules were eluted at room temperature by adding acetic acid 7% (cat#A113, Fisher Scientific) in 50% MeOH (cat#10402824, Fisher Scientific). Eluted HLA peptides and the subunits of the HLA complexes were desalted using SepPac-C18 cartridges (Waters)76. Briefly, the cartridge was prewashed with 80% acetonitrile in 0.1% trifluoroacetic acid (TFA) and then with 0.1% TFA. The peptides were purified from the HLA-I complex by elution with 30% acetonitrile in 0.1% TFA. Finally, the samples were dried using vacuum centrifugation (Eppendorf).
LC-MS analysis of HLA-I peptides
Each dry sample was dissolved in 10 μL of LC-MS solvent A (0.1% formic acid). The nanoElute LC system (Bruker) injected and loaded 10 μL of the sample directly onto the analytical column (Aurora C18, 25 cm long, 75 μm ID, 1.6 μm bead size, Ionopticks), constantly kept at 50 °C by a heating oven (Column Toaster, Bruker). After washing and loading the sample at a constant pressure of 800 bar, the LC system started a 30 min gradient from 0% to 32% solvent B (acetonitrile, 0.1% formic acid), followed by an increase to 95% B in 5 min, and finally a wash of 10 min at 95% B, all at a flow rate of 300 nL/min. Online LC-MS was performed using a Tims TOF SCP mass spectrometer (Bruker) operated with the CaptiveSpray source, capillary voltage 1500 V, dry gas flow of 3 L/min, dry gas temperature at 180 °C. Mass range was 100–1700 m/z, and mobility range was 0.6–1.70 V.s/cm2. MS/MS was used with three PASEF (parallel accumulation – serial fragmentation) scans (with 300 ms ramp time) per cycle with a target intensity of 20 000 and intensity threshold of 500, considering charge states 0–5. Active exclusion was used with release after 0.4 min, reconsidering precursor if the current intensity is greater than fourfold the previous intensity, and a mass width of 0.015 m/z and a 1/k0 width of 0.015 V.s/cm2. Isolation width was defined as 2.00 m/z for mass 700 m/z and 3.00 m/z for mass 800 m/z. Advanced collision energy settings consisted of nine points of collision energy dependency on ion mobility: 0.70 V.s/cm2 − 27.50 eV; 0.85 V.s/cm2 − 32.00 eV; 0.90 V.s/cm2 − 36.00 eV; 0.95 V.s/cm2 − 38.00 eV; 1.25 V.s/cm2 − 44.00 eV; 1.30 V.s/cm2 − 46.00 eV; 1.35 V.s/cm2 − 47.00 eV; 1.50 V.s/cm2 − 47.00 eV; 1.65 V.s/cm2 − 50.00 eV. Precursor ions were selected using 1 MS repetition and a cycle overlap of 1 with the default intensities/repetitions schedule.
Each of the six biologically independent AML patient samples was analyzed under untreated and AraC-treated conditions, resulting in 12 samples. Each sample was acquired once by LC–MS/MS, with no technical replicate acquisitions.
Immunopeptidomics database search and peptide identification
MS/MS spectra were analyzed using PEAKS Studio 11.0 (build 20230414; Bioinformatics Solutions Inc.). A database-independent de novo search was first performed using the PEAKS DeepNovo algorithm, followed by a peptide database search using a target–decoy strategy. Spectra were searched against the UniProt human reference proteome, including isoforms (103,789 entries; downloaded on 26 April 2023). No enzyme specificity was imposed, and the digestion mode was set to unspecific. Precursor and fragment ion mass tolerances were set to 20 ppm and 0.02 Da, respectively. No fixed modifications were specified. Methionine oxidation was included as a variable modification, allowing a maximum of three oxidations per peptide. Peptide identifications were filtered using a peptide-level false discovery rate of 5%. Binding affinity to the corresponding patient-specific HLA alleles was predicted for all eluted peptides identified in the AML samples using NetMHC 4.0. Strong binders were defined as peptides with a %rank < 0.5, weak binders as peptides with a %rank ≥ 0.5 and < 2, and non-binders as peptides with a %rank ≥ 2. Strong and weak binders were retained for downstream analyses.
T cell purification
Whole peripheral blood samples from either healthy donors or AML patients were processed to obtain mononuclear cells (PBMCs) through density gradient centrifugation using Lympholyte™ (cat#DVCL5020-10, Lonza). CD3+ T lymphocytes were isolated via magnetic separation with a Pan T cell Isolation Kit (cat#130-096-535, Miltenyi Biotech) according to the manufacturer’s instructions. The negative fraction was collected. After the selection, viable samples consisted of >90% CD3+ T cells. T cells composition (CD4+ and CD8+) was measured via FACS.
Mixed Lymphocyte Reaction (MLR) and downstream analyses
Purified T cells, autologous or coming from healthy donors, were stimulated with the THP-1 cell line (pre-treated for 48 hours with 200 U/mL Recombinant Human IFN-γ [cat#300-02, PeproTech]) or with AraC-treated primary blasts from either Sen Low or Sen High samples at an effector: target ratio of 1:1. Cells were cultured in IMDM supplemented with 2% L-glutamine, 1% P/S, 10% Human Serum (cat#ECS0219D, Euroclone), and IL-2 (cat# 201-LB-100/CF, R&D Systems, 50 ng/mL final concentration). IL-2 was replaced every 3–4 days. After stimulation, T cells were tested against targets of choice, co-culturing them at a 1:1 ratio. To block HLA-DR, cells were pre-treated with 10 μg/mL HLA-II blocking antibody (Bio X Cell, BE0306) or 10 μg/ml isotype IgG antibody in the absence of serum overnight at 37 °C. For experiments with ICBs, blasts were treated with 10 μg/mL Ipilimumab (anti-CTLA-4, cat#A2001, Selleck Chemicals), Nivolumab (anti-PD-1, cat#A2002, Selleck Chemicals) or Durvalumab (anti-PD-L1, cat# A2013, Selleck Chemicals) before starting the co-culture. T-cells were then collected at different time points for proliferation, degranulation and activation markers expression. For T cell proliferation, before co-culture T cells were resuspended 1 × 10⁶ cells/mL in 1X PBS containing CellTrace Violet Cell (cat#C34557, ThermoFisher) for 20 minutes at 37 °C, then washed with supplemented IMDM. Dilution of Cell Trace Violet was quantified by FACS analyses 5 days after co-culture using primed T cells cultured alone as a negative control. T-cell degranulation was evaluated by adding an anti-CD107a antibody at the beginning of co-culture (CD107a-FITC clone H4A3, cat#555800, BD) and Golgi Stop (cat#554724, BD) after 3 h. At 6 h after the co-culture start, cells were stained with CD8-PECy7 or APC-Cy7 (depending on the presence of CD33 Ab) and CD4-PE antibodies, then the signal was acquired at FACS Canto II.
T cell ex vivo expansion protocol
2 × 10^6 PBMCs from AML primary samples BM vials were cultured in G-Rex24 Well Plate (cat#80192 M, Wilson Wolf) in X-Vivo 15 medium (cat#BEBP02-054Q, Lonza) supplemented with 5% human serum, 1% P/S, 100 IU/mL IL-7 (cat# BEBP02-054Q, Miltenyi Biotec), 200 IU/mL IL-15 (cat#130095764, Miltenyi Biotec), and 10 ng/mL IL-2 (cat#130097743, Miltenyi Biotec) with the addition of T Cell TransAct™ (cat#130-111-160, Miltenyi Biotec) (40uL per million of CD3+ cells measured by FACS analysis). 24 h post TransAct™ addition, new X-Vivo media was added, reaching a final volume of 5 mL. Cells were kept in culture for three weeks, then counted and used; the medium was changed at least once a week.
Genetic engineering by CRISPR-Cas9
THP-1 cells were nucleofected with 2.5–1.25 µM of Ribonucleoproteins (RNPs) and electroporation enhancer (cat# 1075916, Integrated DNA Technologies) according to the manufacturer’s instructions using P3 Primary Cell 4D-Nucleofector X Kit and program EA-100 (Lonza). RNPs were assembled by incubating for 10 min at RT at 1:1.5 M ratio S.p. Cas9 protein (cat# 9214-5MG, Aldevron) with a synthetic sgRNA for B2M (Hs.CAS9.B2M.1.AB; sequence: 5- mAmAmG rUrCrA rArCrU rUrCrA rArUrG r, IDT). Cells experiencing sole electroporation or edited with an RNP complex (indicated as CTRL in the Figures) were employed as controls. Editing efficiency was measured by assessing the expression of HLA class I by FACS analysis.
Subject to availability, frozen stocks of the newly generated B2M-edited THP-1 cell populations are available from the corresponding author upon reasonable request and under an appropriate material transfer agreement.
Sample preparation for histone PTM mass spectrometry
Patient-derived AML blasts from n = 3 biologically independent Sen High and n = 3 biologically independent Sen Low samples were cultured as described above. For each analysis, 1 × 10⁶ cells were collected. Each patient sample was analyzed in two independent experiments performed on separate days, resulting in n = 6 measurements per group. Cell pellets were washed twice with ice-cold PBS using a refrigerated centrifuge, snap-frozen in liquid nitrogen, and stored at − 80 °C until further processing.
Histone PTMs mass spectrometry analysis
Histones were enriched from 1 × 10⁶ cells77. Approximately 4 µg of histone octamer were mixed with an equal amount of heavy-isotope labeled histones, which were used as an internal standard (super-SILAC mix)78 and separated on a 17% SDS-PAGE gel. Histone bands were excised, chemically acylated with propionic anhydride, and in-gel digested with trypsin, followed by peptide N-terminal derivatization with phenyl isocyanate79. Peptide mixtures were separated by reversed-phase chromatography on an EASY-Spray column (Thermo Fisher Scientific), 25 cm long (inner diameter 75 µm, PepMap C18, 2 µm particles), which was connected online to a Q Exactive Plus instrument (Thermo Fisher Scientific) through an EASY-Spray™ Ion Source (Thermo Fisher Scientific), as described79. The acquired raw data were analyzed using EpiProfile 2.080, selecting the SILAC option, followed by manual validation. For each histone-modified peptide, the percentage relative abundance (%RA) in the sample (light channel, L) and in the internal standard (heavy channel, H) was estimated as described previously79. L/H ratios of %RA were then calculated. The %RA for each peptide was determined by summing all peptide forms containing a given PTM. The mass spectrometry data have been deposited to the ProteomeXchange Consortium81 via the PRIDE partner repository with the dataset identifier PXD065846.
LC–MS/MS acquisition for histone PTM analysis
Solvent A consisted of 0.1% formic acid (FA) in ddH₂O, whereas solvent B consisted of 80% acetonitrile (ACN) and 0.1% FA. Peptides, resuspended in aqueous 1% trifluoroacetic acid (TFA), were loaded at a flow rate of 500 nL min⁻¹ and separated using a 50 min linear gradient from 10% to 45% solvent B. The Q Exactive Plus mass spectrometer was operated in data-dependent acquisition (DDA) mode, automatically switching between full-scan MS and MS/MS acquisition. Full-scan MS spectra were acquired over an m/z range of 300–1350 in the Orbitrap detector at a resolution of [confirm value] at m/z 200. The [confirm whether 10 or 12] most intense precursor ions with charge states ranging from 2 to 4 were sequentially selected for higher-energy collisional dissociation (HCD) using a normalized collision energy of 28%. The automatic gain control targets were set to 3 × 10⁶ for MS1 and 1 × 10⁵ for MS/MS, with maximum injection times of 20 ms and 80 ms, respectively. Dynamic exclusion was set to 10 s. The spray voltage was 1.8 kV, with no sheath or auxiliary gas flow. Each sample preparation was analyzed once by LC–MS/MS, without technical replicate acquisitions.
CUT&Tag assay
CUT&Tag experiments were performed following the protocol previously described by Okur et al.82. with minor adaptations for low-input primary AML samples. Briefly, untreated or Tazemetostat-treated primary AML blasts were collected, and the nuclei were extracted by incubating cells for 10 minutes on ice in 100 µL/sample of cold Nuclei Extraction buffer (NE buffer: 20 mM HEPES-KOH pH 7.9, 10 mM KCl, 0.1% Triton X-100, 20% Glycerol, 0.5 mM Spermidine, 1X Protease Inhibitor cocktail). Nuclei were then bound to activated ConA beads (cat#21-1401, EpiCypher). Nuclei were then incubated with an anti-H3K27me3 primary antibody (cat#13-0055, EpiCypher), followed by secondary antibody incubation (cat#13-1047, EpiCypher) and pAG-Tn5 transposase-mediated tagmentation (cat#15-1017, EpiCypher), according to the published protocol. Libraries were amplified, purified, and sequenced.
In vivo patient-derived xenografts experiments
Female NSG mice (Mus musculus; NOD.Cg-Prkdc^scid^ Il2rg^tm1Wjl^/SzJ; NOD genetic background), aged 8–10 weeks, were purchased from Charles River Laboratories (Calco, Italy) and maintained under specific-pathogen-free conditions, with a 12 h light/12 h dark cycle, at 22 ± 2 °C and 55 ± 5% relative humidity.
All animal procedures were approved by the Animal Care and Use Committee of IRCCS Ospedale San Raffaele and authorized by the Italian Ministry of Health in accordance with Italian legislation (IACUC protocol no. 1386). NSG mice were sub-lethally irradiated (150 rad) 4–6 h prior to transplantation. Primary AML blasts were suspended in 150 μl PBS and transplanted by tail vein injection into 8–10-week-old NSG recipients.
Disease engraftment was monitored by periodic peripheral blood sampling and/or bone marrow (BM) aspirates. Mice were euthanized at predefined experimental time points, corresponding to one week after AraC or tazemetostat treatment (TP1) or after one or two T-cell infusions (TP2), depending on the experimental arm. Throughout the study, animals were closely monitored for body weight and clinical signs of distress in accordance with the approved IACUC protocol and were to be euthanized immediately if predefined humane endpoint criteria were met. No animals reached the humane endpoint criteria before the scheduled experimental endpoint.
BM cells were harvested at 16–24 weeks post transplantation by flushing femurs and tibiae under sterile conditions, filtered through a 40 μm cell strainer and resuspended in ice-cold PBS + 2% FBS. For the chemotherapy experiments, NSG mice were treated with AraC (cat#F000046284, Pfizer) at a dose of 100 mg/kg by subcutaneous injection on days 1 to 5 of the treatment regimen. The drug was prepared in a saline solution. Control animals received an equal dose of saline solution. Mice were allocated to treatment or control groups with equal AML burden based on a pre-treatment BM aspirate. Leukemia burden was measured as the total number of cells retrieved from the bone marrow multiplied by the percentage of human CD45⁺ cells determined by flow cytometry. Leukemia-free mice were defined as mice with less than 1% of human CD45+ cells.
For the Tazemetostat in vivo experiment, EPZ-6438/TAZ (#cat. S7128, Selleckchem) was resuspended in 10% DMSO, 40% PEG300, 5% Tween-80, and 45% saline solution, and administered by oral gavage at 300 mg/kg once daily for 7 consecutive days. Control mice received vehicle alone following the same schedule.
T cells and ICB in vivo infusion
Expanded CD3+ T cells were injected 1 × 10⁶ cells per mouse once a week for 2 weeks, starting 2 days after the stop of the chemotherapy regimen. T cells were resuspended in PBS and transplanted by tail vein injection. Nivolumab was administered by tail vein injection at a dose of 200 μg/mouse on the same day of T cell injection. In the Tazemetostat in vivo setting, only one infusion of expanded CD3+ T cells (1 × 10⁶ cells per mouse) was performed the day after the last dose of TAZ administration.
Flow cytometry panels
For immunophenotypic analysis, a maximum of 0.5 × 10⁵ cells per tube were stained in 100 μl of 1X PBS, 2% FBS, plus the mix of antibodies. Staining was performed at RT for 15 min, followed by washing with 2 ml of 1X PBS, 2% FBS before the analysis. Samples were acquired using the FACS Canto II analyzer (BD Biosciences).
Here, is the complete list of antibodies used for HLA class I and II evaluation (all BioLegend): HLA-ABC Pacific Blue (Clone W6/32, cat#311418), HLA-DR FITC (Clone L243, cat#307604) or HLA-DR APC-Cy 7 (cat#307618).
Here is the complete list of antibodies used for experiments of T cell activation: CD4 FITC (cat#563550, BioLegend), CD8 APCH7 (cat#641400, BD), CD69 APC (cat#310910, BioLegend), CD25 PE (cat#130-113-286, Miltenyi Biotec). The signal was acquired using the FACSymphonyTM flow cytometer (BD Bioscience).
Here, is the complete list of antibodies used for experiments of co-culture between T cells and AML cell lines: CD33 (cat# 333952, BD Biosciences), CD8 APC-Cy7 (cat# 344714, Biolegend), CD4 FITC (cat#980802, BioLegend) or CD4 PE (cat#300508, BioLegend) when combined to T-cells degranulation assay, CD69 APC (cat#310910, BioLegend), CD25 PE (cat#130-113-286, Miltenyi Biotec), ZOMBIE Aqua (cat#423102, BioLegend). For the exhaustion markers panel, we used the following antibodies: TIM3 APC (cat#345011, BioLegend), LAG-3 Brilliant Violet 605 (cat#369324, BioLegend), PD-1 PE (#cat329706, BioLegend). For the T cells subsets panel in Supplementary Fig. S4B we used the following antibodies: CD3 APC (cat#130-113-125, Miltenyi Biotec), CD95 PeCy7 (#cat 305622, BioLegend), CD62L PerCPCy5.5 (cat# 304824, BioLegend), CD45RA VioBlu (cat# 130-113-360, Miltenyi Biotec). For the T cells subsets panel in Supplementary Fig. S4K we used the following antibodies: CD3 PcpCy5.5 (cat#300328, BioLegend), CD8 APC-H7 (cat#641400, BD), CD4 BV605 (cat#562658, BD), CD45RA PB (cat#304123, BioLegend), CD45 BUV395 (cat#563792, BD), CD62L BUV737 (cat#568329, BD), Fixable Viability Dye Viakrome 808 (cat#C36628, Beckman Colter). Naïve: CD45RA+CD62L+CD95; stem cell memory: CD45RA+CD62L+CD95+; central memory: CD45RA-CD62L+CD95-; effector memory: CD45RA-CD62L-CD95-; terminal effector: EFF; CD45RA+CD62L-CD95-:
For immunophenotypic analyses of cells retrieved from PDX, we used antihuman FcR Blocking (cat#130-059-901, Miltenyi Biotec) and antimouse FcR Blocking (cat#553142, BD) and then cells were stained with the following antibodies: mouse CD45 FITC (cat#103108, BioLegend) and human CD45 (cat#304016, BioLegend).
Data were processed using FlowJo version 10.10.0 (Tree Star).
Total RNA-Seq library preparation and sequencing
Total RNA was isolated with miRNeasy Mini Kit (cat#217004, QIAGEN), according to the manufacturer’s instructions. RNA was quantified with The Qubit 2.0 Fluorometer (ThermoFisher), and quality was assessed by the Agilent 4200 TapeStation (Agilent Technologies). To perform RNA sequencing on Sen High and Sen Low patients treated with AraC (or untreated), only samples with RNA integrity number (RIN) > 7 were used, and 10–30 ng of total RNA was used for library preparation with Illumina Stranded mRNA Prep Ligation and sequenced on a NextSeq 500 (Illumina). To perform RNA-Seq on Sen Low samples treated with TAZ (or untreated), library preparation was performed with the NEBnext ultra II RNA directional library preparation kit, with the respective rRNA depletion module.
Bioinformatics analysis
High-quality reads were obtained after reads quality inspection and adapter trimming with Trim Galore (https://www.bioinformatics.babraham.ac.uk/projects/trim_galore/). Reads were aligned to the human genome (GENCODE version hg38 primary assembly) with STAR release 2.7.6a. Gene expression quantification was obtained with featureCounts v2.0.1. The differential expression (DE) analysis was performed with the DESeq2 package (v1.50.2), filtering out genes with zero count for the comparison Sen High untreated versus Sen Low untreated samples (adjusted p-value 0.05). To test the transcriptomics profile differences between the senescence phenotypes upon treatment, we applied an interaction analysis after filtering out lowly expressed genes up to ten reads count. In the design formula, we took into account the paired setup of the experiment ( ~ phenotype + phenotype:patient.n + phenotype:condition), focusing on the contrast in the interaction term (i.e., phenotypeSen_high.conditionAraC vs phenotypeSen_low.conditionAraC). Genes with adjusted p-values < 0.1 (Benjamini-Hochberg correction method) were considered differentially expressed. Gene Set Enrichment Analysis (GSEA) was performed using the clusterProfiler package (v4.18.4), ranking genes according to the Log2FC values of the comparison. In particular, we tested the hallmark gene set version 7.2 from MSigDB. Furthermore, to assess the expression of genes linked to dendritic cell phenotypes upon treatment (Sen High AraC vs Sen Low AraC), we performed GSEA using the Villani et al. dataset37. Senescence classical signatures28,29,30,31,32,33,34,35 were tested in the interaction model and in the comparison between Sen Low samples upon Tazemetostat treatment versus Sen Low samples untreated. The analysis for the detection of HLA (class I and II) was performed by aligning high-quality reads to the human genome (GENCODE version GRCh38.p13, including patches and haplotypes) with a multi-mapping approach, considering the following parameters for the alignment with STAR ‘–winAnchorMultimapNmax 100 –outFilterMultimapNmax 100’, and for the expression quantification with featureCounts ‘-M –fraction’. The interaction analyis was performed following the same design as described above. For the downstream analysis of HLA genes, we selected HLA class I and class II genes that were upregulated upon treatment in both groups, using a nominal p-value < 0.1 as selection criteria.
Regarding the interaction analysis, in order to recover the real direction of change between the phenotypes at the treatment, for each patient we calculated gene-wise the log2 fold change of the treated over the untreated sample as such:
$${\log }_{2}F{C}_{{pz},g}={\mbox{rlog}}\left({\mbox{Ara}}{{\mbox{C}}}_{{\mbox{pz}},{\mbox{g}}}\right)-{\mbox{rlog}}\left({{\mbox{UT}}}_{{\mbox{pz}},{\mbox{g}}}\right)$$
(1)
The values were averaged gene-wise per phenotypic group:
$${\overline{{\log }_{2}FC}}_{{\mbox{phen}},g}=\frac{1}{N}{\sum }_{{pz}=1}^{N}{\log }_{2}F{C}_{{pz},g}$$
(2)
where g denotes the genes, pz indexes the patients and N is the number of patients in each phenotypic group (i.e., phen) ∈{Sen High, Sen Low}. Next, for each significant gene from the interaction analysis, we recalculated an interaction-log2FC between phenotypes:
$${x}_{g}={\bar{y}}_{g}-{\bar{z}}_{g}$$
(3)
(i.e., y = log2 Sen HighAraC/UT. and z = log2 Sen LowAraC/UT). With a custom function (find_directions), which considers individually the sign of the log2FC within each phenotype, we recovered the direction of gene deregulation with respect to the first term of the contrast. By calculating all the possible combinations of signs, we grouped the interaction-log2FC in at most six modules and assigned each significant gene exclusively to one of them:
$$\begin{array}{c}{x}_{g}={\overline{y}}_{g}-{\overline{z}}_{g}=\\ \left\{ \begin{array}{cc}\overline{y} > 0,\,\overline{z} > 0,\,\overline{y} > \overline{z} & up-regulated\,in\,y\,(homodirectional) \\ x > 0\, \left\{\overline{y}\right. < 0,\overline{z} < 0,\, \overline{y} > \overline{z} & down-regulated \, in \, z\,(homodirectional) \\ \overline{y} > 0,\,\overline{z} < 0\, & discordant,\,up\,in\,y \\ \overline{y} < 0,\,\overline{z} < 0,\,\overline{y} > \overline{z} & down-regulated\,in\,y\,(homodirectional)\\ x < 0 \, \left\{\overline{y}\right. > 0,\,\overline{z} > 0,\,\overline{y} < \overline{z} & up-regulated\,in\,z\,(homodirectional)\\ \overline{y} < 0,\,\overline{z} > 0 & discordant,\,down\,in\,y\end{array}\right.\end{array}$$
(4)
where x is a given gene interaction-log2FC obtained by the log difference between the average log2\(F{C}_{{phen}}\), calculated as before for each phenotypes. We distinguish between homodirectional cases where both contrasts have genes up-regulated, but (1) with significantly higher extent in the first phenotype of the contrast, (2) with higher extent in the second phenotype, and (3) we found divergent log2FC signs, with genes upregulated in one phenotype at treatment respect to the contrasted phenotype, and vice versa. The same categorization applies to down-regulate genes.
scRNA-seq analysis
The analysis of the published on the scRNA-seq dataset GSE146590, was conducted following the method section of the paper13. Differential expression analysis between the AraC and untreated cells within clusters was performed with the Wilcoxon Rank Sum test provided by the Seurat package FindMarkers function (v3.2.2). HLA genes with log2FC > 0 and Bonferroni-adjusted p-value < 0.1 were considered significantly modulated. The expression of the significant genes was plotted per cell cluster with the function Dotplot. Pre-processed data from collaborators36 were used to check genes expression programs with the function AddModuleScore in the Seurat R package. Cells with module score ≥ to the third quantile value of the total distribution were showed as a contour chart. The distribution of the module scores was represented using ridge plots with the RidgePlot function provided in the Seurat R package. Deconvolution of bulk RNA-seq was performed with MuSiC (v1.0.0) method70 using as a reference the NPM1mut single cell dataset.
Reference mapping analysis was conducted, with Seurat (v5.2.0), for the query scRNA-seq dataset GSE146590. As a reference, we tested two healthy datasets: a dataset of 8 healthy bone marrow samples from the geo series GSE11625637, and the human BoneMarrowMap38, which integrates 45 healthy donors. Furthermore, we tested as reference two diseased cohorts: the NPM1-mutant dataset36 (GSE185993) and the IDH-mutant dataset39 (GSE230559).
Peptide analysis
The function query_uniprot (queryup v1.0.5 package) allowed to map the Uniprot ID associated to each peptides (length 8–12) to the corresponding gene name. Peptides matching possible contaminants were filtered out. Replicate samples were merged by donor. The function compareCluster, from the clusterprofile package, was adopted for the over-representation analysis of the union of genes associated with peptides per group. The databases KEGG, Reactome and Biological Process from GO terms, were respectively tested with enrichKegg, enrichPathway (ReactomePA v1.34.0) and enrichGO function (parameters pvalueCutoff = 0.05, pAdjustMethod = “BH”).
CUT&TAG analysis
After adapter trimming with TrimGalore (v0.6.10, –quality 20, –length 25), alignment was performed with bowtie2 (v2.5.4, –local –very-sensitive –no-mixed –no-discordant –phred33 -I 10 -X 700), only properly paired reads, with no supplementay or secondary alignment, and mapping quality of at least 15 were retained for the subsequent steps. PCR duplicates were filtered out with picard MarkDuplicates tool (v3.1.1). ChrY, mithocondrial mapping reads and blacklisted regions (hg38 v2) were also filtered out. Macs2 (v2.2.9.1) with broad parameters was adopted for peak calling. A catalog of regions was calculated after merging the peaks between the untreated and tazemetostat treated sample (bedtools merge v2.31.1). The table of counts was calculated with (bedtools map), taking into account the fold enrichment file generated with macs2 bdgcmp function. As an exploratory analysis, the log2FC was calculated considering Tazemetostat (n = 1) vs Untreated (n = 1) in order to capture the direction of signal enrichment, and using a threshold of 1 to describe the trend of gain and loss regions. Chipseeker (v1.38.0) annotatePeak function was adopted for annotating all the catalog regions (with parameters sameStrand = FALSE, ignoreOverlap = FALSE, ignoreDownstream = FALSE, overlap = “all”, +/− 2000 bp around TSS and gencode v35). The track plots for rappresentative regions (ggcoverage v1.4.1) was generated over the RPKM normalized bigwig file computed with the bamCoverage function (deepTools v3.5.5).
Statistical analysis
Data were summarized as median with IQR (or range) or mean ± s.e.m. according to data distribution. For the analysis related to senescence evaluation, HLA expression, MLR, in vivo PDX experiments, inferential procedures were applied only when permitted by the sample size and experimental design. Non-parametric tests were performed when at least 3 biologically independent observations were available, whereas linear mixed-effects models were fitted only for datasets including at least 5 biologically independent observations. Otherwise, descriptive statistics were reported.
Spearman’s correlation coefficient was computed to evaluate the presence of a monotonic relationship between variables. Comparisons between two independent groups were performed using the Mann‑Whitney test, whereas comparisons among more than two groups were performed using the Kruskal‑Wallis test, followed by Dunn’s post hoc test. When required, the Bonferroni correction was applied to adjust for multiple testing. For matched data, the Wilcoxon signed-rank test was used for comparisons between two groups, whereas the Friedman test followed by Dunn’s post hoc test was used for comparisons among more than two groups. In the presence of non-independent observations due to donors or experiments being shared across groups, random-intercept linear mixed-effects models (LME)83 were fitted, including a donor- or experiment-specific random effect, nested when necessary. When needed, outcome variables were transformed (logarithmic, square‑root, cubic‑root, or ordered quantile normalization) to meet LME assumptions. Post hoc pairwise comparisons between treatment groups were performed after LME, applying Bonferroni correction for multiplicity. Whenever a directional hypothesis was supported by prior biological evidence or experimental rationale, one-tailed tests were conducted; otherwise, two-tailed tests were used. The significance threshold was set at 0.05 for all analyses. Statistical analyses were performed using GraphPad Prism v.10 (GraphPad) and R software (v.4.4.1; https://cran.r-project.org/). Exact sample sizes and additional details for each analysis are reported in the corresponding figure legends and in Supplementary Table 1.
Reporting summary
Further information on research design is available in the Nature Portfolio Reporting Summary linked to this article.
