


RAC1 overexpression accelerates HER2/ERBB2-driven tumorigenesis but does not increase metastasis
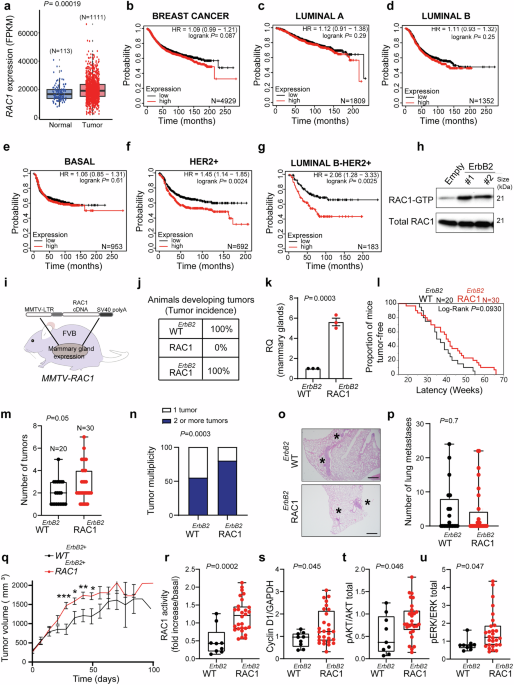
The overexpression of RAC1 has been proposed as a potential driver of malignant transformation in specific tumor types.24,25 We detected an elevation in RAC1 levels in invasive ductal breast carcinomas compared with normal mammary tissues (Fig. 1a). Moreover, RAC1 overexpression was associated with a significant trend toward poor outcomes in patients with breast cancer (Fig. 1b). Consequently, we explored whether RAC1 levels could differentiate between prognostically favorable and unfavorable forms within each intrinsic breast cancer subtype via the PAM50 subtype classification, as it offers a more precise intrinsic subtype categorization. We found that intratumoral RAC1 levels were associated with unfavorable outcomes only in HER2-enriched tumors and in luminal B-HER2+ tumors (Fig. 1c–g). Consistent with these findings, HER2 overexpression activated RAC1 (RAC1–GTP) in HEK293T cells (Fig. 1h). These findings align with those of previous studies showing that HER2/ErbB2 signaling can activate RAC1 through upstream regulatory modules, including RAC1-specific GEF-dependent mechanisms such as Vav2 or P-Rex1, thereby linking HER2 pathway activation to RAC1-GTP accumulation and enhanced cell motility.26,27
Fig. 1
RAC1 overexpression accelerates HER2/ErbB2-driven tumorigenesis but not metastasis. a In silico analysis of RAC1 mRNA expression in normal (n = 113) versus invasive (n = 1111) breast tumor tissues from the TCGA human dataset. b–g Kaplan‒Meier analyses of disease-free survival (DFS) based on RAC1 expression levels. Survival curves (Kaplan‒Meier) were obtained from the Kaplan‒Meier plotter database.39 (b) Analysis of all the breast cancer patients. c–g Analyses stratified by the PAM50 subtype or ER/HER2 status using the KM Plotter database.39 h Western blot analysis of RAC1 activity (PBD pull-down) in HEK293T cells showing increased activation following ErbB2 overexpression. i, j Generation and validation of the MMTV-RAC1ErbB2 transgenic mouse model (RAC1ErbB2). i Schematic of the transgene construct. j Tumor incidence. Note that MMTV-RAC1 single-transgenic mice (n = 24) did not develop tumors after 120 weeks of follow-up. k–u Characterization of mammary tumorigenesis, metastasis, and tumor signaling in WTErbB2 and RAC1ErbB2 double-transgenic mice. k qPCR validation of RAC1 mRNA overexpression in mammary glands (n = 3). RQ, relative quantification normalized to control WTErbB2+. l Tumor latency is shown as a Kaplan‒Meier curve. m Average number of tumors per mouse. n Tumor multiplicity, defined as the percentage of mice with two or more tumors. o Representative hematoxylin & eosin (H&E) staining of lung tissue. Asterisks denote metastatic foci. Scale bar, 500 µm. p Quantification of lung metastases per mouse (WTErbB2 n = 20; RAC1ErbB2 n = 28). q Tumor growth curves over time (n = 17 per cohort). r–u Quantification of signaling pathway activity in tumor lysates analyzed by Western blotting (WTErbB2, n = 9; RAC1ErbB2, n = 28). The graphs show the levels of (r) active RAC1-GTP, (s) Cyclin D1, (t) the pAKT/total AKT ratio, and (u) the pERK1/2/total ERK1/2 ratio. Representative immunoblots are shown in Supplementary Fig. 1f–h. The data in (m, p, r–u) are presented as box-and-whisker plots (min to max, showing all points) or as the mean ± s.e.m. (q). Statistical significance was determined by the log-rank test (l), chi-square test (n), or two-tailed t test for all other comparisons
To determine whether RAC1 is a driver of breast cancer development, we generated transgenic mice overexpressing RAC1 under the control of the MMTV promoter (Fig. 1i), which resulted in RAC1 overexpression in the mammary gland (Supplementary Fig. 1a). After 120 weeks, the MMTV-RAC1 mice did not develop breast tumors (Fig. 1j), suggesting that RAC1 overexpression alone is not enough to induce breast tumor formation.
To explore the involvement of RAC1 in the development of luminal-HER2+ tumors, we bred MMTV-RAC1 mice with MMTV-ErbB2-transgenic mice, which are known to develop luminal HER2/ErbB2-related tumors.28 This cross generated double-transgenic animals expressing both oncogenes in the mammary gland (Fig. 1k). For clarity, we will hereafter refer to the cohorts using the convention [RAC1 status] ^[ErbB2,status]. Thus, the double-transgenic mice were designated as RAC1ErbB2, and the single-transgenic MMTV-ErbB2 controls were designated as WTErbB2. Interestingly, compared with WTErbB2 control mice, RAC1ErbB2-overexpressing mice developed tumors with the same penetrance (Fig. 1j) and latency (Fig. 1l). However, they exhibited a significantly greater number of tumors and increased tumor multiplicity (Fig. 1m, n). Strikingly, this potentiation of primary tumor growth did not translate to an increased incidence or number of lung metastases (Fig. 1o, p).
This metastatic outcome contrasts with many reports suggesting that overexpression of RAC1 is sufficient to enhance the tumorigenic properties of cancer cells.19 Indeed, we transfected the HER2+ breast cancer cell lines HCC1569 and BT-474 with either GFP or GFP-RAC1 and found that elevated RAC1 levels enhanced migration and proliferation (Supplementary Fig. 1b–e). However, in vivo, elevated RAC1 levels did not affect metastasis. These results suggest that, in vivo, multiple signaling pathways likely regulate malignancies that are not present or active in vitro, which may modulate the role of RAC1 in metastasis.
We monitored tumor growth, measured as tumor volume, in each animal and found that the overexpression of RAC1 resulted in larger tumors (Fig. 1q). RAC1 is a small GTPase that interacts with effectors when it is activated (RAC1-GTP). Thus, we investigated whether the activity of RAC1 was affected in tumors generated from RAC1ErbB2 transgenic mice. We observed increased levels of active RAC1 in tumors generated from double-transgenic mice compared with those from their WTErbB2 counterparts (Fig. 1r and Supplementary Fig. 1f). Since Cyclin D1 is essential for breast cancer cell proliferation,29 we also evaluated its expression in these tumors. Stronger Cyclin D1 expression was observed in tumors from RAC1ErbB2 mice than in tumors from WTErbB2 mice (Fig. 1s and Supplementary Fig. 1g). Moreover, the PI3K/AKT and MEK/ERK signaling pathways represent among the most frequently dysregulated signaling axes in human cancer and are altered in more than 70% of breast cancers.30 Activation of these pathways promotes cell survival, growth, migration, and proliferation. Therefore, we analyzed the activation of these signaling pathways and found that AKT and ERK1/2 were more strongly activated in those tumors (Fig. 1t, u, and Supplementary Fig. 1h).
Taken together, these results indicate that RAC1 upregulation is not a direct cause of breast cancer itself; rather, in the presence of an oncogenic event such as HER2/ErbB2, it increases primary tumor burden and proliferation without affecting lung metastasis.
RAC1 SUMOylation is required for efficient HER2/ErbB2-driven metastasis
RAC1 overexpression did not increase mammary tumor metastasis in RAC1ErbB2 double-transgenic mice (Fig. 1). In contrast, previous work has shown that SUMOylation of RAC1 is required for breast cancer cell migration and invasion.14,23 Thus, we tested whether RAC1 SUMOylation was necessary for breast cancer metastasis. To address this question, we generated transgenic mice in which RAC1 was mutated in the four lysines necessary for SUMOylation13 (RAC1∆SUMO1) under the control of the MMTV promoter and then bred them with MMTV-ErbB2/Neu mice to generate double-transgenic MMTV-ErbB2+/RAC1∆SUMO1 mice (RAC1∆SUMO1ErbB2 after that) (Fig. 2a). We compared the expression of RAC1 in the mammary glands of the RAC1ErbB2 and RAC1∆SUMO1ErbB2 transgenic mice, and no significant differences in either transgene expression or endogenous RAC1 levels were detected (Fig. 2b and Supplementary Fig. 2a). Moreover, both RAC1 and RAC1∆SUMO1 were able to induce tumor formation with the same penetrance in the context of the ErbB2 transgene (Fig. 2c). We did not observe differences in latency (Fig. 2d), number of tumors or multiplicity (Fig. 2e, f). However, the expression of non-SUMOylated RAC1 resulted in a significant reduction in the number of lung metastases and the degree of metastasis without affecting the incidence of metastasis (Fig. 2g–i and Supplementary Fig. 2b).
Fig. 2
Overexpression of RAC1ΔSUMO1 reduces lung metastasis in HER2/ERBB2-driven mammary tumors. a RAC1∆SUMO1 overexpression under the MMTV promoter to generate MMTV-RAC1∆S1 transgenic mice. b Overexpression of RAC1 and RAC1∆SUMO1 (labeled “RAC1∆S1” in the panels) mRNA in the mammary glands of transgenic mice was quantified by qPCR (n = 3) (t-test). RQ, relative quantification normalized to control WTErbB2 expression. c Tumor incidence (percentage of mice developing tumors in RAC1ErbB2 and RAC1∆SUMO1ErbB2 mice). d Tumor latency of RAC1ErbB2 versus RAC1∆SUMO1ErbB2 mice. Kaplan–Meier curves and log-rank test. e Comparison of the average number of tumors per individual in RAC1ErbB2 and RAC1∆SUMO1ErbB2 mice; (t-test). f Comparison of tumor multiplicity: proportion of mice with ≥2 tumors (Chi-square test). g Lung sections stained with hematoxylin & eosin. The asterisk indicates the visualization of a metastatic focus. Scale bar, 500 µm. h Quantification of the number of lung metastases from (g); (t-test). Number of animals analyzed in (c–h): RAC1ErbB2 (n = 30) and Rac1ΔSUMO1ErbB2 (n = 32). (i) Lung metastasis multiplicity: proportion of metastasis-bearing mice with ≥2 lesions (chi-square test). j Representative immunoblot of RAC1 activity in tumors generated from RAC1ErbB2 and RAC1∆S1ErbB2 transgenic mice. Each number on top of the image (T1 to T4) represents an individual tumor. k Quantification of RAC1 activity in tumors from (j) (n = 28 per condition) (t-test). l Average tumor volume (mm3) over time (n = 14) (t-test). (m) Evaluation of proliferation through Ki67 immunohistochemistry in a tissue array (n = 10 mice per group). The inset shows a magnified view to highlight the details. Scale bar, 500 µm. n The proportion of Ki67-positive cells in (m) was quantified (Mann–Whitney U test). o Representative immunoblots of Cyclin D1 and ERK activity in tumors. Each number on top of the image (T1 to T4) represents an individual tumor. The protein expression of Cyclin D1 (p) and pERK/ERK (q) from (o) was quantified, and the normalized intensities were calculated relative to those of the controls (n = 28 per condition) (t-test)
RAC1 SUMOylation was identified as a crucial posttranslational modification (PTM) for maintaining RAC1 in its active state in response to migration.11 We subsequently analyzed the GTPase activity of RAC1 in those tumors and reported that RAC1∆SUMO1 was less active than RAC1 WT was in primary tumors (Fig. 2j, k), confirming the need for RAC1 SUMOylation to maintain RAC1-GTP levels.
In addition to this potential antimetastatic effect, we observed a modest but significant effect on primary tumor growth. Compared with those in the RAC1ErbB2 group, the tumors in the RAC1∆SUMO1ErbB2-overexpressing group were smaller (Fig. 2l). Moreover, Ki67 staining indicated that, compared with their RAC1∆SUMO1ErbB2 counterparts, tumors from RAC1ErbB2 mice had a greater proportion of proliferative cells (Fig. 2m, n). Additionally, we detected a decrease in Cyclin D1 expression, which was consistent with the changes in tumor growth observed in the RAC1∆SUMO1ErbB2 mice (Fig. 2o, p). However, we detected a reduction in only ERK activity, not AKT activity, in the tumors generated from the RAC1∆SUMOErbB2-mutant mice (Fig. 2o, q and Supplementary Fig. 2c, d).
Notably, when the pathophenotypes and signaling pathways across the three genotypes (WT, RAC1, and RAC1ΔSUMO1) were compared, the absence of SUMOylation reduced the effects of RAC1 overexpression to near WT levels (Supplementary Fig. 2e–g).
Taken together, these results suggest that RAC1 SUMOylation is required for efficient HER2/ErbB2-driven metastatic dissemination and contributes, in the context of RAC1 overexpression, to proliferative signaling downstream of HER2/ErbB2.
A RAC1 SUMOylation-deficient knock-in model uncouples tumorigenesis from metastasis
The overexpression of the SUMOylation-deficient RAC1 variant affects the metastatic capacity of tumors generated in transgenic mice. To complement the transgenic model described above and determine the contribution of SUMOylation under physiological conditions, we generated RAC1K4R knock-in mice in which the four lysines susceptible to SUMOylation were replaced by arginines (Fig. 3a–c). The generated mice presented no issues during development or breeding capacity, and the RAC1K4R mice were viable and fertile and exhibited no gross developmental or behavioral abnormalities.
Fig. 3
A RAC1 SUMOylation-deficient knock-in mouse model uncouples primary tumor growth from metastasis. a Schematic of the lysines in the polybasic region of RAC1 that are SUMOylated. b Generation of a knock-in mouse in which RAC1 cannot be SUMOylated. The number of individuals (N) belonging to the WTErbB2 and RAC1K4RErbB2 cohorts is shown. c Sequencing of the mutated bases in a RAC1K4R mouse. d Tumor latency of WTErbB2 and RAC1K4RErbB2. Kaplan–Meier curves and log-rank test. e Incidence of breast cancer in RAC1K4RErbB2 mice after 120 weeks of follow-up. Controls were WTErbB2 littermates from the same RAC1K4R crosses (mixed C57BL/6J × FVB background) (see methods) (Chi-square test). f Comparison of the number of tumors (t-test). Number of animals analyzed in (d–f): (WTErbB2 n = 28; RAC1K4RErbB2 n = 31) g Average tumor growth over time (n = 18) (t-test). (h) Representative immunoblot of Cyclin D1 expression in tumors. Each number on top of the image (T1 to T4) represents an individual tumor. i The Cyclin D1 protein from (h) was quantified, and the normalized intensities were calculated relative to those of the controls (t-test). WTErbB2 n = 22; RAC1K4RErbB2 n = 26. j Lung sections stained with hematoxylin & eosin. The asterisk indicates the visualization of a metastatic focus. Scale bar, 500 µm. k Lung metastasis incidence (Fisher test). l Quantification of the number of lung metastases from (j) (WTErbB2, n = 28; RAC1K4RErbB2, n = 31) (t-test). m Representative immunoblot of RAC1 activity in tumors generated from WTErbB2 (n = 22) and RAC1K4RErbB2 mice (n = 26). T1 to T4 are tumors derived from the same condition. n Quantification of RAC1 activity in tumors from (m)
RAC1K4R knock-in mice were crossed with MMTV-ErbB2/Neu (WTErbB2) model mice, and RAC1K4RErbB2-knock-in mice were compared with WTErbB2 littermate controls (Fig. 3b). We found that in both WTErbB2 mice and RAC1K4RErbB2 mice, tumor formation was induced with the same penetrance, and there were no differences in the latency or number of tumors (Fig. 3d–f). Moreover, no differences in tumor growth were detected (Fig. 3g), which is consistent with the lack of differences in Cyclin D1 expression in those tumors (Fig. 3h, i). However, the absence of SUMO sites in RAC1 significantly reduces the metastatic capacity of breast tumor cells. Thus, a reduction in the incidence of lung metastasis and in the number of metastases was observed (Fig. 3j–l).
RAC1 SUMOylation is required for the maintenance of its activity in response to a migratory stimulus. Therefore, we analyzed the activity of RAC1 in the tumors generated in response to ErbB2 expression and reported that the activity of RAC1 was reduced in the knock-in mice (Fig. 3m, n), but no differences were observed in pAKT or pERK1/2 signaling (Supplementary Fig. 3a–c).
Taken together, the RAC1K4R model clearly distinguished the function of RAC1 in HER2/ErbB2-driven proliferation from its essential, SUMOylation-dependent role in metastasis.
A rationally designed peptide inhibitor of RAC1 SUMOylation impairs the metastatic phenotype of breast cancer cells
The results obtained in mice highlight the role of RAC1 SUMOylation in the process of tumor dissemination. Thus, we evaluated the therapeutic potential of inhibiting the SUMO1 modification of RAC1. Phosphatidylinositol-4-phosphate 5-kinase β (PIP5Kβ) is a known effector of RAC1 that interacts with the C-terminal region of RAC1, where the hypervariable (HVR) region is located, including the polybasic region that contains the four lysines that are SUMOylated.31 We used the sequence of 19 amino acids present in PIP5Kβ, which is necessary for interaction with RAC1, to design a peptide, the RAC1-SUMO1 inhibitor (PRASI) (Fig. 4a). Biochemical validation confirmed that PRASI physically interacts with both wild-type and constitutively active RAC1 (Fig. 4b) and directly inhibits its SUMOylation in vitro (Fig. 4c).
Fig. 4
A peptide inhibitor of RAC1 SUMOylation reduces RAC1 activity and impairs cell migration. a RAC1 sequence indicating the C-terminal region that interacts with the PIP5Kβ protein, where the hypervariable region (HVR) is located, including the polybasic region (PBR, in blue) with SUMOylation lysines (in blue and bold). The 19 amino acids that make up the PRASI peptide are represented. b Interaction of the indicated peptide with GFP, GFP-RAC1, and GFP-RAC1V12 proteins obtained from transfected HeLa cells. c Representative image of in vitro RAC1 SUMOylation. As a control, the reaction was not incubated at 37 °C to identify non-SUMOylated bands (um: unmodified). E1: enzyme SAE1/2; E2: enzyme Ubc9. E1 and E2 are enzymes involved in the SUMOylation machinery. d Fluorescence images of MDA-MB-231 cells transfected with GFP and GFP-PRASI (upper panel) for 24 h. The images show GFP expression (green) and cytoskeletal and membrane structures composed of F-actin after phalloidin-594 staining (red). Scale bar, 20 µm. e Quantitative analysis of cell circularity in GFP-PRASI cells compared with that in control cells (GFP). Data are presented as the log2-fold change (log2FC) from four independent experiments (N = 4); the dashed line indicates the baseline (log2FC = 0). Boxplots represent the median and IQR. Statistical significance was determined by a one-sample t-test (two-tailed). f Transwell migration assays showing the number of migrating MDA-MB-231 breast cancer cells overexpressing GFP or GFP-PRASI (n = 6) (Mann‒Whitney test). g Representative western blot of MDA-MB-231 cells probed for active RAC1 in response to GFP or GFP-PRASI overexpression. h Quantification of the relative normalized amounts of RAC1–GTP in (g). Data from three independent experiments are presented as the mean ± SEM, and statistical analysis was performed using a t-test. i Representative image of subcellular fractionation showing the membrane and cytoplasmic proteins of cells transfected with GFP or GFP-PRASI. Anti-GFP was used to identify the localization of both proteins, while anti-RAC1 was used to detect changes in its localization. Cortactin served as a membrane marker, and tubulin served as a cytoplasmic marker. j Quantification of the cytoplasmic RAC1 signal from (i) relative to that of the control (n = 3) (t-test). k Representative western blot of T47-D cells probed for active RAC1 in response to GFP or GFP-PRASI overexpression. l Quantification of the relative normalized amounts of RAC1–GTP in (k) (n = 3) (t-test) (m) Transwell migration assays showing the number of migrating T47D breast cancer cells overexpressing GFP or GFP-PRASI (n = 4) (Mann‒Whitney test). n Representative western blot of MDA-MB-231 cells probed for active RAC1 in response to doxycycline treatment (n = 4) (t-test). o Proliferation of untreated (-dox) and doxycycline-treated (+dox) cells over time (MDA-MB-231 cells) (n = 3)
To determine whether the metastatic effect of RAC1-SUMO1 may have therapeutic implications in humans, we investigated the effect of PRASI expression in metastatic breast cancer cell lines. The triple-negative breast cancer cell line MDA-MB-231 was transfected with either GFP (control) or a GFP-PRASI fusion protein. We confirmed that the fusion protein interacted with endogenous RAC1 (Supplementary Fig. 4a, b). Effective cell migration requires cellular polarization, involving a transition from a symmetrical, rounded shape to an elongated morphology with defined leading and trailing edges. Consistent with the role of RAC1-SUMO1 in cell migration,13,14 GFP-PRASI-positive cells, but not those expressing GFP alone, exhibited a less migratory and invasive phenotype characterized by increased cell circularity and reduced membrane ruffle or lamellipodia formation (Fig. 4d, e and Supplementary Fig. 4c) and markedly suppressed cell migration (Fig. 4f).
RAC1 SUMOylation is reportedly required to maintain the active form of RAC1 in response to migration.13 Thus, we analyzed the activity of RAC1 in these cells and found that GFP-PRASI transfection reduced RAC1 activity (Fig. 4g, h). Similar results were observed in the HER2+ breast cancer cell line HCC1569 (Supplementary Fig. 4d). Additionally, we observed an increase in cytoplasmic RAC1 levels in response to RAC1-SUMO1 inhibition, which was consistent with the reduction in active RAC1 required in the membrane to regulate changes in the actin cytoskeleton during cell movement32 (Fig. 4i, j).
RAC1 activity is greater in metastatic breast cancer cell lines than in less aggressive cell lines23 (Supplementary Fig. 4e). We therefore assessed whether the effects of PRASI extended to cell lines with lower levels of RAC1 activation. The inhibition of RAC1 SUMOylation also reduced the activity of RAC1 and the migratory capacity of the less metastatic luminal breast cancer cell line T47-D (Fig. 4k–m).
Crucially, to confirm that these effects were specific to migration and not due to general cytotoxicity, we used a doxycycline-inducible expression system (Supplementary Fig. 4f). Using a doxycycline-inducible vector to drive the expression of PRASI, we observed similar results regarding the reduction in RAC1 activity, migration, and invasion (Fig. 4n and Supplementary Fig. 4g, h) but no differences in cell proliferation (Fig. 4o).
These results suggest that inhibiting RAC1 SUMOylation by overexpressing a peptide that interacts with the polybasic region reduces the metastatic capacity of RAC1 in breast cancer cells.
Inhibition of RAC1 SUMOylation with PRASI reduces breast cancer invasion and metastatic spread in vivo
Once the inhibitory role of PRASI overexpression in breast cancer cell lines was confirmed, we analyzed the potential therapeutic role of the peptide. To enable the peptide’s internalization into the cell, the TAT sequence was added to the N-terminus of the PRASI amino acid sequence. TAT is a cell-penetrating peptide consisting of amino acids 47–57 of the transactivator of transcription (TAT) protein from human immunodeficiency virus (HIV). It is characterized by a high number of positive charges, which allow it to cross the cell membrane, enter the cell, and release any attached cargo,33 in this case, the PRASI peptide (hereafter, TAT-PRASI).
We confirmed that TAT-PRASI interacts with RAC1 and effectively reduces RAC1 SUMOylation both in vitro and in vivo (Fig. 5a, b and Supplementary Fig. 5a) without altering overall SUMO protein levels (Supplementary Fig. 5b). Moreover, TAT-PRASI efficiently penetrated cells, as evidenced by the cytoplasmic signal detected 5 h post-incubation (Fig. 5c). Consequently, it reduced RAC1 activity (Fig. 5d), as well as the migratory and invasive capabilities of metastatic breast cancer cell lines from different molecular subtypes, ranging from less aggressive luminal (T47-D) to more aggressive HER2+ (HCC1569 and BT-474) and triple-negative subtypes (MDA-MB-231) (Fig. 5e–g and Supplementary Fig. 5c–e). Furthermore, depletion of RAC1 and treatment with TAT-PRASI did not further reduce the migration of BC cells, suggesting that this peptide is specific for RAC1 (Supplementary Fig. 5f). Moreover, we analyzed the activity of other members of the Rho family of small GTPases, CDC42 and RHOA, and did not observe any differences in response to TAT-PRASI treatment (Supplementary Fig. 5g, h).
Fig. 5
TAT-PRASI reduces breast cancer invasion and metastatic spread in vivo. a Representative image of in vitro RAC1 SUMOylation with 5 µM TAT-PRASI peptides. As a control, the reaction was not incubated at 37 °C to identify non-SUMOylated bands (um: unmodified). E1: enzyme SAE1/2; E2: enzyme Ubc9. E1 and E2 are enzymes involved in the SUMOylation machinery. b Representative image of endogenous RAC1-SUMO1 levels in the MDA-MB-231 cell line treated with 10 µM TAT or TAT-PRASI peptide for 24 h (RAC1-GTP PD was performed to detect SUMOylated RAC1). c Immunofluorescence images of MDA-MB-231 cells treated with FAM-TAT-PRASI for 5 h. DAPI staining (blue) was used to label the cell nuclei, and the FAM fluorescent signal (green) was visualized for each sample. Scale bar, 20 µm. d Representative western blot of T47-D cells probed for active RAC1 in response to TAT or TAT-PRASI. Transwell invasion assays showing the number of invading e T47-D, f HCC1569 and g MDA-MB-231 breast cancer cells treated with the indicated peptides for 24 h (n = 4) (Mann‒Whitney test). h Immunofluorescence images of MDCKII cells treated with TAT (left image) and TAT-PRASI (right image) in response to HGF. The cell nuclei were stained with DAPI (blue), and the cytoskeletal structures were stained with phalloidin-594 (red). Scale bar, 100 µm. i Quantification of large cellular aggregates (>2000 px²) relative to the total number of events. Data were processed using an automated R-based pipeline for unbiased gating. Statistical significance was assessed by a paired Student’s t-test (p < 0.05). TAT-PRASI treatment induces a shift toward a cohesive, multicellular colonial organization. (j) Quantification of scattered or dispersed colonies from (h) (n = 5) (Fisher test). k Representative images of tumors obtained from xenografts 7 days after inoculation. Scale bar centimeter (cm). l Tumor weight after inoculation of the chorioallantoic membrane (CAM) (n = 14) (t-test). m Quantification of MDA-MB-231 cells in the bone marrow using Alu sequences. Data are presented as the mean ± s.d.; each dot represents an independent animal. Tumors were treated with TAT (n = 24) or TAT–PRASI (n = 27) (t-test). n Upper panel: Representative immunoblot of RAC1 activity in xenograft tumors. Each number on top of the image (T1 to T4) corresponds to an individual tumor. Lower panel: Quantification of RAC1-GTP bands normalized to those of the controls (n = 12) (t-test). o Representative images of EO-771 tumor cell dissemination to the adjacent mammary gland. Luciferase-expressing EO-771 Luminal-ErbB2 mouse cancer cells were injected into the second mammary gland of the mice; the animals were treated with 10 nmol TAT or TAT-PRASI, and the metastatic burden was monitored using an IVIS imaging system. p The incidence of proximal metastasis was calculated as the percentage of mice showing metastatic dissemination in each group (TAT (n = 11)/TAT-PRASI (n = 13) (Fisher’s test). q Weights of primary tumors at the endpoint. r Representative image of invasion into collagen I by patient-derived organoids (PDOs) in response to 10 µM TAT or TAT-PRASI treatment. s Quantification of the invasion area by two different patient-derived organoids (PDOs). Each dot represents a measurement from one organoid. The invasive area was calculated as the organoid area at t = 5 h minus the area at t = 0 (Mann‒Whitney test). t Quantification of the invasion area in patient-derived organoids (#BBC210T1) in response to the indicated peptides and the RAC1 inhibitor EHop-016. Each dot represents a measurement from one organoid. (ANOVA with Dunnett’s posttest; *p ≤ 0.01; ***p ≤ 0.001)
Solid tumors induce the epithelial–mesenchymal program to initiate tumor dissemination. Thus, to evaluate whether PRASI could inhibit the migratory capacity of tumor cells in the early stages of this process, we induced EMT in the epithelial cell line MDCKII in response to hepatocyte growth factor (HGF), as it has been shown to require the SUMOylation of RAC1.13 We quantified cell scattering by analyzing the proportion of multicellular colonies (>2000 px²) relative to single cells. While individual morphological parameters (circularity and aspect ratio) showed high interexperimental variability, compared with the TAT control, TAT-PRASI significantly increased colony cohesion (Fig. 5h, i). Consistent results were obtained by quantifying the number of colonies initiating dispersion (scattering) (Fig. 5j), which was associated with reduced EMT-associated signaling (Supplementary Fig. 5i).
Together, these results support an inhibitory effect of TAT-PRASI on HGF-induced scattering and EMT-associated signaling.
To investigate the relevance of our findings in vivo, we inoculated the chorioallantoic membrane (CAM) of 10-day-old chicken embryos with metastatic breast cancer cells and treated them with TAT or TAT-PRASI (Supplementary Fig. 5j). The tumors derived from the MDA-MB-231 cells treated with TAT were larger and heavier than those developed under TAT-PRASI conditions (Fig. 5k, l). We confirmed that those tumors presented reduced total RAC1-SUMO1 levels (Supplementary Fig. 5k).
We detected disseminated tumor cells (metastases) in the bone marrow via PCR-mediated amplification of human-specific ALU sequences. A decrease in relative metastasis was observed when the breast cancer cells were treated with TAT-PRASI (Fig. 5m).
We subsequently investigated whether TAT-PRASI affects RAC1 activation in MDA-MB-231 cell-derived tumors and, consequently, metastasis. When we performed a pull-down assay of RAC1 on extracts from TAT- and TAT-PRASI-treated tumors, we observed lower levels of active RAC1 in tumors treated with PRASI (Fig. 5n). Additionally, we detected a decrease in Cyclin D1 expression in response to TAT-PRASI, which was consistent with the changes in tumor weight observed under these conditions. Moreover, we analyzed the activation of two important signaling pathways deregulated in cancer and found that AKT was less activated in response to PRASI, but no differences were observed in ERK1/2 activation (Supplementary Fig. 5l–o).
Because RAC1 is involved in the activation of the EMT program, an early step in the metastatic cascade, we further evaluated the effect of PRASI on metastasis in vivo using a syngeneic model in which tumor cells disseminate from the primary tumor in the mammary gland to proximal sites. Luciferase-expressing EO-771 Luminal-ErbB2 mouse cancer cells were pretreated with TAT or TAT-PRASI before implantation, and mice then received intraperitoneal 10 nmol of control peptide TAT or TAT-PRASI three times per week for two weeks.
We found a significant reduction in proximal metastasis incidence (Fig. 5o, p), indicating that inhibition of RAC1-SUMO1 reduces breast cancer metastatic spread. However, primary tumor weight at endpoint was not significantly altered by TAT-PRASI treatment (Fig. 5q). These results suggest that the differences in tumor growth observed in the CAM model in response to PRASI treatment may be due to additional effects of PRASI in this system, where the peptide is applied directly onto the vascularized membrane that supports tumor cell growth and in which RAC1 could play a role.
To confirm the therapeutic role of PRASI in patients, we generated organoids from tumor cells obtained from luminal-HER2-positive samples. These patient-derived organoid (PDO) samples were exposed to collagen I in the presence or absence of PRASI, and invasion was evaluated. We observed that the presence of PRASI reduced the migratory and invasive capacity of the organoids in samples from two different patients (Fig. 5r, s). Notably, treatment of organoids with a RAC1 activity inhibitor34 resulted in a more pronounced effect than that observed with the peptide (Fig. 5t). This comparison is highly significant, as it suggests that inhibiting SUMOylation selectively neutralizes the pro-invasive pool of RAC1, while potentially sparing other essential functions. This strategy could therefore offer a wider therapeutic window and lower cytotoxicity compared to global RAC1 inhibition.
Having established that pharmacological inhibition of RAC1 SUMOylation is a viable anti-metastatic strategy, we next sought to elucidate the precise molecular mechanism by which this PTM controls the invasive machinery of the cell.
RAC1 SUMOylation drives invadopodia formation via the PIAS3-POTEE axis
Depending on which signaling pathways are altered during tumor formation, specific RAC1-GEFs are selectively recruited, leading to RAC1 activation that drives tumor cell dissemination. Regarding RAC1 SUMOylation, our group has reported that RAC1 SUMOylation enables its interaction with POTEE (POTE Ankyrin domain family member E), which recruits the GEF TRIO to activate RAC1 at invadopodia, contributing to breast cancer malignancy.23
First, we established the clinical relevance of POTEE using public databases, finding that POTEE expression was elevated in breast invasive breast carcinomas (Supplementary Fig. 6a–c). Moreover, POTEE is expressed in breast tumors generated in the MMTV-ErbB2 model (Supplementary Fig. 6d); therefore, we wondered whether RAC1 promotes metastasis through its interaction with POTEE. We confirmed that TAT-PRASI treatment disrupted the coimmunoprecipitation of POTEE with GFP-RAC1 (Fig. 6a). Consequently, in a system in which invadopodia formation was robustly induced by myc-POTEE overexpression and PBDu stimulation, TAT-PRASI potently impaired the assembly of these invasive structures (Fig. 6b, c). This structural defect led to a functional defect, as gelatin zymography revealed markedly reduced MMP2/9 secretion (Fig. 6d).
Fig. 6
RAC1 SUMOylation drives invasion by promoting the PIAS3-POTEE invadopodia axis. a–d Pharmacological inhibition of the pathway with TAT-PRASI. a Coimmunoprecipitation (Co-IP) in MDA-MB-231 cells transfected with GFP-RAC1, showing that TAT-PRASI disrupts the interaction with endogenous POTEE. TAT-PRASI impairs invadopodia formation. Representative immunofluorescence images (b) and quantification (c) of MDA-MB-231 cells overexpressing myc-POTEE and stimulated with PBDu. The data are presented as the means ± SDs from three independent experiments. (Mann‒Whitney test). Scale bar, 20 µm. d Gelatin zymography showing reduced MMP-2 and MMP-9 secretion from TAT-PRASI-treated cells (n = 3 per group) (Mann‒Whitney test). e PIAS3 expression is clinically relevant. Bioinformatics analysis revealed that PIAS3 mRNA expression is elevated in breast tumors (N = 45) compared with normal tissue (N = 5). The data were collected from a public dataset of breast cancer (GSE36295). f PIAS3 expression in normal breast tissue, primary breast tumor tissue, and metastatic tissue samples from public datasets.38 g Kaplan‒Meier analysis showing the association of high PIAS3 expression with poor survival in HER2+ patients (n = 1173); log-rank test. Survival curves (Kaplan‒Meier) were obtained from the Kaplan‒Meier plotter database.39 h–j PIAS3 knockdown reduces RAC1 activity and cell migration. h Representative immunoblot of RAC1 activity. i Graphs showing the quantification of RAC1-GTP levels from (h). j Transwell migration of MDA-MB-231 cells treated with control or PIAS3 siRNA (n = 3) (t-test). k, l PIAS3 knockdown impaired invadopodia formation in MDA-MB-231 cells expressing myc-POTEE. Representative images (k) and quantification (l). The data are presented as the means ± SDs from three independent experiments. (Mann‒Whitney test). Scale bar, 25 µm. Reduced MMP-2/-9 secretion, as shown by a representative zymogram (m) and quantification (n, o). The data are presented as the means ± SEMs from three independent experiments. p Decreased Transwell invasion in PIAS3-depleted cells (n = 4 per group; t-test)
A key question is whether these effects result specifically from blocking SUMOylation or from general occlusion of the polybasic region (PBR), which serves as a binding hub for multiple effectors.35,36,37 To genetically elucidate the role of SUMOylation, we focused on PIAS3, the E3 ligase for RAC1. First, we established its clinical relevance using public databases and reported that PIAS3 expression was elevated in breast tumors, was highest in metastatic samples, and was associated with poor prognosis in HER2+ and triple-negative subtypes38,39 (Fig. 6e–g and Supplementary Fig. 6e).
Crucially, silencing PIAS3 with siRNA phenocopied the effects of the PRASI inhibitor, providing genetic support for the proposed SUMO-dependent mechanism. PIAS3 knockdown reduced RAC1 activity and cell migration (Fig. 6h–j). Moreover, it recapitulated the specific defects in the invasive machinery: PIAS3 depletion selectively impaired invadopodia formation, whereas other actin-rich structures, such as membrane ruffles, were largely unaffected in both TNBC and HER2+ cell lines (Fig. 6k, l and Supplementary Fig. 6f). This led to reduced MMP secretion and a profound loss of invasive capacity (Fig. 6m–p).
Taken together, these findings establish a mechanistic axis for cancer cell invasion: PIAS3-mediated SUMOylation of RAC1 is required for its interaction with POTEE, which in turn is essential for the assembly of functional invadopodia and subsequent matrix degradation.
