


Synthesis and isolation of all related compounds
All available compounds were purchased from commercial suppliers around the world. All solvents for synthesis were purchased from local suppliers, and solvents of high-performance liquid chromatography (HPLC)-grade were purchased from Fisher Scientific. The synthetic routes and chemicals used for all related compounds are shown in Supplementary Information section 2 (Core PhoPEx structure was prepared following a reported method48). Both UPLC-mass spectrometry and high-resolution mass spectrometry were used to assess the quality of all compounds and are provided in Supplementary Information section S6.
Proteins and antibodies
FAP (C14G) were purchased from Novoprotein. DPPIV (HY-P70017), PREP (HY-P703584), ALB (HY-P1956A) and ALP (HY-P2818) were purchased from MCE. CTSB (C6286) were purchased from Sigma. PD-L1 (PD1-H5229 and PD1-H82E5) were purchased from ACRObiosystems. Sibrotuzumabs were purchased from WuXi Biologics. Rabbit monoclonal anti-FAP antibody was purchased from Abcam, ab207178, clone EPR20021, 1:50; mouse monoclonal anti-CK (pan) antibody from ZSGB-BIO, ZM-0069, clone AE1/AE3, 1:100; mouse monoclonal anti-CK5/CK6 antibody from ZSGB-BIO, ZM-0313, clone OT1F8, 1:100; mouse monoclonal anti-CK7 antibody from ZSGB-BIO, ZM-0071, clone UMAB161, 1:100; and rabbit monoclonal anti-PD-L1 antibody from Abcam, ab205921, clone 28–8, 1:250.
Chemical reaction rate detection
The purified substrate was dissolved in DMF to prepare a stock solution, then diluted to a concentration gradient (2 mM to 0.2 mM). Each solution was analysed by UPLC-MS with ultraviolet detection; peak areas were integrated at λmax, and the process was repeated in triplicate to generate a standard curve. For reactivity assays, each reaction mixture (300 μl) contained 1.5 mM substrate, 6 mM tetramethylguanidine and 22.5 mM Tyr-OMe-NAc (15 equiv.) at 37 °C. At timed intervals, aliquots (30 μl) were withdrawn, vortexed, centrifuged and quenched with 30 μl of 40 mM formic acid in acetonitrile. Quenched samples were analysed by UPLC-MS; concentrations were determined from the standard curve. Pseudo-first-order kinetics were fitted to obtain second-order rate constants. For the faster substrates (nos. 11 and 12), conditions were adjusted to 1 mM substrate, 1 mM tetramethylguanidine and 2 mM Tyr-OMe-NAc (2 equiv.), and second-order kinetics were directly simulated. Stability evaluation was performed in pH 9.5 PBS containing 1.5 mM substrate, using the same detection method as in the reactivity assay.
Detection of release experiments in vitro
For the experimental group, the molecular stock solution was diluted with PBS and then mixed with the protein solution at an appropriate ratio (protein:small molecule = 4:1 or 5:1). The mixture was incubated at 37 °C, and aliquots were withdrawn at designated time points. The concentration of the molecule was determined using a pre-established standard curve. For the control group, the molecular stock solution was diluted with PBS to the same concentration and incubated under identical conditions without protein. Each condition was performed in three independently prepared samples. Fluorescent molecules were detected using a microplate reader; molecules lacking strong characteristic absorption (for example, MMAE) were quantified by UPLC-MS.
Human lymph node staining and IHC
Human lymph node tissue excised by clinicians was cleaned to remove the surrounding adipose tissue and bisected with a surgical blade. One half was paraffin-embedded, sectioned into 4 µm slices and stained with haematoxylin and eosin for histology. For IHC, sections were deparaffinized in xylene, rehydrated through graded ethanol and subjected to antigen retrieval by microwave treatment in citrate buffer (pH 6.0). The other half was immersed in a fluorescent molecule solution, agitated at 37 °C for 40 min, then washed three times with PBS (10 min at 37 °C with agitation for each wash). Finally, the tissue was imaged using a near-infrared fluorescence imaging system. The use of patients’ lymph nodes was approved by the Institutional Review Board of the Cancer Hospital, Chinese Academy of Medical Sciences, under approval no. 25/328–5274.
Procedures for radiolabelling and PET/SPECT-CT imaging
The radiolabelling and imaging were in accordance with previous literature49. For radiolabelling, the reaction mixture was prepared in 0.2 M sodium acetate buffer (pH 4.0–4.5) containing the appropriate labelling molecule (10 nmol) and the corresponding radionuclide (177Lu, 68Ga or 86Y). The mixture was heated at 90–95 °C for 10–15 min and then allowed to cool. To purify the mixture, the cooled reaction product was filtered through a pre-conditioned Sep-Pak Light C18 cartridge using deionized water, with the aim of removing unbound radionuclides. The radiolabelled compound was subsequently eluted with ethanol. This eluate was then diluted with saline for use in follow-up experiments. Where needed, ethanol was eliminated by nitrogen blowing using a Termovap sample concentrator before the dilution step. Evaluation of radiochemical yield was conducted using a radioactivity meter, and radiochemical purity was analysed by radio-HPLC. PET/SPECT-CT imaging for animals was performed on a Mediso nanoScan PET 122S system (Mediso) or InliView-3000B PET/SPECT/CT imaging system (Novel Medical) with mice injected with compounds through the tail vein. Mice were anaesthetized with isoflurane in oxygen 10 min before each imaging time point. Standard data acquisition and image reconstruction of the PET or SPECT data were performed. Data analysis was performed on Interview Fusion software (v.3.09.008.0000) and NMSoft-AIWS software (v.1.8).
Tumour xenograft construction and treatment experiments
For CDX models targeting FAP, HT-1080 or HT-1080-FAP cells (5 × 10⁶ in PBS) were implanted subcutaneously into the right flank of 6–8-week-old female NU/NU nude mice, whereas MC38-FAP cells (5 × 10⁵ in PBS) were implanted into 4–6-week-old female C57BL/6 mice. For CDX models targeting PD-L1, HT-1080 cells (5 × 10⁶ in PBS) were implanted into 6–8-week-old female BNDG mice.
For all PDX models, BNDG mice aged 6–8 weeks were used, with the sex matched to that of the patient from whom the tumour specimen was obtained. Primary patient tumour tissue was directly implanted subcutaneously to generate the P1 generation. Once the P1 tumour had grown to 1,000–1,500 mm3, it was harvested and cut into fragments of approximately 3 mm in diameter, which were then implanted by puncture into the forelimb axilla of recipient mice to establish the P2 generation. Subsequent passages were performed in a similar manner. The final generation used for treatment was subjected to PET imaging and IHC to evaluate target expression. The use of patients’ tissues for PDX modelling was approved by the Institutional Review Board of the Cancer Hospital, Chinese Academy of Medical Sciences, under approval no. 25/328-5274, and by the Institutional Review Board of Beijing Cancer Hospital, under approval no. 2026KT67.
All animal experiments were performed in accordance with protocols approved by the Institutional Animal Care and Use Committee of Peking University, under approval no. CCME-LiuZB-2, and by the Institutional Animal Care and Use Committee of Chinese Institute for Brain Research, Beijing, under approval no. CIBR-IACUC-071. The tumour volume was computed using the formula: volume = (length × width2)/2. In none of the experiments did the tumour burden surpass 10% of mouse weight and 25% weight loss compared with the original weight (according to the limits defined by the IACUC protocol).
Cell culture
The HT1080-FAP cells customized by WuXi AppTec were cultured in Eagle’s minimum essential medium containing 10% fetal bovine serum (FBS), 1% antibiotic–antimycotic and 4 μg ml−1 blasticidin S. HT1080 cells (WuXi AppTec) were cultured in minimum essential medium containing 10% FBS, 1% antibiotic–antimycotic. The U87MG-FAP and U87MG-Vector (both from Pyrotech Biotechnology) were cultured in minimum essential medium containing 10% FBS, 1% antibiotic–antimycotic and 2 μg ml−1 puromycin. The MC38-FAP cells (WuXi AppTec) were cultured in Dulbecco’s modified Eagle medium containing 10% FBS, 1% antibiotic–antimycotic and 3 μg ml−1 puromycin. All cells were regularly tested for mycoplasma contamination and cultured or incubated (as in cell-based assays) in a 5% CO2 incubator at 37 °C.
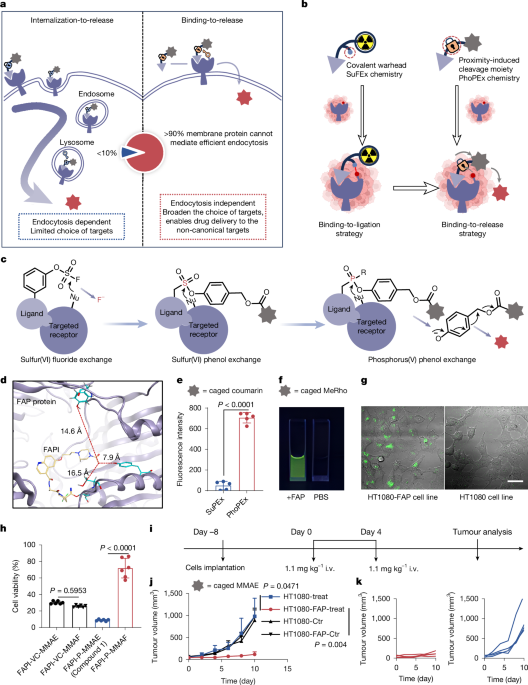
For the fluorescent assay, cells were seeded in eight-well confocal dishes and incubated with different compounds (FAPI-PhoPEx-MeRho at 10 μM for 24 h, compound 3 and FAPI-VC-MeRho at 2 μM). Fluorescence was observed at room temperature using a Nikon A1R-si Laser scanning confocal microscope. The fluorescence intensity was measured using ImageJ.
Half-maximal inhibitory concentration
Initially, two types of cells were seeded into a 96-well plate at a density of 5,000 cells per well and cultured in an incubator maintained at 37 °C for 12 h. A series of drug solutions with concentration gradients was then prepared using complete cell culture medium. After aspirating the original medium, the drug solutions were added for treatment. Following 6 h (compound 5, mF substitution) to 12 h (compound 1, no substitution) of incubation, the drug solutions were removed, and the cells were gently washed with PBS. Fresh drug-free complete medium was then added, and the cells were cultured for an additional 24 h. Finally, cell viability was assessed using the CCK-8 reagent.
Biological distribution experiment
The biological distribution experiments of each compound were evaluated by four groups of mice, each group containing 6 mice, which were euthanized at 2, 6, 24, 48, 72, and 120 h after injection for tissue collection. After tail vein administration of the drug, blood, liver and tumour tissues were collected and weighed. RIPA lysis buffer and PMSF were added, and the tissues were homogenized at 4 °C for 30 min (for about 500–900 mg tissue: 1 ml RIPA buffer containing 100 μl of 100 mM PMSF per ml of buffer). After lysis, 2 ml RIPA buffer, 2 ml methanol and 1 ml acetonitrile were added. The sample was sonicated for 10 min and centrifuged at 4,000 rpm for 10 min. A 5 ml aliquot of supernatant was evaporated using a centrifugal concentrator. The residue was reconstituted in 800 μl of water–methanol–acetonitrile (1:1:1, v/v/v) and filtered through a 0.22-μm membrane. Finally, MMAE was quantified by UPLC-MS based on mass spectrometry signal integration (Supplementary Fig. 9). The AUC for each group (6 mice) was calculated based on the payload concentrations determined by the aforementioned assays at the six indicated time points.
Cryo-EM experiment
For single-particle cryo-EM analysis, FAP protein at a concentration of 0.4 mg ml−1 was incubated with a 20-fold molar excess of enantiomerically pure FAPI-oMe-MMAE for 2 h at 4 °C. The resulting complex was then prepared for cryo-EM using graphene-oxide-coated grids. Data collection was performed, followed by single-particle data processing, which ultimately led to three-dimensional reconstruction and model building (Supplementary Tables 1 and 2 and Supplementary Fig. 22).
Surface plasmon resonance experiment
Surface plasmon resonance (SPR) experiments were performed on a Biacore 8K+ (Cytiva) using a Series S Sensor Chip SA (Cytiva, 29104992). Biotinylated PD-L1 was captured onto the chip by streptavidin–biotin interaction at a flow rate of 30 μl min−1. Analytes were then injected in a single-cycle kinetics at six consecutive increasing concentrations (5.12–500 nM, approximately 2.5-fold serial dilution). Injection parameters consisted of a constant flow rate of 30 μl min−1, 150 s association and 600 s dissociation per concentration. Before each analyte injection, a buffer blank was injected under identical conditions. The resultant binding curves were fitted to a 1:1 binding model using Biacore Evaluation Software for each dataset. Each analyte was tested in triplicate.
Reporting summary
Further information on research design is available in the Nature Portfolio Reporting Summary linked to this article.
