


Animal studies
Ethical approval for the animal studies was obtained from the Animal Ethics Committee of Dalian Medical University (AEE22109, XL250716174). All experiments were performed in compliance with institutional guidelines, using mice housed under specific-pathogen-free conditions.
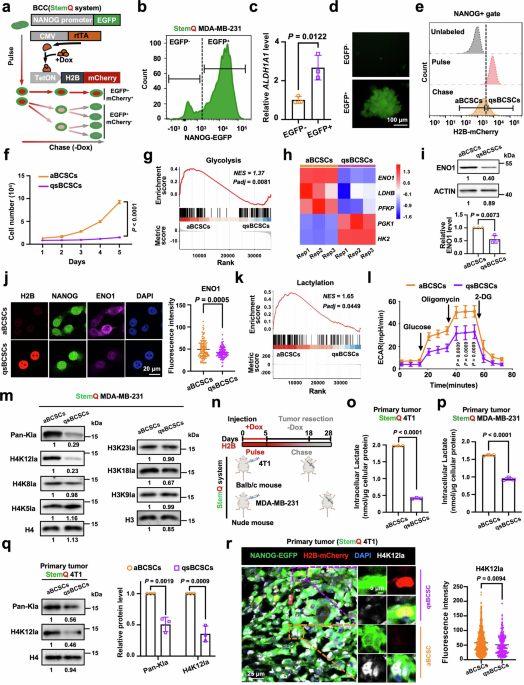
To establish orthotopic breast cancer mouse models, StemQ-engineered 4T1 (2 × 10⁵) or MDA-MB-231 cells (1 × 10⁶) were injected into the third mammary fat pads of BALB/c (6 weeks old, Changchun Changsheng Biotechnology, China, RRID: MGI:2161072) or Nude mice (6 weeks old, Changchun Changsheng Biotechnology, China, RRID: IMSR_RJ: BALB-C-NUDE). The mice received 2 g/L Dox for 5 days to induce H2B-mCherry labeling; after Dox withdrawal, the tumors were grown to 300–500 mm3 and harvested. Resected tissues were either fixed in 4% paraformaldehyde (PFA; Biosharp, BL539A) for sectioning or digested for single-cell assays.
After orthotopic injection of aBCSCs and qsBCSCs isolated from StemQ-engineered 4T1 cells, BALB/c mice received doxycycline (Dox) for 5 days to induce labeling. Dox treatment was then either continued or discontinued until tumor resection. In a parallel experiment with this model, BALB/c mice or nude mice were separately inoculated with StemQ-engineered 4T1 cells or StemQ-engineered MDA-MB-231 cells expressing shNC or shENO1, underwent the same 5-day Dox induction, and then entered a Dox-free period until resection. In a separate intervention study, mice bearing established StemQ-engineered 4T1 tumors were randomized to receive daily intraperitoneal injections of PBS, 2-deoxy-D-glucose alone (2-DG; Aladdin, Cat #D109194, 400 mg/kg), or 2-DG plus sodium L-lactate (NALA, Aladdin Cat #S108838, 500 mg/kg). Tumor volumes were monitored periodically using the formula = 0.5 × a × b2 (a and b are the long and short diameters of the tumor, respectively). At the endpoint, tumors were processed for frozen sectioning or single-cell suspension analysis.
For tumor tissue dissociation, tumors from mice were digested with 1 mg/mL collagenase I (Thermo Fisher, Cat #17100017) at 37 °C for 3.5 h with agitation. After centrifugation, the pellets were lysed using RBC lysis buffer (Solarbio, Cat #R1010) on ice for 15 min. The cell pellets were washed and resuspended in PBS for the indicated assays.
Plasmid construction
A murine Nanog reporter (pLenti-mNanog promoter-EGFP) was constructed by replacing the human promoter in the PL-SIN-NANOG promoter-EGFP backbone (Addgene, Cat #21321, RRID: Addgene_21321) with an ~2.5 kb mouse Nanog promoter fragment (Suppl. Tables1). On the basis of the pL-SIN-NANOG-EGFP and pLenti-mNanog-EGFP backbones, human and mouse EGFP and NANOG promoter plasmids were constructed by homologous recombination. For inducible label retention, the rtTA plasmid pDMS151A_Tet-On-3G (Addgene, Cat #191577, RRID: Addgene_191577) with a TRE-responsive pTRE-H2B-mCherry reporter was generated by fusing human H2B in frame to the N-terminus of mCherry in the TRE-mCherry backbone (Addgene, Cat #92202, RRID: Addgene_92202). The ENO1 rescue plasmid pcDNA6-flag-ENO1 and its dual mutant (S40A/D245R) were constructed. All the plasmid junctions and open reading frames were verified by sequencing. pLV3-CMV-NANOGNB (human)-3×FLAG-Puro (Miaolingbio, Cat #P61600), pLV3-CMV-Nanog (mouse)-3×FLAG-Puro (Miaolingbio, Cat #P75783), and pEnCMV-PCNA (human)-3×Myc-SV40-Neo (Miaolingbio, Cat #P24409) were purchased.
Cell lines
The human breast cancer cell lines MDA-MB-231 (ATCC, RRID: CVCL_0062) and HCC-1806 (ATCC, RRID: CVCL_1258) were obtained from ATCC and cultured in DMEM (GIBCO, Cat #C11995500BT) or RPMI-1640 medium (GIBCO, Cat #C11875500BT), respectively. The murine 4T1 (ATCC, RRID: CVCL_0125) breast cancer cell line was maintained in RPMI-1640. All media were supplemented with 10% fetal bovine serum (GIBCO, Cat #A5670201) and 1% penicillin‒streptomycin (Beyotime, Cat #ST488), and the cells were incubated at 37 °C in a humidified 5% CO2 atmosphere. All the cell lines were authenticated by STR profiling and tested negative for mycoplasma contamination.
StemQ-engineered breast cancer cell lines
To establish StemQ-engineered breast cancer cells, we first transduced MDA-MB-231, HCC-1806, and 4T1 cells with the pLenti-Nanog-EGFP reporter and isolated Nanog-EGFP+ populations by FACS. These sorted cells were subsequently transduced with the Tet-On-3G transactivator and pTRE-H2B-mCherry reporter, followed by selection with G418 (TargetMol, Cat #T6512, 600 μg/mL) and puromycin (Selleck, Cat #S7417, 1–2 μg/mL) to generate stable cell lines. To perform pulse-chase labeling, StemQ-engineered cells were treated with doxycycline (MeilunBio, Cat #MB1088, 2 μg/mL, 48 h) to induce nuclear H2B-mCherry, followed by a 2-day chase period without doxycycline to discriminate between qsBCSCs and aBCSCs. For the two consecutive pulse-chase cycles, StemQ-engineered cells underwent a second round of Dox-induced labeling followed by a 2-day chase period (without Dox) after completing the first cycle.
Gene interference
To generate ENO1 knockout cells, we cloned the sgRNAs into the lentiCRISPR v2 vector (Addgene, Cat #52961, RRID: Addgene_52961) and verified the constructs by sequencing. The target sequence for sgENO1 is provided in Suppl. Tables2. The pLKO.1-neo vector (Fenghui Biotec, #BR616) was digested with AgeI/EcoRI, followed by the ligation of annealed shNC or shENO1 oligonucleotides (Suppl. Tables7) into the site using T4 DNA ligase. siRNA pools (20 nM final concentration) were complexed with JETprime transfection reagent (Polyplus, Cat #PT-114-15) in buffer for 10 min at room temperature. The complexes were then added to the cells. After 6 h, the medium was replaced with fresh medium. Cells were harvested 48 h posttransfection. All the siRNA sequences used are listed in Suppl. Tables3.
Western blot
Histones from StemQ-engineered breast cancer cells were extracted using a standard acid-extraction protocol.63 All the protein lysates were centrifuged, quantified, and prepared for loading. Proteins were separated by SDS‒PAGE and transferred to nitrocellulose membranes (Millipore). The membranes were probed with primary antibodies at 4 °C overnight, followed by incubation with the following secondary antibodies at room temperature for 1 h. The following primary antibodies were used: ENO1 (Abcam, Cat #ab227978, RRID: AB_2827927), β-actin (Proteintech, Cat #66009-1-Ig, RRID: AB_2687938), Pan-Kla (PTM Biolabs, Cat #PTM-1401, RRID: AB_2868521), H4K12la (PTM Biolabs, Cat #PTM-1411RM, RRID: AB_2941896), H4 (Proteintech, Cat #16407-1-AP, RRID: AB_2118625), H3K18la (PTM Biolabs, Cat #PTM-1406, RRID: AB_2909438), H3 (Cell Signaling Technology, Cat #4499S, RRID: AB_10544537), P21 (CST, Cat #2947 T, RRID: AB_823586), P21 (PTMbio, Cat #PTM-6510), P27 (Proteintech, Cat #25614-1-AP, RRID: AB_2880161), PCNA (CST, Cat #13110S, RRID: AB_2636979), p300 (Proteintech, Cat #20695-1-AP, RRID: AB_3085614), H4K8la (PTM Biolabs, Cat #PTM-1415RM, RRID: AB_3101829), H4K5la (PTM Biolabs, Cat #PTM-1407RM, RRID: AB_3096309), H3K23la (PTM Biolabs, Cat #PTM-1413RM, RRID: AB_3101865), H3K9la (PTM Biolabs, Cat #PTM-1419RM, RRID: AB_3076695), NANOG (GeneTex, Cat #GTX100863, RRID: AB_10615506), GFP/EGFP (Santa Cruz Biotechnology, Cat #sc-9996, RRID: AB_627695), SOX2 (Santa Cruz Biotechnology, Cat #sc-365823, RRID: AB_10842165), c-Myc (Cell Signaling Technology, Cat #9402, RRID: AB_2151827), p-Rb (Cell Signaling Technology, Cat #8516, RRID: AB_11178658), Pan-Acetyl-Lysine (Beyotime, Cat #AF5632). HRP-conjugated goat anti-mouse (Thermo Scientific, Cat #31430, RRID: AB_228307) and goat anti-rabbit (Thermo Scientific, Cat #31460, RRID: AB_228341) secondary antibodies were used. Western blot images were quantified with ImageJ (v1.54p, RRID: SCR_003070).
Real-time quantitative PCR (RT‒qPCR)
Total RNA was extracted using TRIzol reagent (Takara, Cat #9109). Reverse transcription was performed using All-In-One RT MasterMix (abm, Cat #G592). RT‒qPCR was carried out using ChamQ Universal SYBR RT‒qPCR Master Mix (Vazyme, Cat #Q711-02) on a Bio-Rad CFX96 (Bio-Rad, RRID: SCR_018064) or Bioer LineGene 9600 Plus system (Bioer, China). The sequences of primers used are listed in Suppl. Tables4.
ChIP‒qPCR assay
Chromatin immunoprecipitation (ChIP) was performed using a commercial kit (Active Motif, Cat #53008 & 53032) following the manufacturer’s protocol. In brief, the cells were cross-linked with 1% formaldehyde for 10 min at room temperature, and the reaction was quenched with 125 mM glycine. After the cells were washed with PBS, the nuclei were lysed, and the chromatin was sonicated to generate 200–1000 bp fragments. Following clearance of the debris by centrifugation, 1% of the sheared chromatin was saved as input. The remainder was diluted and immunoprecipitated overnight at 4 °C with the specified antibody or normal IgG and protein G magnetic beads. The immune complexes were washed, and bound DNA was eluted. After cross-link reversal and treatment with RNase A and proteinase K, the purified DNA was analyzed by qPCR under the conditions described in the Quantitative PCR section. The sequences of primers used are listed in Suppl. Tables5.
Immunofluorescence (IF) and quantification
The cells were fixed with 4% paraformaldehyde (Biosharp, Cat #BL539A) for 15 min at room temperature and permeabilized with 0.2% Triton X-100 (MeilunBio, Cat #9002-93-1) for 20 min at 4 °C. The cells were blocked with 5% BSA (VETEC, V900933-1KG) for 1 h at room temperature. The samples were incubated overnight at 4 °C with primary antibodies diluted in blocking buffer, followed by incubation with species-appropriate Alexa Fluor 647-conjugated secondary antibodies (Biolegend, Cat #A32733TR, RRID: AB_2866492, 1:250) for 1 h at room temperature in the dark. The following primary antibodies were used: ENO1 (Abcam, Cat #ab227978, RRID: AB_2827927), H4K12la (PTM Biolabs, Cat #1411RM, RRID: AB_2941896), and PCNA (CST, Cat #13110S, RRID: AB_2636979). Images were randomly captured by confocal laser scanning microscopy (Leica TCS SP8 with a 63× objective, RRID: SCR_027226; Nikon AX with a 100× objective, RRID: SCR_026538), and image analysis was performed using ImageJ (v1.54p, RRID: SCR_003070). Whole-cell regions of interest (ROIs) for ENO1 or PCNA were created in ImageJ using a composite of EGFP, mCherry, and DAPI signals, while nuclear ROIs for H4K12la were generated via DAPI segmentation. Within these ROIs, NANOG-EGFP and H2B-mCherry mean fluorescence intensity (MFI) was measured to identify breast cancer stem-like cells (BCSCs) on the basis of NANOG-EGFP expression, and the cells were subsequently classified into aBCSC and qsBCSC subtypes using H2B-mCherry MFI. Finally, the MFIs of ENO1, PCNA and H4K12la were quantified within each BCSC subpopulation.
Fluorescence-activated cell sorting
Fluorescence-activated cell sorting (FACS) was performed on a Beckman CytoFLEX SRT sorter (Beckman, RRID: SCR_025068). For functional separation, we employed a gating strategy to isolate NANOG-EGFP- and NANOG-EGFP+ populations. From the NANOG-EGFP+ cells, the mCherry-positive and the mCherry-negative cells were sorted as EGFP+mCherry+ and EGFP+mCherry− BCSCs, respectively. These purified populations were collected for downstream assays. The data were analyzed using FlowJo (v10.6.2).
Glucose uptake, ATP, and L-lactate assays
All the assays were performed in 96-well plates and measured on a microplate reader (PerkinElmer Victor Nivo, RRID: SCR_025763; or Molecular Devices SpectraMax M2, RRID: SCR_020307). The intracellular lactate concentration was measured using cell lysates with a Lactate Colorimetric Assay Kit (Abcam, Cat #ab65331) according to the manufacturer’s instructions. Intracellular glucose was measured using cell lysates with a Glucose Colorimetric/Fluorometric Assay Kit (BioVision, Cat #K606-100) according to the manufacturer’s instructions. ATP levels were measured using an ATP Colorimetric/Fluorometric Assay Kit (Sigma‒Aldrich, Cat #MAK190) according to the manufacturer’s instructions.
Sphere formation assay
Cells were seeded in 6-well ultralow attachment plates (Corning, Cat #3471) at 5000 cells/well in sphere medium. After 10 days, the number and diameter of the spheres were determined by microscopy. Sphere medium included DMEM/F12 (Gibco, C11330500BT), 20 ng/mL basic fibroblast growth factor (PeproTech, Cat #100-18B), 20 μL/mL B27 (Thermo Fisher Scientific, Cat #17504044), and 20 ng/mL epidermal growth factor (Sigma‒Aldrich, Cat #E9644-0.5 MG). The spheres were photographed using an inverted microscope (Olympus). Spheres larger than 40 μm in diameter were counted.
Matrigel 3D culture
A total of 2000 cells were seeded in growth factor-reduced Matrigel (Corning, Cat #356231) in 24-well plates and gelled at 37 °C for 30 min. Control and ENO1-KD MDA-MB-231 or HC-1806 cells were grown in growth medium with reduced FBS content (5%). For inhibitor treatment, the cultures were treated every 48 h starting on day 0 with DMSO (Kermel), 10 μM AP-III-a4 (MCE, Cat #HY-15858), or 20 μM C646 (TargetMol, Cat #T2452). Single cells and clusters were counted after 10 days using a light microscope.
Seahorse extracellular flux assay
Seahorse XF Analyzer (Agilent Technologies XF Pro, RRID: SCR_026694) measurements were carried out following the manufacturer’s protocols (Seahorse XF Glycolysis Stress Test Kit, Agilent, Cat #103020-100). Cells were seeded into 96-well assay plates (Agilent, Cat #103793-100). The next day, the cells were washed and incubated in freshly prepared XF assay medium (Agilent, Cat #103575-100) supplemented with 2 mM glutamine solution (Agilent, Cat #103579-100). Then, glucose (10 mM), oligomycin (1 μM) and 2-DG (50 mM) were added to a Seahorse XFe96 FluxPak mini plate (Agilent, Cat #103793-100). Finally, the extracellular acidification rate (ECAR) was measured on a Seahorse XF Analyzer according to the manufacturer’s instructions. The data were analyzed with an Agilent Seahorse Wave Controller (v2.6.1, RRID: SCR_024491).
Cell proliferation assay
Cells were seeded in three replicates in 96-well plates (NEST, 701001) at 8 × 10³ cells per well and harvested daily. Harvested cells were stained with Trypan blue, and viable cells were then counted using a hemocytometer.
EdU incorporation assay
EdU incorporation was determined by flow cytometry using a BeyoClickTM EdU-647 cell proliferation assay kit (Beyotime, Cat #C0081S) following the manufacturer’s instructions.
β-Galactosidase staining
Cells were assayed for SA-β-gal staining using a commercial kit (Beyotime, Cat #C0602). After being washed with PBS, the cells were fixed for 15 min at room temperature and incubated overnight at 37 °C in a CO2-free incubator with freshly prepared X-Gal staining solution (pH 6.0). Senescent cells (blue cytoplasm) were scored by microscopy.
ENO1 enzyme activity assay
ENO1 enzymatic activity was quantified using an Enolase Activity Assay Kit (Abcam, Cat #ab117994). In accordance with the manufacturer’s instructions, the cell pellets were incubated with extraction buffer on ice for 20 min. Fifty microlitres of lysate was added to each well of the microplate and incubated for 2 h at room temperature. Afterward, the lysate was discarded, 200 μL of 1X activity solution was added to every well, and the OD value was measured at 340 nm at 1-minute intervals.
Fixable viability dye (FVD) staining
The cells were stained for viability using Fixable Viability Dye eFluor® 450 (FVD, Invitrogen, Cat #65-0863-14) prepared in PBS. After being incubated on ice for 30 min in the dark, the cells were washed twice with PBS. Finally, the cells were resuspended in phosphate-buffered saline (PBS) for flow cytometry analysis, and live cells were gated as the population negative for Fixable Viability Dye eFluor® 450.
PCR amplification and agarose gel electrophoresis
Cells were transiently transfected with the indicated plasmids and harvested 24 h posttransfection. The cell lysates were subsequently used as templates for endpoint PCR to amplify the AmpR element with the primers listed in Suppl. Tables6. The resulting PCR products were resolved by agarose (BIOWEST, BY-R0100) gel electrophoresis.
Bioinformatics analysis
Bioinformatics analyses were performed using R software (v4.3.3, RRID: SCR_001905). Differential expression analysis was conducted using the limma (v3.58.1, RRID: SCR_010943) and edgeR (v4.0.16, RRID: SCR_012802) packages. Gene set enrichment analysis (GSEA) was performed with clusterProfiler (v4.10.1, RRID: SCR_003199), and gene set variation analysis (GSVA) was carried out using the GSVA package (v1.50.5, RRID: SCR_021058). Heatmaps were generated with pheatmap (v1.0.13, RRID: SCR_016418) and ComplexHeatmap (v2.18.0, RRID: SCR_017270). Visualization was performed using ggplot2 (v3.5.2, RRID: SCR_014601) and ggpubr (v0.6.1, RRID: SCR_021139). Gene sets were obtained from the Molecular Signatures Database (MSigDB, RRID: SCR_016863) via the msigdbr package (v24.1.0, RRID: SCR_022870). Single-cell RNA-seq data were processed using Seurat (v5.3.0, RRID: SCR_016341). CUT&Tag data were aligned to the reference genome using Bowtie2 (RRID: SCR_016368). SAMtools (RRID: SCR_002105) was used for file manipulation, and peaks were called with MACS2 (RRID: SCR_013291). Downstream visualization of sequencing tracks was performed with deepTools (RRID: SCR_016366) and the Integrative Genomics Viewer (IGV, RRID: SCR_011793).
Statistical analysis
Statistical analysis was performed using R (v4.3.3) or GraphPad Prism 8. The data are presented as the mean ± SD. Statistical comparisons were performed using Student’s t test (unpaired two-tailed) or one-way ANOVA, as indicated in the Figure legends. P < 0.05 was considered statistically significant.
