


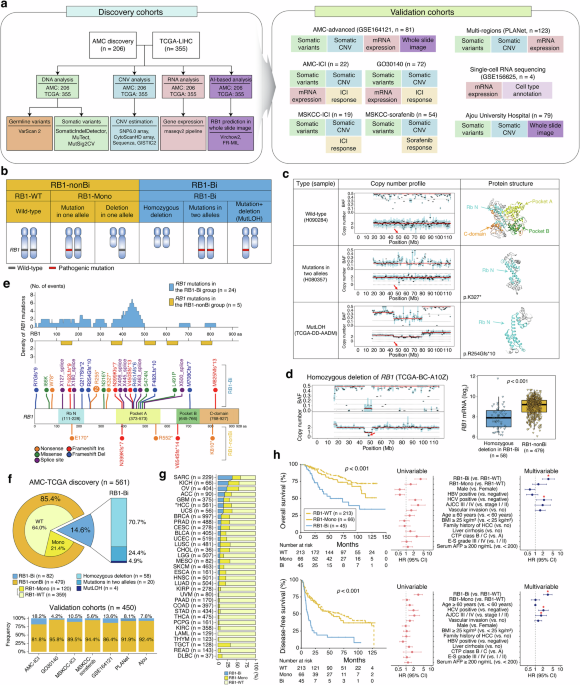
Cohort descriptions
AMC–TCGA discovery cohort: The AMC–TCGA discovery cohort comprised two independent genomic datasets: 206 patients with HCC who underwent surgical resection at Asan Medical Center (AMC discovery cohort) and 355 HCC cases from The Cancer Genome Atlas (TCGA-LIHC) (Supplementary Table 1). Genomic and transcriptomic data from the AMC cohort were generated in-house and are publicly available through cBioPortal and the Gene Expression Omnibus (GEO) under accession number GSE124751. TCGA-LIHC processed data were obtained from the Broad GDAC Firehose, and raw sequencing data were accessed through the Genomic Data Commons (GDC) Data Portal under approved project access (#Project 7043).
GSE164121 validation cohort: An independent in-house cohort of 81 patients with HCC who underwent primary hepatic resection between 2009 and 2013 at Asan Medical Center was used as a validation cohort. Over half of the patients presented with intermediate-to-advanced-stage disease (BCLC stage B/C, 55.6%), and 39.5% of tumors were of non-HBV etiology (Supplementary Table 2). Tumor tissues were obtained from surgical specimens archived in the Asan Medical Center Bio-Resource Center (http://brc.amc.seoul.kr) under IRB approval (No. 2019–1321). Targeted sequencing of key driver genes and bulk transcriptomic profiling were performed. Among these samples, one RB1-Bi tumor and one RB1-WT tumor were selected for spatial transcriptomics (ST) analysis. Normalized gene expression data from this cohort are publicly available in the GEO under accession number GSE164121.
AMC-ICI cohort: The AMC-ICI cohort consisted of in-house patients with advanced/unresectable HCC who received ICI-based therapy. Tumor tissues were obtained following written informed consent under a protocol approved by the IRB of Asan Medical Center (IRB No. 2020-0982). Clinicopathologic and outcome data were collected for response and survival analyses (Supplementary Table 2). Tumor and matched normal samples underwent whole-exome sequencing (WES), and tumor samples were subjected to bulk RNA sequencing.
MSKCC-ICI and MSKCC-sorafenib cohorts: Publicly available genomic, transcriptomic and clinical datasets from patients with unresectable HCC treated with ICI-based regimens or sorafenib were obtained from the cBioPortal for Cancer Genomics (https://www.cbioportal.org).4 These datasets were primarily used for comparative survival analyses (Supplementary Table 3).
GO30140 cohort: GO30140 is a phase Ib study evaluating the safety and preliminary efficacy of atezolizumab plus bevacizumab in patients with unresectable HCC, which laid the foundation for the phase III IMbrave150 trial (Supplementary Table 4).48 Raw sequencing data of WES and RNA-seq data from the GO30140 clinical trial were obtained from the European Genome-phenome Archive (EGA; EGAD00001008129).
PLANet multiregion cohort: To assess spatial genomic heterogeneity, we analyzed a publicly available multiregion HCC cohort.33 In this prospective study, a grid-based sampling protocol was used to collect 2-11 spatially distinct tumor regions per patient. Whole-genome sequencing (WGS) was performed on 490 tumor sections from 123 patients and 125 matched adjacent normal tissues. Data were downloaded from the respective repositories as described in the original publications.
Single-cell transcriptomic cohort (GSE156625): Single-cell RNA sequencing data from HCC tumors (GSE156625; n = 4) originally described by Sharma et al.31 was used to characterize tumor microenvironmental features at single-cell resolution.
Ajou cohort: An independent cohort from Ajou University Hospital (Suwon, Republic of Korea) included 79 patients with HCC who underwent surgical resection between 2019 and 2025. WES was performed on tumor specimens with matched normal tissue. Whole-slide images from this cohort were used as an independent external validation set to assess the performance of the FR-MIL model in predicting RB1-Bi status.
Somatic mutation profiling
The mutation annotation file (MAF) format data for the AMC and TCGA cohorts was used. We further filtered out variants that failed to satisfy the following criteria: 1) total depth ≥ 30 and allele depth > 3 for single nucleotide variants (SNVs) and 2) allele depth > 5 for small insertions and deletions (indels).49 Intronic or silent variants were also filtered out. MutSigCV2 (v.1)50 was used to identify significantly mutated genes with a cutoff false discovery rate (FDR) q < 0.1.
Profiling of germline variants
Germline variants were called with VarScan251 v.2.3.9 from whole-exome sequencing Binary Alignment Map (BAM) files for matched tumor-normal pairs. All passed variants were annotated with the Genome Aggregation Database (GnomAD; http://gnomad.broadinstitute.org),52 1000 Genomes project (1000 Genome; http://www.1000genomes.org),53 Exome Aggregation Consortium (ExAC; http://exac.broadinstitute.org),54 ClinVar (https://github.com/macarthur-lab/clinvar),55 Combined Annotation-Dependent Depletion (CADD; https://cadd.gs.washington.edu),56 and the Korean Reference Genome database (KRGDB; http://coda.nih.go.kr/coda/KRGDB).57 Variants located in intronic or synonymous regions, those with variant allele frequencies (VAFs) < 10% in nontumor samples, or variants with an estimated minor allele frequency ≥ 1% in population databases were excluded. Pathogenic germline variants were defined as those meeting at least one of the following criteria: (1) classified as pathogenic or likely pathogenic in ClinVar; (2) protein-truncating variants (including frameshift insertions/deletions, nonsense mutations, or splice-site alterations); or (3) heterozygous germline variants demonstrating loss of heterozygosity (LOH) in the tumor tissue, evidenced by increased VAF relative to matched normal samples, and predicted to be deleterious (CADD score ≥ 15).
Defining pathogenic variants of the RB1 gene
To identify pathogenic variants, we used ClinVar data (https://github.com/macarthur-lab/clinvar),58 variant types and the functional impact of variants using sorting intolerant frame tolerant (SIFT; sift.jcvi.org),59 polymorphism phenotyping (PolyPhen; genetics.bwh.harvard.edu/pph2)60 and CADD (cadd.gs.washington.edu)56. Pathogenic variants were defined according to the following criteria: (1) pathogenic or likely pathogenic variants in ClinVar; (2) protein-truncating variants such as frameshift insertions, frameshift deletions, and splice site or nonsense mutations; (3) SNVs supported by 2 or more algorithms with CADD scores ≥ 20 and deleterious effects according to SIFT and PolyPhen scores; and (4) indels with CADD ≥ 20. All benign or likely benign variants in ClinVar were discarded irrespective of their SIFT, PolyPhen, and CADD scores.49 We manually inspected all RB1 insertion and deletion variants to filter out false positives (e.g., alignment artifacts).61 Adjusted VAFs corrected for tumor purity obtained from Sequenza for RB1 mutations were calculated as follows:
$${adjusted}\,{VAF}\,({aVAF})=\,\frac{{{VAF}}_{t}-\left(1-{{Purity}}_{t}\right)* {{VAF}}_{n}}{{{Purity}}_{t}}$$
Copy number alterations, tumor cell purity, and ploidy
Segmented copy number data were inferred from CytoScan HD arrays (for the AMC discovery cohort)7 and SNP 6.0 arrays (for the TCGA-LIHC cohort from GDAC firehouse). For the 6 TCGA patients with no SNP 6.0 data (TCGA-CC-5259, TCGA-CC-A8HS, TCGA-DD-A4NE, TCGA-DD-A4NG, TCGA-G3-A5SK, and TCGA-XR-A8TC), segmented copy number data were inferred from the whole exome sequencing BAM file for matched normal-tumor pairs using Sequenza v.3.0.0.62 Significant copy number alterations and corresponding G-scores were identified using GISTIC2 with the default option (q-value < 0.25).63 Due to differences in SNP array platforms, GISTIC2 analyses were performed independently for the TCGA-LIHC and AMC discovery cohorts. RB1 GISTIC scores obtained from separate analyses demonstrated near-perfect concordance with those derived from a combined cohort analysis (R > 0.999, p < 0.001; Supplementary Fig. 2b).
Allele-specific copy number imbalances, tumor purity, and ploidy were estimated from WES data in both cohorts using the Sequenza algorithm. These WES-derived purity and ploidy estimates were subsequently used to calculate the cancer cell fraction (CCF) for each mutation. Copy number deletions were classified into two categories: (1) homozygous deletion (copy number log₂ ratio ≤ −0.8) and (2) heterozygous deletion (one-copy loss; −0.8 < copy number log₂ ratio ≤ −0.4). For assessment of clonality in HCC samples harboring RB1 copy number alterations, the CCF of each copy number alteration (CCFCNA) was calculated by adjusting allele-specific copy number changes according to tumor purity estimated by Sequenza using the following formula:
$${{CCF}}_{{CNA}}=\left(\frac{2\,\cdot \,{BAF}-1}{\left[\left({major}-1\right)-\left(\left({major}-1\right)\,\cdot \,{BAF}\right)-\left(\left({minor}-1\right)\,\cdot \,{BAF}\right)\right]}\right)\,\cdot \,\frac{1}{p}$$
where BAF represents the B-allele frequency, major and minor denote allele-specific copy numbers, and p indicates tumor purity. RB1 copy number alterations were considered clonal when CCFCNA ≥ 0.7.
Microsatellite instability analysis
MSI status was evaluated using MSIsensor-pro (v1.2.0)64 based on paired tumor–normal sequencing data. The MSIsensor score, representing the percentage of unstable microsatellite sites, was used to define MSI categories: samples with a score below 3.5 were classified as microsatellite stable, and those with a score of 10 or greater were defined as microsatellite instability-high (MSI-H).
Evolutionary timing analysis
The relative evolutionary timing of candidate driver mutations was inferred using MutationTimeR v1.00.2 (https://github.com/gerstung-lab/MutationTimeR).65 The temporal ordering of somatic mutations relative to clonal and subclonal copy number states, as well as the timing of copy number gains, was determined. The analysis was performed with 200 bootstrap iterations. Mutations were classified into the following categories based on copy number context and CCF: “Clonal [early]” – mutations on ≥ 2 copies per cell; “Clonal [late]” – mutations on 1 copy per cell with no retained allele; “Clonal [NA]” – mutations on 1 copy per cell, either on an amplified or retained allele; and “Subclonal” – mutations on <1 copy per cell.
To further investigate tumor evolutionary trajectories, we used PhylogicNDT (https://github.com/broadinstitute/PhylogicNDT).65 CCF was estimated using somatic single-nucleotide mutation (SSM) VAFs, reformatted copy number data from ASCAT (https://github.com/getzlab/ASCAT-parser.git), and tumor purity inferred via the cluster function. Mutations were clustered based on similar CCFs to reconstruct subclonal architecture. Tumor phylogenies and mutation timings were inferred using the SinglePatientTiming and LeagueModel modules within PhylogicNDT. Additionally, Palimpsest was used to visualize the molecular timing of evolutionary changes using whole-genome sequencing (WGS) data from representative cases.66
Gene expression profiling and pathway analysis
The AMC-TCGA discovery cohort, GSE164121 cohort, and AMC-ICI cohort were processed and normalized using the TCGA rnaseqv2 pipeline with upper quartile normalization. GSEA67 and gene set variation analysis (GSVA)68 were performed to identify enriched molecular pathways using the Hallmark and Reactome gene set collections in the Molecular Signatures Database (MSigDB, version 7.2)69 and WIKI pathway.70 GSVA analysis was performed using the nine gene sets in DNA damage response (DDR) pathways, including BER (base excision repair), MMR (mismatch excision repair), NER (nucleotide excision repair), HR (homologous recombination), FA (Fanconi anemia), and NHEJ (nonhomologous end joining), downloaded from a human DNA repair gene database (https://www.mdanderson.org/ documents/Labs/Wood-Laboratory/human-dna-repair-genes.html#DNA_pol). For the ST dataset, GSEA was performed using the fgsea R package (v1.20.0)71. In addition, pathway analysis to identify downstream target molecules for RB1 upstream regulators was performed using Ingenuity Pathways Analysis (IPA) software (QIAGEN, Redwood City, CA; www.qiagen.com/ingenuity) with the Ingenuity Knowledge Base.
Profiling of tumor-infiltrating immune cells
Immune cell infiltration was computationally inferred from bulk RNA-sequencing data using five established deconvolution tools: MCP-counter, xCell, quanTIseq, EPIC, and BayesPrism. Infiltrating immune cells were profiled using CIBERSORT absolute mode with LM22 (22 immune cell types) gene signatures from the normalized gene expression data for 561 HCCs.72,73 The total immune score was defined as the sum of the estimated immune scores for each cell type. MCP-counter74 quantifies the absolute abundance of immune and stromal cell populations using transcriptomic markers specific to each cell type. xCell75 estimates enrichment scores for immune and stromal compartments based on gene signature sets. quanTIseq76 infers tumor-infiltrating immune cell fractions from RNA-seq profiles using a predefined immune signature matrix. EPIC77 estimates the cellular composition of tumor and nontumor compartments by modeling bulk transcriptomic profiles. BayesPrism78 performs Bayesian deconvolution to jointly estimate cell-type fractions and cell-type-specific expression from bulk RNA-seq data using single-cell RNA-seq.
Immunohistochemistry (IHC)
Tumor tissues from the AMC discovery cohort and the GSE164121 cohort were subjected to immunohistochemical analysis. Formalin-fixed, paraffin-embedded (FFPE) tissue sections were stained for CD8 using a mouse monoclonal antibody (clone C8/144B; 1:400 dilution; catalog No. NCL-L-CD8-4B11; Novocastra/Leica Biosystems, CA, USA). Immunostaining was performed on a BenchMark XT automated immunostaining platform (Ventana Medical Systems, Tucson, AZ, USA) using the OptiView DAB IHC Detection Kit, according to the manufacturer’s instructions.
Quantification of CD8-positive cells
The quantification of CD8-positive cells was performed using ImageJ (v1.54),79 following a previously described protocol (Current Protocols). Briefly, representative tumor regions were selected from whole-slide images, and DAB-positive signals corresponding to CD8 staining were extracted. Images were processed by conversion to 8-bit grayscale and thresholded to distinguish positive staining from the background. Automated particle analysis was then applied to count CD8-positive cells, and the counts were normalized to the total number of cells or analyzed tissue area, as indicated.
Mutational signatures
DeconstructSigs evaluates the contribution of mutational signatures reported in the Catalog of Somatic Mutations in Cancers (COSMIC, version 2) (https://cancer.sanger.ac.uk/cosmic/signatures) to the mutational profile of each sample.80 Mutational signatures were calculated considering all somatic mutations in a given sample. The signature scores obtained were then analyzed in association with each group using the Wilcoxon rank-sum test.
Targeted next-generation sequencing
Targeted next-generation sequencing (NGS) was performed using the NextSeq platform (Illumina, San Diego, CA, USA) with a custom-designed hybrid capture panel (AMC_HBV_8custom_sequence_PI). Capture probes were designed by Celemics Inc. (Seoul, Republic of Korea) using the SureDesign platform based on the GRCh37 reference genome. Target enrichment was carried out using the Celemics Target Enrichment Kit (Celemics Inc.). The custom panel covered approximately 0.25 Mbp and consisted of 898 probes targeting a total of 33 genes, including the entire coding exons of the selected genes. For library preparation, 100 ng of FFPE-derived genomic DNA was fragmented by sonication to a mean size of approximately 200 bp, followed by size selection and purification using CeleMag™ Clean-up Beads (Celemics Inc.). Library quality and fragment size distribution were assessed using the Agilent TapeStation system (Agilent Technologies, Santa Clara, CA, USA). DNA libraries were prepared through sequential end repair, A-tailing, and ligation of Illumina-compatible adapters using the Celemics Library Preparation Kit. Indexed libraries were pooled to a total input of 1000 ng for hybrid capture using the AMC_HBV_8custom_sequence_PI custom panel. Captured target libraries were enriched using streptavidin-coated magnetic beads, quantified by quantitative PCR, and sequenced on the NextSeq platform (Illumina Inc.) using paired-end sequencing.
Sequenced reads were aligned to the human genome reference (GRCh37/Hg19) using BWA-MEM (v0.7.18)81 with default parameters. The aligned reads were processed with the GATK package (v4.5.0.0)82. Raw alignments were sorted using SortSam, and then duplicate reads were marked using MarkDuplicates. Base quality scores were recalibrated using BaseRecalibrator and ApplyBQSR. Somatic single-nucleotide variants (SNVs) and short insertions or deletions (indels) were identified using Mutect2 with matched normal samples. Putative somatic mutations were annotated using Variant Effect Predictor (v110.1)83 and converted to MAF format using vcf2maf (v1.6.21)84. Somatic copy numbers were estimated using CNVkit (v0.9.12)85 with pooled normal references constructed from all available normal samples.
Public single-cell RNA sequencing data
Public single-cell RNA (scRNA) sequencing data from HCC samples were sourced from the GEO database (GSE156625)31. The normalized gene expression matrix and predefined cell types and clusters were downloaded. Preprocessing of single-cell proteomics data was performed using the Seurat (v4.4.0) R package.86 The matrix was scaled by the ScaleData function. To address batch effects among the four samples, the R package Harmony (v1.2.3) was used.87 Dimensionality reduction was achieved through principal component analysis (PCA), with the top 30 principal components applied to harmony with default parameters. The top 30 resulting harmony factors were then used for downstream uniform manifold approximation and projection (UMAP) reduction. To define the RB1 status, hepatocytes from each sample were extracted and aggregated into pseudobulk cells. The mean RB1 expression of hepatocytes was calculated per sample. Based on this average expression, samples were divided into two groups: RB1-Low (n = 2) and RB1-High (n = 2). The RB1-Low group was used as a surrogate for RB1-Bi, as it partially mimics the biological features of RB1-Bi tumors that showed markedly reduced RB1 expression in bulk data.
Spatial transcriptomic profiling (10x Genomics Visium)
For spatial transcriptomics analyses, we selected two FFPE tissues containing HCC. Selection of the 6.5 mm × 6.5 mm capture areas in hematoxylin and eosin (H&E)-stained slides for spatial transcriptomics was based on the consensus of a pathologist (COS). Tissue sections meeting quality control standards (DV 200 ≥ 30%) underwent spatial transcriptomics using the Visium CytAssist Spatial Gene Expression for FFPE platform from 10x Genomics Inc. The initial steps included deparaffinization, H&E staining, imaging, and subsequent decrosslinking. Subsequent decrosslinking, tissue permeabilization, probe hybridization, and library preparation were performed meticulously according to the manufacturer’s protocol. Sample libraries were sequenced on an Illumina NovaSeq 6000 platform using specified read lengths as recommended by the manufacturer.
Preprocessing of spatial transcriptomics data
Sequences and histology images were processed using 10x Genomics Space Ranger v2.0.1. Illumina basecall files generated by the sequencing instrument were converted to FASTQ format for each sample using the mkfastq command. Visium spatial expression libraries were analyzed with the count command. Image processing proceeded in two stages: first, the fiducial alignment grid of the tissue image was used to determine the orientation and position of the input image; then, the region of the tissue covered on the slide was identified. Sequencing reads were aligned to the Visium Human Transcriptome Probe Set v2.0 GRCh38-2020-A reference using the STAR (v2.7.2a)88 aligner.
Processing and visualization of spatial transcriptomics data
Data processing and visualization were executed using the Seurat (v4.4.0)86 R package. Initially, we filtered and normalized the data for each sample as follows: genes were removed if they were present in fewer than three spots, and only genes observed in all sequenced data were used for downstream analysis. All spots containing fewer than 100 UMI counts were also removed. After quality control and spot filtering, ST samples were normalized using the NormalizeData function in the Seurat package with default parameters as described in the vignette. A total of 2500 variable genes were identified using the FindVariableFeatures function. Next, these normalized objects were integrated using the anchor-based integration method to adjust the batch effect across the Visium slides. The integrated object was scaled using the ScaleData function, and principal components were calculated using the RunPCA function. The top 30 principal components with resolutions of 0.25 were used to identify spatial clusters by running Seurat’s ST pipeline.
Cell type decomposition
For the ST data, we used a public scRNA-seq dataset as a reference89 to obtain the distribution of cells in the spatial regions. To map the cell types found in the reference dataset to the spatial data, we performed robust cell type decomposition (RCTD) using the spacexr R package (v2.2.1)90, with parameter doublet_mode = “full”.
WES analysis of the validation cohort
Sequenced reads were aligned to the human genome reference (GRCh37/Hg19) using BWA-MEM (v0.7.18)81 with default parameters. The aligned reads were processed with the GATK package (v3.7.0)82. Raw alignments were sorted using SortSam, and then duplicate reads were marked using MarkDuplicates. Base quality scores were recalibrated using BaseRecalibrator and ApplyBQSR. Somatic SNVs and short insertions or deletions (indels) were identified using Mutect2 with matched normal samples. Putative somatic mutations were annotated using Variant Effect Predictor (v110.1)83 and converted to MAF format using vcf2maf (v1.6.21)84. Somatic copy numbers were estimated using CNVkit (v0.9.12)85 with matched normal samples. Copy number deletions were classified into 2 categories: 1) homozygous deletion (copy number log2 ratio ≤ −0.65) and 2) heterozygous deletion (one copy loss; −0.65 < copy number log2 ratio ≤ −0.25). Pathogenic RB1 mutations were defined as described above in Defining pathogenic variants of the RB1 gene.
RB1
status definition using public multiregion WGS data
Publicly available processed multiregion WGS data from a previously published PLANet study33 were used for this study. Details of the original WGS data processing performed in the original study, including read alignment, variant calling, and copy number analysis, were described previously. For copy number analysis, thresholded GISTIC2 data provided by the original study were used directly. RB1 copy number alteration was classified as homozygous deletion (−2) or heterozygous deletion (−1) based on the GISTIC2 output. Somatic mutation annotations were obtained from the processed dataset, and only pathogenic RB1 mutations were considered. Initially, the RB1 status was determined at the regional level and categorized as RB1-Bi, RB1-Mono, or RB1-WT based on integrated copy number and mutation data. Patients were classified as RB1-Bi if at least one tumor region demonstrated RB1-Bi. Patients without RB1-Bi region but with monoallelic alteration were classified as RB1-Mono, and patients without RB1 alteration were classified as RB1-WT.
Whole slide image (WSI) preprocessing
Segmentation and patching
In our pipeline, we first automatically segment tissue regions for each digitized slide at a downscaled resolution (×32) in the HSV color space to obtain a binary tissue mask. This is achieved by thresholding the saturation channel after blurring and applying morphological operations to remove artifacts such as ink markings and holes. Following tissue segmentation, we densely cropped nonoverlapping 256 × 256 pixel patches from the segmented tissue areas at 20× magnification (0.5 microns per pixel). The number of patches extracted varies per slide, ranging from hundreds to hundreds of thousands depending on the tissue area and scan magnification. We retained only patches containing > 15% tissue content to ensure comprehensive tissue coverage and exclude background regions.
Feature extraction
After segmentation and patching, we first applied stain normalization to mitigate color variability arising from differences in tissue preparation and staining protocols across slides. Following stain normalization, we employ Virchow291 to extract feature representations from each image patch. Virchow2 is a Vision Transformer (ViT-H)-based pathology foundation model pretrained on over 3 million whole slide images using DINOv292 self-supervised learning, which enables it to learn robust and generalizable histopathological representations without requiring manual annotations. We extract features from the penultimate layer of Virchow2, converting each 256 × 256 patch into a 2560-dimensional feature vector. This approach drastically reduces processing costs and enables faster training compared to online patch processing. Additionally, using these pre-extracted features allows all slide patches to fit simultaneously in memory on a single consumer-grade GPU, further improving computational efficiency.
Cohort splits
In this study, we utilized the TCGA-LIHC dataset, which comprises a multi-ethnic population (Supplementary Fig. 11), for model development and three independent datasets for external validation. After filtering out unusable slides with severe artifacts, the TCGA-LIHC dataset consisted of 347 patient cases with 628 diagnostic slides. To ensure robust model generalization to new patients, we implemented strict patient-level stratification where all slides from a given patient were assigned exclusively to one subset. This approach prevents data leakage that could occur with slide-level splitting and provides a more realistic estimate of clinical performance. The dataset was split into training (50%, 173 patients with 307 slides), test (40%, 139 patients with 259 slides), and validation (10%, 35 patients with 62 slides) subsets (Supplementary Table 13). The inherent class imbalance (RB1-nonBi to RB1-Bi ratio of approximately 4.5 to 1) reflects clinical prevalence alterations in HCC and was maintained across all splits. During training, we employed balanced mini-batch sampling to ensure equal representation of both classes, preventing the model from defaulting to majority-class predictions. For external validation, we used the AMC discovery dataset of 206 slides with 206 patients and the GSE164121 cohort of 80 slides with 80 patients after exclusion of one unreadable case, along with the Ajou dataset of 79 slides with 79 patients from Ajou University Hospital (Suwon, Republic of Korea), to assess model generalizability across diverse and representative data samples.
Model framework
To solve whole slide image analysis tasks with only slide-level labels, we employ a weakly supervised learning approach based on multiple instance learning (MIL).93,94,95,96 The method treats each WSI as a bag containing numerous patches (instances), ranging from hundreds to hundreds of thousands per slide, eliminating the need for detailed patch-level annotations. Our FR-MIL method introduces a novel feature recalibration mechanism that dynamically adjusts patch-level feature statistics across different WSIs.93 The approach integrates transformer-based modules for spatial and morphological modeling with a top-k instance classifier that identifies the most relevant patches. Feature recalibration modules then enhance discriminative power by learning to normalize and adjust features based on these top-k scoring instances per slide. This recalibration process improves slide-level classification performance by producing more robust and consistent feature representations. Our approach enhances feature separability between different WSI bags through recalibration guided by a feature distance-based learning objective. Unlike prior works97,98,99 that rely on standard aggregation functions such as max, mean, and log-sum pooling, our method provides adaptive feature adjustment capabilities and greater flexibility for data-specific optimization.
Model selection
To assess model robustness and select the optimal configuration, we repeated the training and validation procedure three times using different model initializations on patient-stratified cohort divisions, ensuring no patient overlap among splits. Each model was trained for a minimum of 100 epochs with a learning rate of 0.00001 and a batch size of 1 (single slide). The framework optimizes two loss functions: a metric loss to minimize intraslide feature representation distances and a binary cross-entropy loss using diagnostic labels. To prevent bias toward the majority class, we employed balanced sampling to ensure equal representation of slide features across both classes. The model achieving the lowest average validation loss across the three repetitions was selected as the final diagnostic model.
Cell culture, reagents, and antibodies
Human HCC cell lines, including Huh7, PLC/PRF/5, and HepG2, were purchased from the Korean Cell Line Bank (KCLB; Seoul, Republic of Korea) and cultured in RPMI-1640 medium (Welgene, Seoul, Republic of Korea) supplemented with 10% FBS (Thermo Fisher Scientific, Waltham, MA, USA), 1% sodium pyruvate (Thermo Fisher Scientific), and 1% penicillin/streptomycin (Thermo Fisher Scientific) at 37 °C with 5% CO₂. All cell lines were authenticated by short tandem repeat (STR) profiling using an AmpFLSTR Identifiler kit (Applied Biosystems, Foster City, CA, USA). Before use, all cells were screened for the presence of mycoplasma by PCR using a mycoplasma detection kit (Myco-Read™, BioMAX).
The following chemical reagents were used in this study: talazoparib (BMN-673) tosylate (DC8453), SB-715992 (ispinesib) (DC5107), volasertib (BI6727) (DC7187), and MLN8237 (alisertib) (DC2016), which were purchased from DC Chemicals (Shanghai, China). Thymidine (sc-296542) was obtained from Santa Cruz Biotechnology, and Hoechst 33342 (H3570) was acquired from Thermo Fisher Scientific. All primary and secondary antibodies employed in this study are detailed in Supplementary Table 15.
Establishment of
RB1
-knockout cell lines by CRISPR/Cas9
To generate stable RB1-knockout (RB1−/−) cells, all-in-one CRISPR plasmids with an mCherry reporter were purchased from GeneCopoeia (#HCP216131-CG01). Cells were transfected with CRISPR plasmids, selected with puromycin, and sorted for mCherry positivity by single-cell clone isolation. Knockout clones were confirmed by PCR amplification of genomic DNA and sequencing using the following primers: forward, 5’-GTTTTTCTCAGGGGACGTTG-3’; reverse, 5’-GTCAAGTTGAAGCCGAGACC-3’. The RB1 and control gRNA sequences used were 5’-CGGAGGACCTGCCTCTCGTC-3’ and 5’-GGCTTCGCGCCGTAGTCTTA-3’, respectively.
Western blot analysis
Whole cells were harvested and lysed with RIPA buffer (Cell Signaling Technology, Danvers, MA, USA) containing phosphatase (Sigma-Aldrich, St. Louis, MO, USA) and protease inhibitors (GenDEPOT, Barker, TX, USA). The protein concentration in the cell lysates was determined using the bicinchoninic acid (BCA) method (Thermo Fisher Scientific). Laemmli sample buffer (Bio-Rad, Hercules, CA, USA) was added to the samples, which were then heated at 95 °C for 10 min to denature the proteins. Protein samples (20–30 µg per lane) were separated by SDS‒PAGE (sodium dodecyl sulfate‒polyacrylamide gel electrophoresis) on 10% or 15% gels, depending on the molecular weight of the target proteins. Following electrophoresis, proteins were transferred onto polyvinylidene fluoride (PVDF) membranes using a wet transfer system. The membranes were blocked with 5% nonfat dried milk in PBST (phosphate-buffered saline with 0.1% Tween-20) for 1 h at room temperature to prevent nonspecific binding. Subsequently, the membranes were incubated with primary antibodies diluted in PBST at 4 °C overnight. The membranes were then washed three times with PBST (10 min per wash) to remove unbound antibodies. Next, the membranes were incubated with horseradish peroxidase (HRP)-conjugated secondary antibodies (1:2000 dilution in PBST) for 1 h at room temperature, followed by three additional washes with PBST (10 min per wash). Protein bands were visualized using enhanced chemiluminescence (ECL) substrate (Thermo Fisher Scientific) and detected with a ChemiDoc MP imaging system (Bio-Rad). Image acquisition and analysis were performed using Image Lab software (versions 5.1 and 5.2.1, Bio-Rad). Protein expression levels were normalized to the loading control GAPDH to ensure equal protein loading across samples.
Drug library screening
To identify therapeutic vulnerabilities associated with RB1-Bi HCC, we performed comprehensive drug screening using isogenic RB1 wild-type (RB1+/+) and knockout (RB1−/−) Huh7 cell lines generated via CRISPR/Cas9 genome editing. The cells were systematically screened against three annotated compound libraries purchased from Selleck Chemicals (Houston, TX, USA): the Epigenetics Compound Library (L1900, 128 compounds), the Highly Selective Inhibitor Library (L3500, 318 compounds), and the Kinase Inhibitor Library (L1200, 430 compounds). Huh7 RB1+/+ and Huh7 RB1−/− cells (400 cells/well) were seeded in parallel in 384-well plates (Corning, #3656) and screened using an eight-dose, interplate titration format with a Liquidator-96 multiwell pipettor (Mettler Toledo, Columbus, OH). After 5 days of incubation, cell viability was assessed using AlamarBlue (Thermo Fisher Scientific). Half-maximal inhibitory concentration (IC50) values were calculated using GraphPad Prism 6.0 (GraphPad Software, La Jolla, CA). Synthetic lethality hits selective for Huh7 RB1−/− cells were identified by calculating the selectivity index (SI) as follows: SI = IC50 (Huh7 RB1+/+)/IC50 (Huh7 RB1−/−). Compounds with a selectivity index (fold IC50 difference between RB1+/+ and RB1−/−) greater than 2 were considered potential synthetic lethal candidates and selected for further validation.
Cell viability assay
AlamarBlue reagent was prepared by dissolving 0.025% (w/v) resazurin sodium salt (Sigma‒Aldrich) in sterile PBS. The solution was filtered through a 0.22 µm filter and stored in a light-protected container at 4 °C. For the assay, AlamarBlue® reagent was added directly to the cell culture medium at a volume ratio of 1:10 (v/v) and incubated at 37 °C for 4 h until significant color changes were observed. Fluorescence was measured using a SpectraMax-M5 multiwell plate reader (Molecular Devices, Sunnyvale, CA, USA) at excitation/emission wavelengths of 560/590 nm. Percentage growth was determined relative to untreated controls. Each experiment was performed at least three times, each with triplicate samples.
Cell cycle assays
Cells cultured in six-well plates were synchronized at the G1/S boundary using the double thymidine block method, as described by Chen et al.100 Briefly, cells were cultured in standard growth medium until they reached approximately 30% confluence. For the first block, cells were incubated in medium containing 2 mM thymidine for 18 h, followed by washing twice with PBS. To release the cells from arrest, they were incubated in thymidine-free medium for 9 h. For the second block, cells were reincubated in medium containing 2 mM thymidine for 18 h, followed by washing twice with PBS. Finally, the synchronized cells were released into thymidine-free medium and collected at the indicated time points for cell cycle analysis.
For cell cycle analysis, cells were harvested, gently washed with cold PBS containing 2% FBS, and fixed in 70% cold ethanol overnight at −20 °C. They were then pelleted, washed, and resuspended in PBS containing 50 μg/mL propidium iodide (Sigma‒Aldrich) and 0.1 mg/mL RNase A, followed by incubation at room temperature for 30 min in the dark. Flow cytometric analysis was performed using a CytoFLEX flow cytometer (Beckman Coulter, Inc., Brea, CA, USA), and data were analyzed using FlowJo software (v10.8.1).
RB1
overexpression and rescue study
RB1 overexpression and rescue experiments were performed via lentiviral transduction. Briefly, 293T cells were seeded in 6-well plates at ~50% confluence one day prior to transfection. Lentiviral particles were generated by cotransfecting 293T cells with the following plasmids using Lipofectamine 3000 (Thermo Fisher Scientific): (i) pML-CDH-CMV-RB1(human)-EF1a-CopGFP-T2A-Puro-WPRE (RB1 overexpression construct) or pCDH-CMV-MCS-EF1-CopGFP-T2A-Puro (empty vector control); (ii) packaging plasmid pCMV-dR8.2 dvpr; and (iii) envelope plasmid pCMV-VSV-G. The plasmid ratio was maintained at 3:2:1 (transfer vector: packaging plasmid: envelope plasmid). After 48 h, viral supernatants were collected, clarified by 0.45 μm filtration, and subsequently used to transduce target cells. Transduced cells were selected with puromycin, and GFP expression was monitored to confirm transduction efficiency. RB1 overexpression was validated by Western blotting, after which drug sensitivity assays were conducted to assess cell viability.
Measurement of cell viability by ATP-based luminescence assay
Cell viability was assessed using the CellTiter-Glo Luminescence Assay (Promega, USA) according to the manufacturer’s instructions. Following treatment with lenvatinib or immune checkpoint inhibitors (atezolizumab, durvalumab, or pembrolizumab), cells seeded in 96-well plates were cultured for 2 or 3 days. Subsequently, an equal volume of CellTiter-Glo reagent was added to each well. The plates were shaken for 2 min to induce cell lysis and then incubated for 10 min at room temperature in the dark to stabilize the luminescent signal. Luminescence was measured using a Victor multilabel plate reader (PerkinElmer, USA).
PD-L1 expression by flow cytometry
To assess the cell surface expression of PD-L1, MDA-MB-231 and Huh7 cells were harvested using Accutase (Thermo Fisher Scientific) to preserve surface epitopes. Cells were washed with PBS and incubated with PE-conjugated monoclonal anti-PD-L1 (557924, BD Pharmingen, USA) or the corresponding PE-conjugated isotype control (555749, BD Pharmingen) for 30 minutes on ice. After washing twice with PBS, the cells were analyzed using a BD FACSCanto II flow cytometer (BD Biosciences, USA). Flow cytometry histograms were analyzed by FlowJo software, and the mean fluorescence intensity (MFI) was calculated from gated single-cell populations. Experiments were performed in triplicate.
Isolation of peripheral blood mononuclear cells (PBMCs)
Whole blood from patients with HCC was collected at Asan Medical Center under approval of the Institutional Review Board (IRB) of Asan Medical Center (IRB No. 2020-0982). PBMCs were isolated by density gradient centrifugation using Ficoll-Paque Premium (Cytiva, Sweden). Briefly, fresh blood was diluted 1:1 with PBS and layered onto Ficoll-Paque Premium at a 3:4 (v/v) Ficoll-to-diluted blood ratio. Samples were centrifuged at 400 × g for 30 min with the brake off. The mononuclear cell layer at the plasma-Ficoll interface was collected, washed with PBS, and resuspended in complete RPMI-1640 medium. PBMCs were stimulated prior to use.
Evaluation of immune cell-mediated tumor cell killing using PBMC coculture assays
PBMCs were activated with 1 μg/mL anti-CD3 (555329, BD Pharmingen) and 1 μg/mL anti-CD28 (555725, BD Pharmingen) antibodies in the presence of IL-2 (10 ng/mL; PeproTech, USA). After activation, PBMCs were collected, counted, and used as effector cells. Target tumor cells, including the positive control cell line MDA-MB-231, were seeded in microplates and allowed to adhere overnight. Activated PBMCs were added to tumor cells at an effector-to-target (E:T) ratio of 8:1 in the presence of vehicle or immune checkpoint inhibitors and cocultured. After 48 h, nonadherent PBMCs were gently removed by washing the wells twice with complete RPMI-1640 medium to ensure that only adherent tumor cells remained. Tumor cell viability was assessed using a CellTiter-Glo (CTG) luminescence assay according to the manufacturer’s instructions, and luminescence was measured using a plate reader.
Immunofluorescence analysis
Cells were seeded in 48-well plates (for p-histone H3 and γ-H2AX staining) or Nunc Lab-Tek II 8-Chamber Slides (Thermo Fisher Scientific) (for microtubule and spindle staining) and treated with synthetic lethal (SL) drugs as described in the figure legends. Following treatment, they were fixed with 4% paraformaldehyde in PBS at 37 °C for 30 min. The cells were permeabilized and blocked simultaneously with a solution containing 3% bovine serum albumin (BSA) and 0.1% Triton X-100 in PBS for 30 min at room temperature. They were then incubated with primary antibodies (as listed in Supplementary Table 15) diluted in 3% BSA in PBST at 4 °C overnight. Following primary antibody incubation, the cells were washed three times with PBST (5 min per wash) and incubated with Alexa Fluor-488-conjugated secondary antibodies (as listed in Supplementary Table 15) in 3% BSA in PBST at room temperature for 1 h. They were washed three times again with PBST (5 min per wash). For p-histone H3 and γ-H2AX staining, the cells were incubated with 1 μg/mL Hoechst 33342 at room temperature for 5 min and then washed three times with PBST (5 min per wash). They were imaged using an ImageXpress Confocal HT.ai High-Content Imaging System (Molecular Devices), and MetaXpress software was used to acquire and analyze images. The mitotic index was quantified as the percentage of phospho-histone H3 (Ser10)-positive cells relative to the total number of Hoechst 33342-stained cells. Similarly, γ-H2AX-positive cells were quantified as the percentage of phospho-histone H2AX (Ser139)-positive cells relative to the total number of Hoechst 33342-stained cells.
For microtubule and spindle staining, cells were mounted with Fluoromount-G Mounting Medium containing DAPI (Thermo Fisher Scientific) and imaged using a Carl Zeiss LSM 880 confocal microscope equipped with a 63× oil-immersion objective. ZEN 2.3 (black version) software was used to acquire and analyze confocal images. Abnormal spindles were defined as those that did not display normal bipolar spindle formation, as seen by the absence of a clearly visible metaphase plate or disrupted radial arrays of microtubules emanating from opposite poles. For each experiment, a total of 100 mitotic Huh7 RB1−/− cells from each treatment condition were analyzed.
DNA repair reporter assay
The DNA DSB repair assay was performed as previously described.101 Briefly, cells were seeded in six-well plates at approximately 50% confluence one day prior to transfection. Cotransfection was carried out using Lipofectamine 3000 (Thermo Fisher Scientific) with 1 μg of each of the following plasmids: pLCN-DSB Repair Reporter (DDR; Addgene #98895), pCAGGS DRR mCherry Donor EF1a BFP (Addgene #98896), and pCBASceI (Addgene #26477). After 72 h, cells were harvested and analyzed for GFP and mCherry expression using a CytoFLEX flow cytometer (Beckman Coulter, Brea, CA). Flow cytometry data were processed and quantified with FlowJo software (version 10.8.1). Control transfections included pLCN-DSB Repair Reporter and pCAGGS DRR mCherry Donor EF1a BFP without pCBASceI.
Comet assay
Cells cultured in 48-well plates were treated with alisertib, ispinesib, talazoparib, or volasertib for 48 h. Lysis buffer (2.5 M NaCl, 100 mM EDTA, 10 mM Tris, and 1% Triton X-100, pH 10) and electrophoresis buffer (300 mM NaOH, 1 mM EDTA, pH 10) were freshly prepared and chilled at 4 °C for at least 60 min before use. Low melting point agarose (1%) was melted in a microwave and maintained at 37 °C in a water bath. Microscope slides were precoated with 1.5% normal melting point agarose and allowed to solidify. Cells were trypsinized and resuspended at a density of approximately 1 × 10⁵ cells/mL in 100 μL of 0.5% low melting point agarose at 37 °C. The cell-agarose mixture was immediately pipetted onto precoated slides and covered with a coverslip. The slides were placed at 4 °C for 10 minutes to allow the agarose layer to solidify. After gently removing the coverslip, the slides were immersed in lysis buffer and incubated in the dark at 4 °C for at least 1 hour. Following lysis, the slides were transferred to an electrophoresis tank and equilibrated with precooled electrophoresis buffer for 20 min. Electrophoresis was performed at 300 mA (approximately 25 V) for 30 min on ice. After electrophoresis, the slides were neutralized with 0.4 M Tris-HCl (pH 7.5) three times (5 min each) and air-dried at room temperature. The samples were then stained with 10 μg/mL propidium iodide (PI) for 10 min. Images were acquired using an EVOS fluorescence microscope (Thermo Fisher Scientific). DNA damage was quantified by measuring the percentage of DNA in the tail using ImageJ software with the OpenComet plugin.
Drug combination test
Cells were seeded in 96-well plates at a density of 2000 cells per well and treated with alisertib, ispinesib, talazoparib, or volasertib, either alone or in combination, for 4 days. Drug combinations were tested using a constant ratio design based on the IC50 values of individual compounds. Cell viability was measured using the AlamarBlue assay as previously described. The combination index (CI) values were calculated using the Chou-Talalay method with CompuSyn software (ComboSyn, Inc.). A CI value < 1.0 indicates synergism, CI = 1.0 indicates additive effects, and CI > 1.0 indicates antagonism, with values closer to 0 representing stronger synergism. To analyze synergy with nonfixed concentration ratios, we employed SynergyFinder.102 Huh7 RB1−/− cells were seeded in 96-well plates and treated with serial dilutions of drug combinations at varying concentration ratios for 72 h. The resulting dose‒response matrices were analyzed using the SynergyFinder web application (https://synergyfinder.aittokallio.group/synfin_docs/) under the HSA model to generate 2D synergy maps and calculate synergy scores.
Tumor xenograft mouse models
All animal procedures were conducted in strict compliance with the guidelines approved by the Animal Research Ethics Committee of the University of Macau (Approval number: UMARE-0153-2024). Four- to six-week-old female athymic nude mice (The Jackson Laboratory, Bar Harbor, ME) were maintained in the specific pathogen-free (SPF) Animal Facility at the University of Macau under controlled environmental conditions (temperature: 22 ± 1 °C; humidity: 50 ± 5%; 12-h light/dark cycle).
For tumor implantation, viable RB1-isogenic cell pairs were prepared in a 1:1 mixture of phosphate-buffered saline (PBS) and Matrigel (Corning, Corning, NY). Cell suspensions containing PLC/PRF/5 RB1+/+ cells (5 × 10⁶ cells/mouse) and PLC/PRF/5 RB1−/− cells (5 × 10⁶ cells/mouse) were subcutaneously injected into the right and left flanks of nude mice, respectively. Tumor growth was monitored daily until tumors became palpable. Drug treatments were initiated when tumors reached approximately 100 mm³ in volume. Mice were randomly assigned to treatment groups (n = 8 per group) and administered the following treatments via intraperitoneal injection: (1) Vehicle control: sterile saline containing 5% DMSO, 5% Tween-80, and 5% polyethylene glycol-400, administered every four days; (2) alisertib: 10 mg/kg administered daily; (3) ispinesib: 0.5 mg/kg administered every four days; (4) volasertib: 10 mg/kg administered twice weekly; (5) talazoparib: 0.25 mg/kg administered daily. Tumor dimensions and mouse body weights were recorded every three days to evaluate drug efficacy and potential toxicity. Tumor volume (mm³) was calculated using the ellipsoid formula: volume = length × width² × p/6, where length represents the longest diameter and width represents the perpendicular diameter. For the drug combination study, animals were randomized into seven treatment groups: two vehicle control groups, three single‑agent groups (alisertib, ispinesib, or talazoparib), and two combination groups (alisertib plus talazoparib and ispinesib plus talazoparib). Because talazoparib was included in both combination regimens, the talazoparib single‑agent group served as the shared control for both corresponding analyses. In the combination arms, each compound was administered at half of the dose used in the individual synthetic lethal testing, following the same dosing schedule: 5 mg/kg alisertib, 0.25 mg/kg ispinesib, and 0.125 mg/kg talazoparib. For the toxicological assessment in mice treated with drug combinations, serum alanine aminotransferase (ALT) activity was measured at the study endpoint using a commercial kit (Jiancheng, China) following the IFCC‑recommended UV kinetic method, in accordance with the manufacturer’s instructions. ALT activity is reported in units per liter (U/L).
IHC analysis of mouse tumor tissues
For IHC analysis, excised tumor tissues were embedded in optimal cutting temperature (OCT) compound (Sakura Finetek, Netherlands) and sectioned at 10 μm using a Leica CM3050 S cryostat (Leica Biosystems, Germany). The tissue sections were fixed in 4% paraformaldehyde (PFA) at room temperature for 30 min. Sections were treated with 3% hydrogen peroxide (H₂O₂) at room temperature for 10 min to block endogenous peroxidase activity. Non-specific binding sites were blocked with 3% bovine serum albumin (BSA) in phosphate-buffered saline (PBS) containing 0.1% Tween 20 for 1 h at room temperature.
Following blocking, the sections were incubated overnight at 4 °C with primary antibodies targeting either p-HH3 (Ser10) or γ-H2AX (Ser139) (antibody details provided in Supplementary Table 15). Sections were then washed three times with PBS (5 minutes each) and incubated with horseradish peroxidase (HRP)-conjugated secondary antibodies for 1 hour at room temperature. After three additional washes with PBS (5 min each), antibody binding was visualized using 3,3’-diaminobenzidine (DAB) substrate solution. Sections were counterstained with hematoxylin, dehydrated through graded alcohols, cleared in xylene, and mounted with mounting medium. Digital images of the stained sections were acquired using a Hamamatsu Digital Slide Scanner NanoZoomer (Hamamatsu Photonics K.K., Japan) and analyzed using NDP.view2 software.
Transcriptomic data for the RB1
−/− cell lines and xenograft
Raw FASTQ files from RNA-sequencing data of RB1−/− PLC/PRF/5 xenograft samples (wild-type, n = 3; vehicle control, n = 3; alisertib-treated, n = 3; ispinesib-treated, n = 3; volasertib-treated, n = 3) were processed using a multistep alignment approach. Initially, reads were aligned using STAR aligner v2.7.9a88 against a combined hybrid genome of human (hg19) and mouse (mm10) references to separate human tumor-derived reads from mouse stroma-derived reads.
Using SAMtools v1.9, reads that specifically mapped to either the human or mouse genome were extracted and assigned to corresponding BAM files. Human-specific paired reads were then extracted using the SAMtools parameter -f 1 from BAM files that had been preprocessed by subtracting reads mapped to the mouse genome. Duplicate reads were subsequently identified and marked using Sambamba v0.8.2. The SamToFastq utility of Picard v2.26.6 was used to convert the processed BAM files back to paired-end FASTQ format.103 The resulting paired-end FASTQ files were realigned to the human genome (hg19) using the TCGA RNASeqV2 pipeline with upper quartile normalization. RNA-seq data generated in this study from xenograft tumors and human HCC cell lines have been deposited in GEO under accession number GSE306330.
Statistical analysis
Statistical comparisons of continuous and categorical variables were performed using the Wilcoxon rank sum test, Student’s t test, or one-way ANOVA, and Fisher’s exact test, respectively. Survival analyses employed the Kaplan‒Meier method with log-rank testing using the R package ‘survival’ version 3.2. Cox proportional hazards and logistic regression analyses were conducted to assess independent associations. Multivariable Cox regression analyses were primarily performed in 324 patients with complete clinical data. To evaluate the robustness of the findings and account for missing data, multivariate imputation by chained equations (MICE) was implemented using the R package mice,24 and the analyses were repeated in the full cohort (n = 560), excluding one TCGA-LIHC patient without available survival data. All analyses were performed using R version 4.0.2, with statistical significance set at two-sided p < 0.05.
