


Structural confirmation of microbial levan
Spectroscopic analyses confirmed that the purified polysaccharide is a levan-type fructan, consistent with previously reported microbial levans (Figs. S2 – S4). The obtained spectral signatures validated both its structural identity and high purity before biological evaluation. Comprehensive spectral characterization of the microbial levan is provided in Supplementary Data File 2.
Effect of therapeutic interventions on survival rate and EAC-associated morbidity
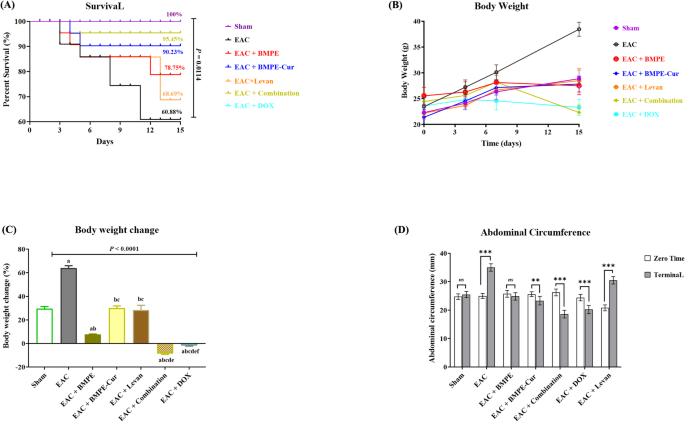
No mortality was observed in the sham or doxorubicin (DOX) groups, whereas the untreated EAC mice exhibited a 60.66% mortality rate by day 15 (Fig. 1A). All treatments significantly improved survival (P = 0.0114), reaching 78.57% (parent BMPE), 90.23% (BMPE–Cur), 95.45% (BMPE–Cur + Levan), 100% (DOX), and 68.69% (Levan). Untreated EAC mice developed progressive ascites, evidenced by marked increases in body weight (+ 63.9 ± 2.06%) and abdominal circumference (+ 40.0 ± 4.55%) vs. baseline, and by 33.18 ± 4.83% and 39.21 ± 3.71% relative to sham control (P < 0.0001 for all; Fig. 1B – D). All interventions significantly attenuated these parameters from day 7 onward (P < 0.0001). By day 15, body weight was reduced by 28.48 ± 3.82% (parent BMPE), 27.62 ± 2.98% (BMPE–Cur), 41.92 ± 3.61% (combination), 39.40 ± 4.85% (DOX), and 25.38 ± 3.16% (Levan), with corresponding decreases in abdominal circumference of 29.06 ± 3.16%, 33.34 ± 2.87%, 46.86 ± 4.11%, 42.29 ± 3.65%, and 12.86 ± 2.28%, respectively, compared to the untreated animals. Parent BMPE normalized both body weight and abdominal circumference relative to sham control, although a modest reduction in body weight change percentage remained evident (P < 0.0001). Likewise, BMPE–Cur and levan monotherapies produced terminal body weight changes comparable to those of sham animals. In contrast, DOX and BMPE–Cur + levan induced moderate but significant reductions in terminal body weight (–19.29 ± 3.04% and − 22.65 ± 2.94%, respectively) and abdominal circumference (–20.78 ± 2.74% and − 27.05 ± 3.33%, respectively) relative to sham controls (P < 0.0001 for all comparisons). However, whereas DOX-treated mice exhibited no significant difference between baseline and terminal body weight values, the combination treatment produced a significant reduction in body weight relative to baseline (P = 0.0214). Notably, despite comparable body weights, mice receiving BMPE–Cur + levan displayed a significantly smaller abdominal circumference than those treated with DOX alone (P = 0.0178).
Fig. 1
Effects of therapeutic interventions on survival, body weight, and abdominal circumference in EAC-bearing mice. (A) Kaplan–Meier survival curves showing improved survival in all treated groups compared with untreated EAC mice. No mortality was observed in the sham or DOX groups (n = 12 per group). Terminal survival rates reached 78.57% (parent BMPE, n = 8), 90.23% (BMPE–Cur, n = 10), 95.45% (BMPE–Cur + levan, n = 11), and 68.69% (levan, n = 7), compared with 39.34% (n = 6) in untreated EAC mice (P = 0.0114). (B, C) Changes in body weight and (D) abdominal circumference during the 15-day experimental period. Untreated EAC mice exhibited progressive increases in body weight and abdominal circumference, reaching 63.9% and 40.0% above baseline values, respectively, and 33.18% and 39.21% higher than sham controls (P < 0.0001). All treatments significantly reduced body weight and abdominal circumference relative to untreated EAC mice (P < 0.0001). Parent BMPE and BMPE–Cur normalized both parameters, whereas DOX and the combination produced moderate reductions relative to sham controls (P < 0.0001). Notably, mice receiving BMPE–Cur + levan displayed a lower abdominal circumference than DOX-treated animals (P = 0.0178). Data are presented as mean ± SD.
Effect of therapeutic interventions on tumor-associated hepatic dysfunction
Biochemically, the untreated EAC mice displayed pronounced hepatic injury, with ALT, AST, and ALP elevated by 38.39 ± 5.34%, 42.20 ± 4.53%, and 55.29 ± 3.42%, respectively (Fig. 2A–C), concurrent with 5 ± 0.93-fold and 4.69 ± 0.45-fold increases in total and direct bilirubin (P < 0.0001; Fig. 2D, E). All interventions significantly reduced ALT (–16.90% to − 33.33%), AST (–18.46% to − 44.32%), ALP (–33.37% to − 93.26%), total bilirubin (–62.30% to − 77.87%), and direct bilirubin (–58.56% to − 86.90%) (P < 0.01 to < 0.0001). parent BMPE and BMPE–Cur normalized ALT, AST, and ALP, with BMPE–Cur additionally restoring direct bilirubin but only partially correcting total bilirubin (P = 0.0183). The combination therapy almost normalized all hepatic markers and reduced ALP below sham levels (P < 0.0001), whereas the levan monotherapy normalized ALT and ALP, yielding lower ALT than BMPE (P = 0.0145) and lower ALP than DOX (P = 0.0009). However, serum levels of AST and direct BiL remained elevated compared with sham (P = 0.0016 and 0.003), BMPE–Cur and combination treatments (P < 0.01), as did the total BiL versus sham and the combination treatments (P < 0.0001 and 0.0002). In contrast, DOX failed to restore normal liver functions and showed inferior hepatoprotection relative to BMPE–Cur and the combination regimen despite the comparable outcomes to parent BMPE and levan monotherapies.
Fig. 2
Effect of different treatments on the liver function biomarkers in EAC mice. Untreated EAC mice showed marked elevations in ALT (A), AST (B), alkaline phosphatase (C), total bilirubin (D), and direct bilirubin (E) compared with sham control (P < 0.0001). All treatments significantly ameliorated these changes (P = 0.01 – < 0.0001). Parent BMPE and BMPE–Cur normalized ALT, AST, and AP, with BMPE–Cur additionally normalizing direct bilirubin. Combination therapy restored all liver parameters to sham levels and reduced AP below sham (P < 0.0001). The levan monotherapy normalized ALT and AP but showed higher AST and direct bilirubin than BMPE–Cur or combination therapy. DOX showed partial improvement but was less effective than BMPE–Cur or combination treatment. Data are mean ± SD. Statistical annotations: “a” vs. sham; “b” vs. EAC control; “c” vs. parent BMPE; “d” vs. BMPE–Cur; “e” vs. levan; “f” vs. combination.
Levan co-treatment enhances hepatic retention of BMPE–Cur nanocomplex
Quantitative LC–MS analysis demonstrated robust analytical performance, with linearity across 1–100 ppb and recovery values ranging from 95 to 109%. Curcumin was not detected in hepatic tissue in either nanocomplex-treated group. In contrast, the benzimidazole moiety (BMPE) was readily quantifiable following BMPE–Cur administration, whereas no corresponding signal was detected in mice receiving the parent BMPE formulation. Hepatic BMPE concentration increased from 2.352 ng/g in the BMPE–Cur group to 5.371 ng/g following co-administration with levan, representing a 2.3-fold increase in hepatic accumulation (P < 0.0001). To provide additional context for the observed biodistribution profile, in silico metabolism and transporter predictions were examined (Table 2). BMPE and curcumin were predicted to inhibit CYP2C19, CYP2C9, and CYP3A4, whereas fructose was predicted to inhibit CYP2C9 selectively. Curcumin was further predicted to act as a substrate for UDP-glucuronosyltransferase (UGT), sulfotransferase (SULT), and P-glycoprotein, while BMPE lacked predicted Phase II liabilities and was classified as a non-substrate for P-glycoprotein. Collectively, these findings demonstrate enhanced hepatic accumulation of BMPE following levan co-administration and provide a metabolic framework for subsequent mechanistic analyses.
Table 2 Predicted metabolic fate of key pharmacophores investigated in this study.
Levan co-treatment enhances the antitumor and anti-angiogenic activity of BMPE–Cur
The progression of EAC-induced hepatic tumorigenesis was associated with marked elevations in circulating and hepatic tumor-associated and angiogenic biomarkers compared with sham controls (Fig. 3A, B). Serum AFP, CEA, and VEGFR increased by 70.92 ± 2.22%, 97.17 ± 3.54%, and 93.18 ± 1.16%, respectively, while hepatic levels increased by 74.49 ± 1.41%, 77.32 ± 2.4%, and 84.26 ± 2.36% (P < 0.0001 for all). All therapeutic interventions significantly reduced these biomarkers relative to untreated EAC mice. Among the tested treatments, BMPE–Cur combined with levan produced the most pronounced effect, restoring AFP, CEA, and VEGFR to near-baseline levels and significantly outperforming free BMPE, DOX, and levan monotherapy. BMPE–Cur alone ranked second and consistently achieved greater suppression of tumor-associated biomarkers than free BMPE. Although DOX, free BMPE, and levan monotherapies also reduced biomarker levels, their effects were less pronounced and failed to normalize most parameters. Consistent with these findings, untreated EAC-bearing mice exhibited extensive peritoneal angiogenesis characterized by dense, tortuous, and highly branched neovasculature (Fig. 3D), whereas sham-operated animals displayed sparse and orderly vascular architecture (Fig. 3C). All treatments significantly inhibited angiogenesis compared with untreated EAC mice (P < 0.0001; Fig. 3J). Treatment with parent BMPE resulted in moderate inhibition of angiogenesis (–68.6 ± 2.7%), with a visible reduction in vessel density compared to the untreated group (Fig. 3E). Notably, the BMPE–Cur nanocomplex induced a more pronounced anti-angiogenic effect (–76.8 ± 2.39%), characterized by fewer and thinner blood vessels (Fig. 3F) than that in BMPE group (P = 0.0061). The combination of BMPE–Cur with levan produced the strongest suppression of angiogenesis (–86 ± 2.91%), outperforming both BMPE (P < 0.0001) and BMPE–Cur alone (P = 0.0005), where only sparse, fine vessels resembling normal vasculature were detected (Fig. 3G). Treatment with DOX (Fig. 3H) produced a significant reduction of neovascularization (–61.6 ± 2.7%), with fewer and thinner blood vessels compared to untreated EAC; however, this effect was weaker than that of parent BMPE (P = 0.009), BMPE–Cur alone, and in combination (P < 0.0001 for both). Levan monotherapy produced the least effective anti-angiogenic effect among all treatments (–53.8 ± 4.66%, P = 0.0033 – < 0.0001), showing visible but reduced vessel branching relative to untreated control (Fig. 3I).
Fig. 3
Effects of levan co-treatment on inhibition of peritoneal angiogenesis and tumor-associated biomarkers. Untreated mice showed marked elevations in circulating and hepatic AFP, CEA, and VEGFR versus sham (P < 0.0001, A, B). All treatments reduced these biomarkers, with the combination restoring hepatic AFP and VEGFR and circulating/hepatic CEA to near-baseline levels. BMPE–Cur ranked second and outperformed parent BMPE. The qualitative assessment revealed normal peritoneal vasculature in sham mice with few thin and orderly blood vessels visible, indicating the absence of pathological angiogenesis (C). In contrast, the control EAC mice exhibited extensive pathological angiogenesis (D), as indicated by numerous newly formed tortuous neovascularization radiating over the peritoneal surface (black arrows) and dilated blood vessels (white arrows). Treatment with parent BMPE (E) resulted in a noticeable reduction in neovascularization compared to untreated EAC, where neovascularization appears less dense and less irregular, suggesting moderate inhibition of angiogenesis. Further inhibition of angiogenesis was observed in BMPE-Cur-treated mice (F) compared to the parent compound (P = 0.0061), as indicated by less dense, thinner, and less branched blood vessels, indicating a stronger anti-angiogenic effect. The most prominent anti-angiogenic effect was observed in EAC mice receiving the BMPE–Cur + levan combination (G), with only a few fine, normal-like vessels observed. DOX treatment (H) significantly reduced neovascularization, with fewer and thinner vessels compared to untreated EAC, showing a less effective inhibition than parent BMPE (P = 0.009), BMPE–Cur alone, and in combination (P < 0.0001 for both). The levan monotherapy (I) presented the least effective anti-angiogenic effect compared with other treatments (P = 0.0033 – < 0.0001), showing a mild reduction in angiogenesis compared to untreated mice (–53.8 ± 4.66%), but vessels are still visible. Quantitative analysis (J) revealed significant inhibition of angiogenesis in all treated groups (P < 0.0001) compared with untreated EAC mice, with the combination treatment achieving the strongest anti-angiogenic effects. Data are mean ± SD. Statistical annotations: “a” vs. sham; “b” vs. EAC control; “c” vs. parent BMPE; “d” vs. BMPE–Cur; “e” vs. levan; “f” vs. combination.
Levan co-treatment restores hepatic redox homeostasis
Biochemical analysis of liver tissue revealed marked alterations in hepatic redox balance across the experimental groups. Relative to sham control, the untreated EAC animals exhibited significant elevation of liver nitrite (NO; +76.45 ± 3.29%; Fig. 4A) and lipid peroxidation (MDA; +74.57 ± 4.23%; Fig. 4B), accompanied by substantial depletion in endogenous. In parallel to metabolic dysfunction, biochemical analysis of liver tissue revealed marked alterations in hepatic redox balance across the experimental groups. Relative to sham control, the untreated EAC animals exhibited significant elevation of liver nitrite (NO; +76.45 ± 3.29%; Fig. 4A) and lipid peroxidation (MDA; +74.57 ± 4.23%; Fig. 4B), accompanied by substantial depletion in endogenous antioxidant defenses, including reduced glutathione (GSH; − 57.93 ± 3.88%; Fig. 4C), catalase (–34.15 ± 2.73%; Fig. 4D) and superoxide dismutase (SOD; − 58.34 ± 3.13%; Fig. 4E) (P < 0.0001/all markers). Except for DOX, which showed comparable catalase activity to the untreated animals, all other treatments significantly improved redox homeostasis, with the combination showing the strongest antioxidant effect. This regimen not only normalized oxidative damage markers (MDA: − 72.11 ± 4.64%), but elevated endogenous antioxidant defenses beyond physiological levels (GSH: +55.06 ± 2.73%; catalase: +60.31 ± 1.98%, and SOD: +87.74 ± 2.72% beyond sham levels, while suppressing NO below basal values (–94.04 ± 2.73%; P < 0.0001 vs. untreated mice; P = 0.0138 vs. sham). BMPE–Cur monotherapy exhibited comparable efficacy, normalizing NO (–81.54 ± 2.58%) and catalase (+ 27.21 ± 2.99%), and markedly enhancing SOD (+ 76.87 ± 4.45%, P < 0.0001). However, MDA remained elevated (P = 0.0055), and GSH was only partially restored (P = 0.0009), with no difference observed relative to the combination regarding catalase content. Other treatments significantly improved oxidative indices, reducing NO (–12.10% to − 70.65%) and MDA (–32.30% to − 57.47%) and increasing GSH (+ 34.96% to + 38.36%), catalase (+ 16.45% to + 51.55%), and SOD (+ 44.47% to + 84.41%) (P = 0.035 to < 0.0001), but none fully restored them to normal levels. The parent BMPE compound produced NO and GSH levels comparable to levan monotherapy but achieved more suppression of MDA levels (P = 0.0076), whereas the latter promoted catalase and SOD activities (P < 0.0001). Compared with DOX, all treatments except levan further reduced NO (P < 0.0001) and MDA (P = 0.0079 to < 0.0001), while BMPE–Cur and the combination significantly increased GSH (P = 0.017 and < 0.0001). Notably, the levan monotherapy uniquely enhanced catalase and SOD activities beyond DOX and the BMPE-Cur monotherapy (P < 0.0001).
Fig. 4
Effects of levan co-treatment on hepatic redox balance. Untreated EAC mice showed severe oxidative stress, with increased NO (A) and MDA (B) and depleted GSH (C), catalase (D), and SOD (E) (P < 0.0001). All interventions improved redox balance, with BMPE–Cur + levan producing the strongest antioxidant effect, normalizing MDA and GSH, reducing NO below sham levels, and elevating catalase and SOD above baseline (P < 0.0001). Data are mean ± SD. Statistical annotations: “a” vs. sham; “b” vs. EAC control; “c” vs. parent BMPE; “d” vs. BMPE–Cur; “e” vs. levan; “f” vs. combination.
Levan co-treatment reprograms systemic and hepatic immune landscapes
Untreated EAC mice exhibited pronounced systemic immune dysregulation, reflected by significant elevations in circulating proinflammatory cytokines IL-6 and TNF-α (+ 62.97 ± 4.42% (P < 0.0001) and + 41.17 ± 4.87% (P = 0.0004), respectively) accompanied by marked depletion of CD4⁺ helper Th cells (–38.32 ± 7.06%) and expansion of CD8⁺ cytotoxic T cells (+ 48.71 ± 5.12%), resulting in a substantial reduction of the CD4⁺/CD8⁺ ratio by76.5 ± 2.59% (P < 0.0001; Fig. 5A). Concurrent increases in IL-10 (+ 43.40 ± 3.78%), CXCL1 (+ 41.34 ± 3.85%), and CD25⁺ regulatory T cells (+ 73.88 ± 3.75%) further indicated the establishment of a tumor-associated immunosuppressive milieu (P < 0.0001; Fig. 5B).
Fig. 5
Heatmap representation showing the effects of different treatments on peripheral and hepatic immune markers in EAC mice. Heatmap analysis of peripheral and hepatic immune profiles in EAC mice. (A, B): Untreated EAC mice exhibited peripheral immune dysregulation characterized by elevated IL-6, TNF-α, CD8⁺ T cells, IL-10, CXCL1, and CD25⁺ Tregs, with depletion of CD4⁺ T cells and reduced CD4⁺/CD8⁺ ratio (P < 0.0001). The combination therapy achieved a near-complete restoration of immune balance, normalizing cytokines, suppressing CD8⁺ and Tregs, and restoring the CD4⁺/CD8⁺ ratio. (C, D): Hepatic immune profiling revealed severe inflammatory and immunosuppressive imbalance in untreated EAC mice. Combination therapy exerted the strongest correction, restoring helper T-cell dominance and suppressing inflammatory and regulatory mediators (P < 0.0001), outperforming all monotherapies. Data are mean ± SD.
All therapeutic interventions partially mitigated these alterations; however, the magnitude of immune homeostasis differed markedly among treatment groups. BMPE–Cur monotherapy produced broad improvements, normalizing the cytokine levels and T-cell distributions, except for CD25⁺ Tregs (P < 0.0001 vs. sham), whereas co-administration with levan resulted in the most comprehensive correction of systemic immune dysregulation. This regimen normalized IL-6 (–48.91 ± 6.10%), TNF-α (–49.42 ± 5.19%), IL-10 (–42.53 ± 6.16%), CXCL1 (–43.54 ± 7.49%), CD8⁺ Tc cells (–54.55 ± 4.54%), and CD25⁺ Tregs (–57.90 ± 4.65%), while elevating CD4⁺ Th cells (+ 48.43 ± 4.46%) above sham levels, thereby restoring the CD4⁺/CD8⁺ ratio (all P < 0.0001). Monotherapies with free BMPE, levan, or DOX improved all immune indices but failed to fully re-establish immune equilibrium. Except for instances where BMPE–Cur monotherapy achieved comparable restoration of CD4⁺ T cells or IL-10 levels, comparative analyses confirmed that the combination regimen significantly outperformed all other treatments lowering systemic IL-6, TNF-α, CD8⁺ Tc cells, CXCL1, IL-10, and CD25⁺ Tregs (P = 0.0424–0.0014), and increasing CD4⁺ Th cells and the CD4⁺/CD8⁺ ratio (P = 0.0265 – < 0.0001). The levan monotherapy showed an immune profile broadly comparable to DOX, with slightly elevated IL-6 levels (P = 0.029), but the latter induced higher CD4⁺ counts than other treatments (P < 0.0001).
A similar pattern was observed at the hepatic level. Untreated EAC mice displayed severe hepatic immune dysregulation, characterized by marked elevation of IL-6 (+ 78.37 ± 3.46%), TNF-α (+ 87.30 ± 1.38%), CD8⁺ Tc cells (+ 63.17 ± 1.22%), IL-10 (+ 83.42 ± 3.13%), CXCL1 (+ 79.26 ± 3.11%), and CD25⁺ Tregs (+ 91.03 ± 3.67%), alongside profound depletion of CD4⁺ Th-cell depletion (–72.47 ± 3.89%), resulting in an 89.92 ± 1.07% reduction in the CD4⁺/CD8⁺ ratio (P < 0.0001 for all; Fig. 5C, D). While all treatments attenuated these disturbances, near-complete restoration of hepatic immune balance was achieved only with the combination regimen, showing the most pronounced suppression of IL-6 (–59.00 ± 6.55%), TNF-α (–61.10 ± 4.21%), IL-10 (–59.26 ± 3.44%), and CXCL1 (–67.30 ± 2.11%, P < 0.0001 for all). In parallel, this regimen presented the strongest recovery of CD4⁺ T cells (+ 82.63 ± 3.75%), while suppressing CD25⁺ Tregs (–69.63 ± 1.96%) and CD8⁺ Tc cells (–46.87 ± 1.76%), resulting in near-complete normalization of the hepatic CD4⁺/CD8⁺ ratio (+ 90.81 ± 1.69%; P < 0.0001 for all). Parent BMPE and levan monotherapies were less effective in correcting CD4⁺ depletion and regulatory T-cell expansion (P < 0.0001 and 0.003 vs. sham, respectively), but the nanocomplex alone exerted greater hepatic immunomodulatory effects than DOX; however, it remained inferior to the combination in restoring helper T-cell dominance (P < 0.0001). Relative to other treatments, the combination reduced inflammatory and immunosuppressive mediators by 15–50% (P = 0.0465 – < 0.0001) and increased CD4⁺ Th cells and CD4⁺/CD8⁺ ratios by 16–65% (P = 0.0065 – < 0.0001).
Levan co-treatment reprograms inflammatory and metabolic signaling pathways
Untreated EAC mice exhibited marked activation of the TLR2-associated inflammatory pathway, evidenced by increased hepatic expression of TLR2 (+ 1.81-fold), MyD88 (+ 9.43-fold), and NF-κB (+ 7.74-fold) relative to sham controls (Fig. 6A). This inflammatory phenotype was accompanied by significant suppression of the metabolic regulators FXR (–41.1%) and FGF15 (–51.3%) (Fig. 6B; P < 0.0001 for all comparisons), indicating concurrent immune and metabolic dysregulation. All treatments partially reversed these alterations; however, the magnitude of improvement varied considerably among groups. The combination of BMPE–Cur and levan produced the most pronounced response, reducing TLR2, MyD88, and NF-κB expression by 56.47%, 80.05%, and 78.93%, respectively, while simultaneously increasing FXR and FGF15 expression by 6.59- and 7.45-fold, respectively. These effects significantly exceeded those achieved by any monotherapy (P ≤ 0.0001). BMPE–Cur monotherapy ranked second, suppressing TLR2, MyD88, and NF-κB by 50.66%, 75.34%, and 68.45%, respectively, while increasing FXR and FGF15 expression by 3.84-fold and 2.44-fold (P < 0.0001). DOX and parent BMPE produced intermediate effects, whereas levan monotherapy exhibited the weakest overall modulation of both signaling axes. Nevertheless, DOX, BMPE, and levan increased FXR expression by 1.96-fold, 2.02-fold, and 1.28-fold, respectively, and FGF15 expression by 3.24-fold, 2.74-fold, and 1.70-fold, although the effect of levan on FGF15 did not differ significantly from untreated EAC mice. Comparative analyses confirmed that the combination regimen achieved significantly greater inhibition of TLR2 (5.81–22.50%), MyD88 (19.02–64.06%), and NF-κB (33.22–63.21%), together with significantly greater induction of FXR (40.13–80.52%) and FGF15 (32.76–77.17%), than all other treatments (P < 0.0001). Notably, although BMPE–Cur produced TLR2 and NF-κB inhibition comparable to DOX, it surpassed the reference drug in suppressing MyD88 expression and restoring FXR and FGF15 expression (P < 0.0001 for all comparisons).
Fig. 6
Heatmap representation of the effects of different treatments on hepatic TLR2-associated inflammatory signaling and FXR/FGF15 metabolic regulation in EAC-bearing mice. Untreated EAC mice exhibited marked activation of TLR2/MyD88/NF-κB signaling (A), evidenced by increased hepatic expression of TLR2 (1.81-fold), MyD88 (9.43-fold), and NF-κB (7.74-fold), accompanied by significant suppression of FXR (− 41.1%) and FGF15 (− 51.3%) expression (B) compared with sham controls (P < 0.0001 for all comparisons). All treatments partially reversed these alterations; however, BMPE–Cur combined with levan produced the most pronounced response, reducing TLR2, MyD88, and NF-κB expression by 56.47%, 80.05%, and 78.93%, respectively, while increasing FXR and FGF15 expression by 6.59- and 7.45-fold, respectively (P < 0.0001 vs. untreated EAC). BMPE–Cur monotherapy exhibited the second strongest effect, whereas DOX and parent BMPE produced intermediate responses. Levan monotherapy exerted the weakest overall modulation of both signaling axes, although partial restoration of pathway activity was observed. Comparative analyses demonstrated significantly greater suppression of TLR2-associated signaling and stronger restoration of FXR/FGF15 expression in the combination group relative to all other treatments (P < 0.0001).
Molecular docking supports direct interaction of BMPE and levan-derived ligands with TLR2
Consistent with the observed suppression of hepatic TLR2 signaling, molecular docking analysis revealed favorable interactions between TLR2 and the tested ligands, including BMPE, curcumin, and fructose (Fig. 7). BMPE and curcumin exhibited the highest binding affinities, each yielding a docking score of − 7.0 kcal/mol, compared with − 6.5 kcal/mol for the native ligand PE-DTPA and − 5.9 kcal/mol for the reference agonist Pam2CSK4. Fructose displayed a lower binding affinity of − 5.5 kcal/mol. As shown in Fig. 7A and B, BMPE occupied the hydrophobic ligand-binding cavity of TLR2 and closely overlapped one of the lipid chains of the native ligand. The benzimidazole NH group formed a hydrogen bond with Leu350 (2.37 Å), while additional interactions included van der Waals and π–π contacts with Phe322 and Phe355, together with alkyl and π–alkyl interactions involving Val343, Val348, Val351, and Pro352. Curcumin exhibited a comparable binding orientation within the same cavity (Fig. 7C, D). A hydrogen bond was formed with Ser346 (2.61 Å), accompanied by van der Waals and π–π interactions with Phe322, Phe349, and Phe355, as well as alkyl and π–alkyl contacts involving Ile319, Leu328, Val348, and Pro352. Structural superimposition demonstrated overlap of curcumin with approximately one and a half of the two lipid chains of the native ligand. Fructose adopted a distinct binding orientation relative to BMPE and curcumin (Fig. 7E, F). The molecule formed nine hydrogen bonds with Asp263, Asn267, Asp294, Phe295, Asp327, and Thr330 and occupied an adjacent polar cavity. Among these residues, Asp327 was shared with the reported TLR2 ligand-binding site. The docking poses of BMPE, curcumin, and fructose within TLR2 are summarized in Fig. 7G.
Fig. 7
Predicted binding modes of key pharmacophores with TLR2. (A): 2D-predicted binding mode of BMPE showing the types and distances of binding interactions within the TLR2 (PDB ID: 3A7C) binding pocket. (B): Superimposition of BMPE (pink) with the native ligand PE-DTPA (cyan) in the TLR2 binding pocket, displayed as tinted sticks. (C): 2D-predicted binding mode of curcumin (Cur) showing the types and distances of binding interactions within the TLR2 (PDB ID: 3A7C) binding pocket. (D): Superimposition of Cur (yellow) with the native ligand PE-DTPA (light blue) in the TLR2 binding pocket, displayed as tinted sticks. (E): 2D-predicted binding mode of fructose showing the types and distances of binding interactions within the TLR2 (PDB ID: 3A7C) binding pocket. (F): 3D-predicted binding mode of fructose (purple) positioned adjacent to the native ligand PE-DTPA (light blue) in a newly identified side pocket of TLR2 (PDB ID: 3A7C), represented as tinted sticks. (G): Combined 3D-predicted poses of BMPE (pink), Cur (yellow), and the native ligand PE-DTPA (light blue) within the main ligand-binding pocket, and fructose (purple) within a side pocket of TLR2 (PDB ID: 3A7C), all represented as tinted sticks.
Fig. 8
Histopathological examination of liver sections (H&E, scale bar = 400 μm) from experimental groups (n = 6–12). Sham control liver tissue (A) revealed preserved lobular architecture with well-arranged hepatocyte cords and intact sinusoids. Liver sections from untreated EAC control mice (B) showed marked architectural disruption, nuclear pleomorphism, increased cellular density, and necrotic foci (red arrows within circled area). The free BMPE-treated group (C) presented partial restoration of hepatic cords with visible central vein (red arrow); hepatocytes display reduced but persistent pleomorphism (black arrows), with scattered degenerating cells (yellow arrow). BMPE-Cur-treated group (D) showed marked histological improvement with preserved hepatocyte morphology, reduced necrotic changes (red arrow), and well-defined vasculature (black arrow). Combination (BMPE–Cur + levan) treatment (E) resulted in near-complete restoration of hepatic architecture, intact vascular structures (black arrow) and bile ducts (yellow arrow), with minimal residual degeneration (red arrows). DOX-treated group (F) showed improved lobular organization with a clear central vein (green arrow) and bile ducts (yellow arrow); however, mild degenerative changes (black/red arrows) indicate residual hepatotoxicity. The levan-treated group (G) showed moderate histological improvement compared with the untreated control; hepatocytes show partial preservation but still exhibit degenerative changes (red arrows) and sinusoidal congestion (black arrow).
Histopathological confirmation of antitumor efficacy
As demonstrated in Fig. 8, histopathological examination of sham control liver tissue revealed preserved lobular architecture with well-arranged hepatocyte cords and intact sinusoids. In contrast, liver tissues revealed profound alterations in the untreated EAC control group, which exhibited complete disruption of hepatic architecture, dense cellular infiltration, pronounced nuclear pleomorphism, and necrotic foci, consistent with malignant progression. Treatment with the parent BMPE partially alleviated these alterations, restoring some hepatic cords and central veins, although residual degenerative changes and nuclear irregularities persisted. The BMPE–Cur nanocomplex produced a more pronounced improvement, characterized by preserved hepatocellular morphology, reduced necrosis, and well-defined sinusoidal spaces. Strikingly, the combination therapy demonstrated the most potent hepatoprotective effect, with near-normal lobular organization, intact vascular and biliary structures, and only minimal evidence of degeneration. Treatment with DOX significantly improved hepatic architecture; however, mild degenerative and congestive changes remained, reflecting its known hepatotoxic potential. In contrast, the levan monotherapy showed partial amelioration, with reduced but persistent degenerative changes and sinusoidal congestion, suggesting a supportive protective role rather than curative efficacy. Collectively, these findings indicate that the combination therapy exerts the strongest therapeutic effect, surpassing both single-drug regimens and probiotics alone. Comparative histopathological assessment of liver sections from control mice and different treated groups is summarized in Table 3.
Table 3 Comparative histopathological assessment of liver sections from untreated EAC-bearing mice and different treatment groups.
Mathematical evaluation of BMPE–Cur and levan interaction profiles
Isobolographic analysis was performed to quantitatively assess the interaction between BMPE–Cur and levan across multiple biological endpoints (Supplementary Table S3). Combination index values indicated synergistic interactions (CI < 1) for the majority of evaluated parameters, particularly those associated with tumor burden, angiogenesis, oxidative stress, inflammatory signaling, and metabolic regulation. The strongest synergistic interactions were observed for angiogenic markers (VEGFR), tumor-associated biomarkers (AFP and CEA), inflammatory mediators including IL-6 and TNF-α, components of the TLR2/MyD88/NF-κB signaling pathway, and the FXR/FGF15 metabolic axis. Synergistic antioxidant effects were also evident, as reflected by coordinated reductions in NO and MDA together with enhancement of endogenous antioxidant defenses. Immune-related endpoints displayed variable interaction profiles. Synergism was observed for CD8⁺ cytotoxic T cells, CD25⁺ regulatory T cells, and tissue inflammatory mediators. In contrast, partial antagonism was detected for selected systemic immune parameters, including serum IL-10 and peripheral CD4⁺ T cells, whereas hepatic IL-10 retained a synergistic interaction profile. Overall, the calculated combination indices demonstrated predominantly synergistic interactions between BMPE–Cur and levan across the evaluated tumor-associated, immunological, oxidative, and immunometabolic endpoints.
